HAL Id: hal-00297372
https://hal.archives-ouvertes.fr/hal-00297372
Submitted on 13 Jan 2006
HAL is a multi-disciplinary open access
archive for the deposit and dissemination of
sci-entific research documents, whether they are
pub-lished or not. The documents may come from
teaching and research institutions in France or
abroad, or from public or private research centers.
L’archive ouverte pluridisciplinaire HAL, est
destinée au dépôt et à la diffusion de documents
scientifiques de niveau recherche, publiés ou non,
émanant des établissements d’enseignement et de
recherche français ou étrangers, des laboratoires
publics ou privés.
The application of LEPS technique for Quantitative
Precipitation Forecast (QPF) in Southern Italy
S. Federico, E. Avolio, C. Bellecci, M. Colacino
To cite this version:
S. Federico, E. Avolio, C. Bellecci, M. Colacino. The application of LEPS technique for Quantitative
Precipitation Forecast (QPF) in Southern Italy. Advances in Geosciences, European Geosciences
Union, 2006, 7, pp.1-8. �hal-00297372�
SRef-ID: 1680-7359/adgeo/2006-7-1 European Geosciences Union
© 2006 Author(s). This work is licensed under a Creative Commons License.
Advances in
Geosciences
The application of LEPS technique for Quantitative Precipitation
Forecast (QPF) in Southern Italy
S. Federico1,2, E. Avolio1,3, C. Bellecci1,3, and M. Colacino2
1CRATI Scrl, c/o University of Calabria, 87036 Rende (CS), Italy 2CNR-ISAC, via del Fosso del Calvaliere, 100, 00133 Rome, Italy 3Facolt`a di Ingegneria, Universit`a di “Tor Vergata”, Rome, Italy
Received: 7 October 2005 – Revised: 14 December 2005 – Accepted: 20 December 2005 – Published: 13 January 2006
Abstract. This paper reports preliminary results of a
Lim-ited area model Ensemble Prediction System (LEPS), based on RAMS, for eight case studies of moderate-intense pre-cipitation over Calabria, the southernmost tip of the Italian peninsula. LEPS aims to transfer the benefits of a probabilis-tic forecast from global to regional scales in countries where local orographic forcing is a key factor to force convection.
To accomplish this task and to limit computational time, in order to implement LEPS operational, we perform a clus-ter analysis of ECMWF-EPS runs. Starting from the 51 members that forms the ECMWF-EPS we generate five clus-ters. For each cluster a representative member is selected and used to provide initial and dynamic boundary conditions to RAMS, whose integrations generate LEPS. RAMS runs have 12 km horizontal resolution. Hereafter this ensemble will be referred also as LEPS 12L30.
To analyze the impact of enhanced horizontal resolution on quantitative precipitation forecast, LEPS 12L30 forecasts are compared to a lower resolution ensemble, based on RAMS that has 50 km horizontal resolution and 51 mem-bers, nested in each ECMWF-EPS member. Hereafter this ensemble will be also referred as LEPS 50L30.
LEPS 12L30 and LEPS 50L30 results were compared subjectively for all case studies but, for brevity, results are reported for two “representative” cases only. Subjective anal-ysis is based on ensemble-mean precipitation and probability maps. Moreover, a short summary of objective scores. Maps and scores are evaluated against reports of Calabria regional raingauges network.
Results show better LEPS 12L30 performance compared to LEPS 50L30. This is obtained for all case studies selected and strongly suggests the importance of the enhanced hori-zontal resolution, compared to ensemble population, for Cal-abria, at least for set-ups and case studies selected in this work.
Correspondence to: S. Federico
1 Introduction
Numerical Weather Prediction (NWP) models have notice-ably improved their performances in last fifteen-years due to several reasons as computer power increase, more detailed physical and numerical parameterizations, better processes formulation and to improvements in data assimilation. In ad-dition, the increase of computer power has introduced the use of General Circulation Model (GCM) Ensemble Prediction System (EPS) in several meteorological centers around the world (Molteni et al., 1996; Houtemaker et al., 1996; Toth and Kalnay, 1994).
In spite of these improvements, forecasts of highly local-ized and severe events is still a challenging problem. In particular the key role played by orographic features and mesoscale structures cannot be properly taken into account by GCM-EPS because of its coarse horizontal resolution. The ECMWF-EPS, at the time of writing, uses a T255L40 configuration that corresponds, for mid latitudes, to about 80 km horizontal resolution. This resolution is not enough to represent orographic forcing and mesoscale structures of Calabria, where this study is focused.
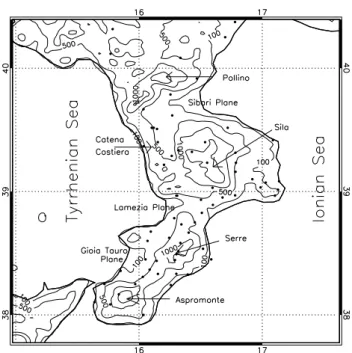
Calabria, Fig. 1, ranges between 38◦ and 40◦ latitude North and between 15◦300 and 17◦150longitude East. The west coast of the region is bounded by the Tyrrhenian Sea and the East and South coasts by the Ionian sea. Apennines run North to South along the peninsula and are characterized by five main topographical features reaching 1.5–2.0 km ele-vations.
In order to gain advantages of EPS in a region as Cal-abria the LEPS approach is investigated for eight case stud-ies. LEPS (Marsigli et al., 2001; Montani el al., 2003) aims to transport advantages of the ECMWF-EPS forecast at the mesoscale-regional scale by a limited area model to produce probabilistic forecasts. To reduce computing time, LEPS uses a cluster technique (Molteni et al., 2001). In our study a hierarchical cluster analysis is implemented and used to re-duce the whole ECMWF-EPS to five clusters. For each of
2 S. Federico et al.: The LEPS technique in Southern Italy
Fig. 1. Topography of Calabria averaged over 10 km2. Main features are also reported. Contours: 100 m, 500 m, 1000 m and 1400 m. Dots show raingauges locations.
them, a representative member (RM) is selected to force the multiscale, multipurpose meteorological model RAMS (Re-gional Atmospheric Modelling System, Pielke et al., 1992; Cotton et al., 2003). Distance between ensemble members is computed considering standardized anomalies of four mete-orological variables on three pressure levels. Metemete-orological discriminating variables are the zonal and meridional wind components (u, v), the relative humidity (RH) and the geopo-tential height (Z). Isobaric surfaces are 850 hPa, 700 hPa and 500 hPa. Variables and levels were selected by trials and errors in order to transfer key synoptic scale features from clusters elements to representative members. This system is tested for eight storms that produced moderate-intense rain-fall over Calabria. They are reported in Table 1.
The methodology adopted to cluster the ECMWF-EPS members and to select RM from each cluster was proposed by Molteni et al. (2001) and was adapted and used in Marsigli et al. (2001) and in Montani et al. (2003). In this study mi-nor changes are introduced to better focus on the target area that is 5 E–20 E; 35 N–45 N, i.e. the Central Mediterranean basin, and to take into account for event duration (t0+60 h to
t0+84 h, where t0is the initial simulation time).
2 Model configuration
In this paper we use RAMS 4.3 in its non-hydrostatic com-pressible form (Pielke et al., 1992; Cotton et al., 2003).
LEPS configuration has two nested grids with horizontal resolutions of 36 km and 12 km, respectively, and their do-mains cover the Central Mediterranean basin and Calabria.
The technique for grid communication carries out the two-way approach described in Walko et al. (1994).
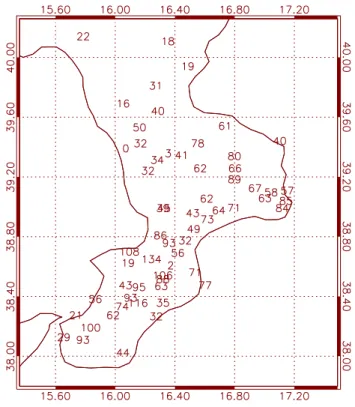
Figure 2 shows the domains used in this paper. Hereafter we will also refer to domains #1, and #2 and to their associ-ated grids as first and second domain and as first and second grid, respectively. LEPS 12L30 uses both domains.
In order to assess the improvements introduced by LEPS 12L30 higher horizontal resolution, we compare its performance with the LEPS 50L30 for all case studies se-lected in this paper. For LEPS 50L30, RAMS simulations have 50 km horizontal grid spacing and are nested in all 51 ECMWF-EPS runs. LEPS 50L30 domain extension is very similar to LEPS 12L30 first grid. There is a large reduction of ECMWF-EPS members with LEPS 12L30, from 51 to 5 members, and these simulations give an assessment of the relative impact on QPF of enhanced horizontal resolutions and ensemble members reduction.
We use thirty vertical levels up to 16 000 m in the ter-rain following coordinate system. Levels are not equally spaced: within the PBL (Planetary Boundary Layer) layers run about 50–200 m thick, whereas in the middle and upper troposphere they are 1000 m thick.
The parameterization of the surface-atmosphere diabatic processes is described in Walko (2000). Non convective pre-cipitation is computed from explicit prognostic equations for eight hydrometeors: total water, cloud particles, rain, pristine ice, snow, aggregates, graupel and hail. Convective precipita-tion is parameterized following Molinari and Corsetti (1985) who proposed a simplified form of the Kuo scheme that ac-counts for updrafts and downdrafts.
To verify forecasts, we use, mainly, a subjective approach. Subjective evaluation is done by a qualitative comparison of probability maps and ensemble mean precipitation maps with raw data from the raingauge regional network. Not all rain-gauges were working for all events and the number of report-ing stations ranges from 35 to 75. Figure 1 shows rareport-ingauges locations. To better appreciate the benefits of enhanced hori-zontal resolution we also report a short summary of objective probabilistic and deterministic scores.
Case studies are selected by requesting that at least 10 stations reported more than 30 mm/day. Calabria climate is rather dry and from October 2000 to May 2002, that is the time frame covered by our database, we found eight case studies. They are associated with typical storms that produce large and widespread rainfall over Calabria (Table 1).
3 Results
Even if our conclusions are based on eight case studies, we discuss, for brevity, only two of them. These are the 14 Jan-uary 2001, i.e. an Atlantic storm, and the 25 May 2002, i.e. a cyclone developed on the lee of the Alps. First case study is well represented by LEPS 50L30 and by LEPS 12L30, sec-ond event is badly forecast.
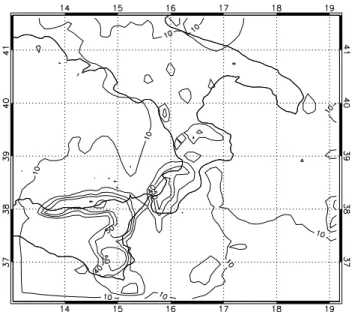
Figure 3 shows raingauge measurements for 14 January 2001 case study. Several stations reported more than 100 mm
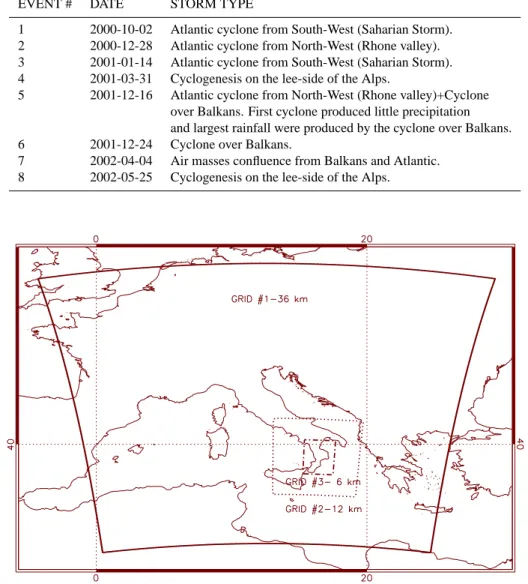
Table 1. Selected case studies.
EVENT # DATE STORM TYPE
1 2000-10-02 Atlantic cyclone from South-West (Saharian Storm). 2 2000-12-28 Atlantic cyclone from North-West (Rhone valley). 3 2001-01-14 Atlantic cyclone from South-West (Saharian Storm). 4 2001-03-31 Cyclogenesis on the lee-side of the Alps.
5 2001-12-16 Atlantic cyclone from North-West (Rhone valley)+Cyclone over Balkans. First cyclone produced little precipitation and largest rainfall were produced by the cyclone over Balkans. 6 2001-12-24 Cyclone over Balkans.
7 2002-04-04 Air masses confluence from Balkans and Atlantic. 8 2002-05-25 Cyclogenesis on the lee-side of the Alps.
Fig. 2. Simulations domains. Horizontal grid resolutions are 36 km and 12 km for first and second domains. We use the first domain (but
with 50 km horizontal resolution) for LEPS 50L30 and both domains for LEPS 12L30.
and maximum rainfall recorded is about 150 mm. There are two basic effects produced by local orography on precipita-tion. First of all rainfall is higher over elevated peaks as a consequence of the orographic uplift, second it is larger over the eastern half of Calabria due to the orographic shield. In-deed, for this storm, air masses crossed Calabria from South-East leaving more abundant rainfall on the upwind slope of mountains. It is worth to note that almost all raingauges on the East side of Calabria reported more than 50 mm.
Figure 4 shows ensemble mean precipitation (dashed con-tours) simulated by LEPS 50L30 considering the whole event duration. This map reports the ensemble mean. There is a large area where rainfall is greater than 10 mm. This area reflects the storm path that entered from Gibraltar strait and moved from West to East leaving a precipitation swath. Rainfall forecast is greater than 30 mm over eastern Calabria and there is an area with amounts larger than 50 mm.
Figure 4 reports the same map of discussed for LEPS 50L30 but for LEPS 12L30 first grid (solid contours). For consistency, in this paper, we use first LEPS grid output to derive precipitation and probability fields and to plot these fields on the same LEPS 50L30 subdomain. The effects of the inner LEPS 12L30 grid are transferred to the parent grid by the two-way interactive nesting. Figure 4 shows the LEPS 12L30 weighted mean precipitation and the weights are assigned according to RMs cluster population. Due to the higher horizontal resolution and to the two-way nest-ing, orographic forcing is better represented in LEPS 12L30 compared to LEPS 50L30 and a larger precipitation amount is simulated over eastern Calabria. In particular, for second LEPS 12L30 grid (not shown), rainfall is larger than 90 mm over main peaks and in large areas of eastern Calabria.
One of the key issues with EPS is to cast forecast in a prob-abilistic form. Figure 5 shows, respectively, the probability
4 S. Federico et al.: The LEPS technique in Southern Italy
Fig. 3. Raingauges reports for 14 January 2001 case study
(cumu-lated from 12 January – 23:00 UTC to 14 January – 22:00 UTC).
Fig. 4. LEPS 50L30 (dashed contours) and LEPS 12L30 (solid
contours) ensemble mean precipitation for 14 January 2001 case study (cumulated from 12 January – 23:00 UTC to 14 January – 22:00 UTC). Contours are for 10 mm, 30 mm and 50 mm. Simula-tions start on 11 January 2001, 12:00 UTC. The map is plotted for a subdomain centred in Southern Italy for clarity.
Fig. 5. LEPS 50L30 (dashed contours) and LEPS 12L30 (solid
contours) probability map to have more than 50 mm rainfall for 14 January 2001 case study. Contours are reported for 10%, 30% and 50%. To derive this map precipitation has been cumulated from 12 January – 23:00 UTC to 14 January – 22:00 UTC. Simulations start on 11 January 2001 – 12:00 UTC. The map is plotted for a subdo-main centred in Southern Italy for clarity.
Fig. 6. Raingauges reports for 25 May 2002 case study (cumulated
Fig. 7a. LEPS 12L30 first grid ensemble weighted mean
precip-itation for 25 May 2002 case study (cumulated from 23 May – 23:00 UTC to 25 May – 22:00 UTC). Contours are for 10 mm and 30 mm. Simulations start on 22 May 2002, 12:00 UTC. The map refers to LEPS 12L30 first domain and it is plotted for a subdomain centred in Southern Italy for clarity.
to have precipitation larger than 50 mm for LEPS 50L30 (dashed contours) and LEPS 12L30 first grid (solid con-tours), respectively. LEPS 12L30 probability is obtained weighting RMs probabilities according to cluster population. For LEPS 50L30 there is little suggestion for large rainfall; probability larger than 30% are reported for a little area in eastern Calabria. Due to the higher horizontal resolution and to the two-way nesting used in RAMS, LEPS 12L30 first grid shows probability larger than 50% over all east-ern Calabria and gives a much more clear suggestion of the storm severity compared to LEPS 50L30. There are signals of intense and abundant rainfall from LEPS 50L30, yet LEPS 12L30 highlights better precipitation field features over Calabria, both in terms of probability map and total pre-cipitation.
Figure 6 shows raingauges report for 25 May 2002 event. Amounts greater than 100 mm were recorded in eastern and southern Calabria and over main peaks. This reflects again the shield effect due to orographic barriers and rainfall uplift enhancement. Indeed, during the storm, air masses crossed Calabria mainly from South-East so larger precipitation were recorded on the upwind side of mountains and over main peaks.
Despite the storm intensity, LEPS 50L30 and LEPS 12L30 performance is unsatisfactory for this event. In particular LEPS 50L30 ensemble mean precipitation map (not reported) shows values less than 10 mm over Calabria. Probabilities to have rainfall larger than 10 mm and 20 mm
Fig. 7b. LEPS 12L30 first grid probability map to have more than
30 mm rainfall for 25 May 2002 case study. Contours are reported for 10% and 30%. To derive this map precipitation has been cumu-lated from 23 – 23:00 UTC to 25 – 22:00 UTC. Weights are assigned according to cluster population. Simulations start on 22 May 2002, 12:00 UTC. The map refers to LEPS 12L30 first domain and it is plotted for a subdomain centred in Southern Italy for clarity.
Fig. 7c. Maximum total rainfall for LEPS second grid for 25 May
2002 case study. To derive this map precipitation has been cumu-lated from 23 May – 23:00 UTC to 25 May – 22:00 UTC and for each grid point the maximum among RMs has been selected. Con-tours are for 10, 30, 40 and 50 mm.
are, respectively, less than 20% and 10% over the peninsula so LEPS 50L30 approach gives no signal for this severe case study.
6 S. Federico et al.: The LEPS technique in Southern Italy LEPS results are also unsatisfactory, but there are
im-provements due to the enhanced horizontal resolution. Fig-ure 7a shows LEPS 12L30 first grid cumulated precipita-tion. Contours are for 10 mm and 30 mm. Values larger than 30 mm are forecast in southern Calabria and values larger than 10 mm are reported almost everywhere over the penin-sula. Signals of a moderate storm come also from Fig. 7b that reports the probability to have precipitation larger than 30 mm. Values greater than 30% are forecast for southern Calabria.
Comparing LEPS 12L30 results and raingauges report it follows that simulations are unsatisfactory for this event be-cause there is no clear forecast of its severity and precip-itation simulated is too low. However LEPS 12L30 gives suggestion for a moderate event. It is worth noting that LEPS second grid (not reported) shows clearer signals for a moderate-intense event. In particular the probability map to have more than 30 mm rainfall is grater than 50% over southern Calabria and over the Sila mountain. Moreover, it is worthwhile to remark that Figs. 4 and 7a refer to the ensem-ble mean forecast of total precipitation. Because ensemensem-ble mean averages out small scale unpredictable detail it cannot be expected to show extreme precipitation totals.
To further explore the role of enhanced horizontal res-olution for this case study and to make a better use of LEPS 12L30 simulations when severe events are suspected to occur, we show the maximum for the LEPS 12L30 sec-ond grid in Fig. 7c. This map can be useful to the skilled forecaster but must be used carefully because in operations it can lead to overestimation. Precipitation larger than 50 mm is forecast over southern Calabria where the map is much more representative of storm severity compared to Fig. 7a.
The behaviour discussed for previous case studies is ob-tained for all events, i.e. there is a clear improvement of rainfall forecast fields when LEPS 12L30 is compared to LEPS 50L30, both in terms of probability maps and total precipitation. Considering also that CPU time required to run LEPS 12L30 (5 runs) is less than LEPS 50L30 (51 runs) we conclude that, for our case studies, it is convenient to run a high resolution ensemble with fewer members than the whole LEPS 50L30. For cases with larger spread and for which local forcing is less important, LEPS 50L30 perfor-mance should improve and the impact of members reduction should be larger. Our cases refer to intense and abundant precipitation where mesoscale and local scale play a funda-mental role and horizontal grid resolution is a key factor to improve forecast.
An ensemble system can provide both deterministic and probabilistic forecasts. Indeed each ensemble member repre-sents a deterministic forecast but the whole ensemble can be used to compute probabilities and can be validated in terms of probabilistic scores. A thorough review of scores used in this paper can be found in Wilks (1995), Mason and Graham (1999) and Stanski et al. (1989).
Deterministic scores analyzed are the bias (BIA), the equi-table threat score (ETS), the hit rate (HR) and the false alarm rate (FAR). BIA measures if the model overforecast or
under-forecast precipitation frequency over an area for a selected threshold. If BIA>1 the model overestimates the precipita-tion area, if BIA<1 the model underestimates this area. For a perfect forecast BIA=1. The most widely used score is Equi-table Threat Score (ETS). For a perfect forecast ETS is equal to 1, while it is less than or equal to zero for a useless fore-cast. HR (Hit Rate) and FAR (False Alarm Rate) represent, respectively, the proportion of events that were actually fore-cast and the proportion of non-events that were incorrectly forecast to occur (Wilks, 1995).
Probabilistic scores considered are relative operating char-acteristic (ROC) area (Mason and Graham, 1999) and Brier score (Stanski et al., 1989; Wilks, 1995). Forecast qual-ity is often summarized in terms of the area (A) under the ROC curve, with a skilful system having A significantly greater than 0.5. The Brier score is defined as the average of squared differences between forecast probabilities and the corresponding binary values representing occurrence/non oc-currence of the event (Wilks, 1995; Stanski et al., 1989). It is a negatively oriented score: for a perfect forecast Brier score is equal to zero.
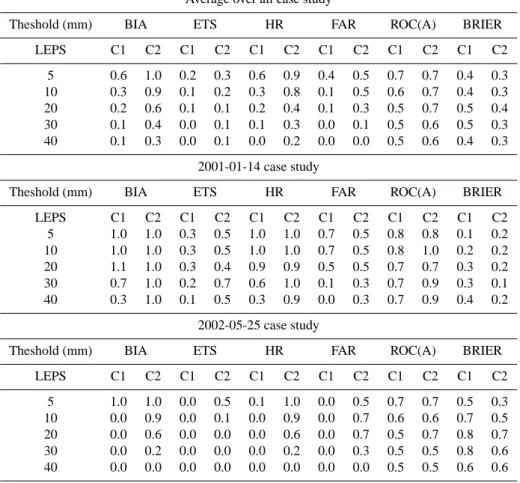
Table 2 shows statistics for the average over all case stud-ies and for the two cases subjectively evaluated above. Statis-tics for other case studies lie between the two events dis-cussed subjectively. To compute scores for different model resolutions we performed a remapping for both LEPS config-urations on a common 0.1◦*0.1◦grid. Deterministic scores
refer to ensemble weighted mean (EM) and LEPS 12L30 results are from second grid output. Comparing LEPS scores, Table 2, it follows that LEPS 12L30 clearly outper-forms LEPS 50L30. Indeed, considering the average over all case studies, it follows that LEPS 50L30 EM is not able to represent local orographic forcing and precipitation is largely underestimated for thresholds larger than 10 mm. This behaviour is confirmed also by subjective analysis of LEPS 50L30 members outputs. LEPS 12L30 EM has useful scores for all thresholds considered even if its underestima-tion is evident for the 40 mm threshold.
Comparing results for case studies it follows a large spread of model performance. When large scale forcing is not well represented by ECMWF-EPS, as for 2002-05-22, perfor-mance is poor for both LEPS configurations. However, also in this case, LEPS 12L30 outperforms LEPS 50L30 because of its higher horizontal resolution that better represents the mesoscale forcing. In particular LEPS 12L30 gives hints of moderate precipitation as shown by BIA values greater than zero up to 30 mm thresholds, however, for larger thresholds, FAR is greater than HR and precipitation forecast is mislo-cated.
4 Conclusions
We investigate the possibility of forecasting severe weather events by the LEPS methodology over a mountainous penin-sula in southern Italy. The aim of LEPS is to transfer advan-tages of probabilistic forecast from global to regional scale
Table 2. Deterministic and probabilistic scores for LEPS 50L30, referred as C1 (configuration #1), and LEPS 12L30, referred as C2
(configuration #2). Statistics are reported for the average over all events and for case studies subjectively analyzed. Objective deterministic scores refer to ensemble weighted mean.
Average over all case study
Theshold (mm) BIA ETS HR FAR ROC(A) BRIER
LEPS C1 C2 C1 C2 C1 C2 C1 C2 C1 C2 C1 C2 5 0.6 1.0 0.2 0.3 0.6 0.9 0.4 0.5 0.7 0.7 0.4 0.3 10 0.3 0.9 0.1 0.2 0.3 0.8 0.1 0.5 0.6 0.7 0.4 0.3 20 0.2 0.6 0.1 0.1 0.2 0.4 0.1 0.3 0.5 0.7 0.5 0.4 30 0.1 0.4 0.0 0.1 0.1 0.3 0.0 0.1 0.5 0.6 0.5 0.3 40 0.1 0.3 0.0 0.1 0.0 0.2 0.0 0.0 0.5 0.6 0.4 0.3 2001-01-14 case study
Theshold (mm) BIA ETS HR FAR ROC(A) BRIER
LEPS C1 C2 C1 C2 C1 C2 C1 C2 C1 C2 C1 C2 5 1.0 1.0 0.3 0.5 1.0 1.0 0.7 0.5 0.8 0.8 0.1 0.2 10 1.0 1.0 0.3 0.5 1.0 1.0 0.7 0.5 0.8 1.0 0.2 0.2 20 1.1 1.0 0.3 0.4 0.9 0.9 0.5 0.5 0.7 0.7 0.3 0.2 30 0.7 1.0 0.2 0.7 0.6 1.0 0.1 0.3 0.7 0.9 0.3 0.1 40 0.3 1.0 0.1 0.5 0.3 0.9 0.0 0.3 0.7 0.9 0.4 0.2 2002-05-25 case study
Theshold (mm) BIA ETS HR FAR ROC(A) BRIER
LEPS C1 C2 C1 C2 C1 C2 C1 C2 C1 C2 C1 C2 5 1.0 1.0 0.0 0.5 0.1 1.0 0.0 0.5 0.7 0.7 0.5 0.3 10 0.0 0.9 0.0 0.1 0.0 0.9 0.0 0.7 0.6 0.6 0.7 0.5 20 0.0 0.6 0.0 0.0 0.0 0.6 0.0 0.7 0.5 0.7 0.8 0.7 30 0.0 0.2 0.0 0.0 0.0 0.2 0.0 0.3 0.5 0.5 0.8 0.6 40 0.0 0.0 0.0 0.0 0.0 0.0 0.0 0.0 0.5 0.5 0.6 0.6
where localized meteorological systems can produce severe weather and damages. In order to accomplish with this task LEPS uses a limited area model with a much higher horizon-tal resolution compared to currently available global circula-tion models EPS.
LEPS methodology, based on RAMS 4.3, was tested for eight case studies. Even if we cannot draw any general con-clusion, due to the limited extent of our database, there are valuable suggestions for future works and for LEPS opera-tional set-up.
Because of the higher spatial horizontal resolution, LEPS 12L30 rainfall patterns are closer to the observations compared to LEPS 50L30. This is related to a better rep-resentation of local scale and mesoscale forcing. Subjective analysis shows that when large scale forcing is properly rep-resented by ECMWF-EPS, LEPS 50L30 and LEPS 12L30 performance is satisfactory. Nevertheless LEPS 12L30 gives more detailed patterns and precipitation amounts are closer to observations. When large scale forcing is not well forecast by ECMWF-EPS, LEPS 50L30 and LEPS 12L30 performs badly. However, also in this case LEPS 12L30 outperforms LEPS 50L30 because of the higher horizontal resolution and
gives hints of moderate-severe weather, at least for case stud-ies selected. Objective scores analysis confirms that result.
Other aspects of LEPS methodology need to be assessed. Mainly, LEPS reduces ECMWF-EPS from 51 members to 5 RMs, even if it takes into account for cluster population in the post processing stage. The impact of ensemble size reduction need to be carefully assessed for first and higher order mo-ments. Previous studies with GCM (Toth and Kalnay, 1997; Leith, 1974; Houtemaker and Derome, 1995) show that re-garding forecast skill only minor improvement is obtained beyond 10 members but the spatial and temporal relationship between spread and error improves well beyond this limit. This is an open question in LEPS.
Acknowledgements. This work was realized in the framework
of the project “SAI - Messa a punto di un Sistema per l’Allerta precoce di Incendi e per la minimizzazione dei falsi allarmi” funded by “Ministero dell’Universit`a e della Ricera Scientifica”. We acknowledge APAT – Dipartimento Tutela delle Acque Interne e Marine for raingauge data. We are grateful to the Italian Air Force and ECMWF for MARS database account.
8 S. Federico et al.: The LEPS technique in Southern Italy
Edited by: V. Kotroni and K. Lagouvardos Reviewed by: anonymous referee
References
Cotton, W. R., Pielke, R. A. Sr., Walko, R. L., Liston, G. E., Tremback, C. J., Jiang, H., McAnelly, R. L., Harrington, J. Y., Nicholls, M. E., Carrio, G. G., and McFadden, J. P.: RAMS 2001: Current status and future directions, Meteor. Atm., 82, 5– 29, 2003.
Houtemaker, P. L. and Derome, J.: Methods for ensemble predic-tion, Mon. Wea. Rev., 123, 2181–2196, 1995.
Houtemaker, P. L., Derome, J., Ritchie, H., and Mitchell, H. L.: A systematic simulation approach to ensemble prediction, Mon. Wea. Rev., 118, 1429–1443, 1996.
Leith, C. E.: Theoretical skill of Monte Carlo forecasts, Mon. Wea. Rev., 102, 409–418, 1974.
Marsigli, C., Montani, A., Nerozzi, F., Paccagnella,T., Tibaldi, S., Molteni, F., and Buizza, R.: A strategy for high-resolution en-semble prediction. Part II: limited-area model experiments in four Alpine flood events, Quart. J. Roy. Meteor. Soc., 127, 2095– 2115, 2001.
Mason, S. J. and Graham, N. E.: Conditional probabilities, rela-tive operating characteristics and relarela-tive operating levels, Wea. Forecast., 14, 713–725, 1999.
Molinari, J. and Corsetti, T.: Incorporation of cloud-scale and mesoscale down-drafts into a cumulus parametrization: results of one and three-dimensional integrations, Mon. Wea. Rev., 113, 485–501, 1985.
Molteni, F., Buizza, R., Marsigli, C., Montani, A., Nerozzi, F., and Paccagnella, T.: The ECMWF Ensemble Prediction System: Methodology and validation, Quart. J. Roy. Meteor. Soc., 122, 73–119, 1996.
Molteni, F., Buizza, R., Marsigli, C., Montani, A., Nerozzi, F., and Paccagnella, T.: A strategy for high-resolution ensemble pre-diction. Part I: definition of representative members and global model experiments, Quart. J. Roy. Meteor. Soc., 127, 2069– 2094, 2001.
Montani, A., Marsigli, C., Nerozzi, F., Paccagnella,T., Tibaldi, S., and Buizza, R.: The Soverato flood in Southern Italy: perfor-mance of a global and limited-area ensemble forecasts, Nonlin. Processes Geophys., 10, 261–274, 2003.
Pielke, R. A., Cotton, W. R., Walko, R. L., Tremback, C. J., Lyons, W. A., Grasso, L. D., Nicholls, M. E., Murran, M. D., Wesley, D. A., Lee, T. H., and Copeland, J. H.: A comprehensive meteo-rological modelling system-RAMS, Meteorol. Atmos. Phys., 49, 69–91, 1992.
Stanski, H. R., Wilson, L. J., and Burrows, W. R.: Survey of com-mon verification methods in meteorology, WMO World Weather Watch Tech. Report, 8, 1989.
Toth, Z. and Kalnay, E.: Ensemble forecasting at NMC: the gen-eration of perturbations, Bull. Am. Met. Soc., 125, 2317–2330, 1994.
Toth, Z. and Kalnay, E.: Ensemble forecasting at NCEP and the breeding method, Mon. Wea. Rev., 125, 3297–3319, 1997. Walko, R. L., Tremback, C. J., Pielke, R. A., and Cotton, W. R: An
interactive nesting algorithm for stretched and variable nesting ratio, J. Appl. Met., 34, 994–999, 1994.
Walko, R. L., Band, L. E., Baron, J., Kittel, T. G., Lammers, R., Lee, T. J., Ojima, D., Pielke, R.A. Sr., Taylor, C., Tague, C., Trem-back, C. J., and Vidale, P. L.: Coupled Atmosphere-Biosphere-Hydrology Models for environmental prediction, J. Appl. Met., 39, 931–944, 2000.
Wilks, D. S.: Statistical methods in the atmospheric sciences, Aca-demic Press, San Diego, CA, USA, 1995.