Chapter 11
Analytical strategies for the detection of counterfeit erectile
dysfunction drugs.
Pierre-Yves Sacré, Eric Deconinck, Jacques O. De Beer
Laboratory of Drug Analysis, Scientific Institute of Public Health, Rue Juliette Wytsman 14, 1050 Brussels, Belgium
Abstract:
Among all classes of drugs, the type 5 phosphodiesterase inhibitors (PDE5-i) (sildenafil,
vardenafil and tadalafil) are the most counterfeited and copied in industrialized countries.
This is why it is very important for regulatory agencies to have a panel of analytical methods
to analyse these drugs and to be able to detect counterfeit or substandard medicines.
During this chapter, several analytical techniques will be described and discussed. Among
spectroscopic techniques, Raman, NIR, FT-IR and chemical imaging techniques will be
envisaged. Their ability to detect counterfeits and predict if a new sample is genuine or not
will be presented. Other techniques such as XRay powder diffraction and NMR
spectroscopies will be briefly presented.
Chromatographic impurity fingerprints will be considered and described for the analysis of
suspect samples of Cialis® and Viagra®. Once again, the possibility to predict the authenticity
of a new sample by the mean of this technique is envisaged.
Finally, a MS-compatible UHPLC-UV method for the analysis of the three authorised PDE5-i
and some of their analogues will be shortly described. This technique has been validated
using spiked placebo samples in a vegetal matrix representing a suspect sample with a
complex matrix.
As a conclusion, a generic strategy for the detection and quality evaluation of counterfeit
1. Introduction:
The counterfeiting of medicines exists for millennia. At the first century of our era, Pedanius
Dioscorides, a Greek physician, already warned about the dangers of adulterated drugs
(WHO, 1999). Since then, many crises of falsification of medications have been documented
(Newton et al., 2006). Most of those crises implicated falsified herbal medicines and resulted
in many deaths due to the lack of efficacy and/or toxicity of adulterated drugs. Categories of
adulterated drugs and the risks associated vary according to the region considered.
In developing countries, the most counterfeited class of medicine is the anti-infective class
(WHO, 2010). This represents a serious public health problem. Indeed, most of the
population buy their drugs in the street at low prices. These drugs generally have less or no
therapeutic activity. When treating diseases associated with a high untreated mortality such
as malaria, pneumonia, meningitis, AIDS, typhoid and tuberculosis with inefficient drugs,
mortality and morbidity increase. Moreover, the use of subtherapeutic amounts of active
ingredients increases the risk of developing microbial resistance. In this case, even genuine
drugs would be inefficient (Newton et al., 2006).
In industrialized countries, the main counterfeited therapeutic categories are “lifestyle” drugs
(weight loss drugs and potency drugs). The risks associated with these drugs are mostly due
to the presence of toxic compounds or impurities, too high amounts of active ingredients,
presence of unexpected active ingredient or new unknown designer drugs and wrong,
missing or inadequate information concerning the use of the drug (RIVM, 2005). Other
categories such as antineoplastic drugs or cardiovascular drugs have also been found to be
counterfeited (FAMHP, 2010). The fact that counterfeit drugs may be found in the legal
market constitutes a major public health risk. Indeed, besides the potential adverse effects
encountered by the users, the patients may not trust medicines anymore, even if they are
sold in pharmacy. A report of the WHO states that: “As а consequence of such damaging
professionals, the suppliers and sellers of genuine drugs, the pharmaceutical industry and national Drug Regulatory Authorities (DRAs). Incorrect labeling as to the source can also be detrimental to the reputation and financial standing of the original and/or current manufacturer whose name has been fraudulently used.” (WHO, 2009)
2. Phosphodiesterase type 5 inhibitors
In 1998, Pfizer (New York, USA) obtained the marketing authorisation for its new drug
Viagra®. This product contains sildenafil citrate as active ingredient. A few years later, Lilly
(Indianapolis, USA) launched Cialis® (containing tadalafil) in 2002 followed by Bayer
(Leverkusen, Germany) with Levitra® (containing vardenafil hydrochloride) in 2003. These
three drugs are the only authorised phosphodiesterase type 5 inhibitors (PDE5-i) for the
treatment of erectile dysfunction.
2.1. Pharmacodynamics:
The physiological mechanism responsible for erection of the penis involves the release of
nitric oxide (NO) in the corpus cavernosum during sexual stimulation. Nitric oxide then
activates the enzyme guanylate cyclase, which results in increased levels of cyclic guanosine
monophosphate (cGMP), producing smooth muscle relaxation in the corpus cavernosum and
allowing inflow of blood resulting in erection.
Phosphodiesterase type 5 (PDE5) is responsible for degradation of cGMP. When the
NO/cGMP pathway is activated during a sexual stimulation, inhibition of PDE5 by the PDE5-i
results in increased corpus cavernosum levels of cGMP. These high levels of cGMP induce a
sustained erection. Therefore sexual stimulation is required since sildenafil has no direct
relaxant effect on isolated human corpus cavernosum but potently enhances the relaxant
effect of NO on this tissue (Pfizer, 2010; Schoen et al., 2009).
Actually, eleven families of phosphodiesterase have been identified. Each of these families
exerts its role in specific localizations. Sildenafil, tadalafil and vardenafil have a relative
concentrations. These inhibitions explain some of their undesirable effects such as the visual
disturbances (inhibition of PDE6), inhibition of platelet aggregation and increased heart rate
(inhibition of PDE3) or dyspepsia (inhibition of oesophageal PDE5) (Bischoff et al., 2004).
2.2. History of PDE5-i counterfeiting
Viagra® is one of the most counterfeited drugs in industrialized countries. This may be
explained by the high prices and by the embarrassment caused by the medical consultation
for an erectile dysfunction problem. Internet is an easy, fast and anonymous way to obtain
these kinds of drugs.
Only eighteen months after the approval of the genuine Viagra®, counterfeit tablets
containing sildenafil appear. Tadalafil appeared in Viagra® counterfeits one month before the
approval of Cialis® and one year after appeared the first counterfeits of Cialis®. In the
Netherlands, in 2004, Viagra® counterfeits represented 98% of the PDE5-i illegal market and
Cialis® the last two percent. In 2006, Viagra® represented only 69% of the illegal PDE5-i
market while Cialis® (25%) and Levitra® (6%) have become more prevalent (RIVM, 2007).
Besides these three approved molecules, numerous analogues exist. Most of them have
been found as adulterants of herbal dietary supplement (RIVM, 2007). These analogues also
show a relative selectivity towards the PDE5 (see table 1). However, their inhibition potency
might be very different of the one of sildenafil and are rarely taken into account for their
dosage in illegal preparations. Furthermore, the differences in their chemical structures lead
to differences in their pharmacokinetic parameters such as their onset of action, blood levels,
half-lives, brain penetration and metabolism. All these parameters are unknown for the
analogues. This represents a huge toxicological risk linked to their intake especially when
2.3. Definitions and classification
The WHO defines a counterfeit medicine as:
“One that is deliberately and fraudulently mislabelled with respect to identity
and/or source. Counterfeiting can apply to both branded and generic products.
Counterfeit products may include products with the correct ingredients or with
the wrong ingredients, without active ingredients, with insufficient (inadequate
quantities of) active ingredient(s) or with fake packaging (WHO, 2009a)."
The substandard medicines definition is the non-deliberate and genuine side of the
counterfeit medicines definition:
“Substandard medicines (also called out of specification (OOS) products) are
genuine medicines produced by manufacturers authorized by the NMRA
(National Medical Regulatory Authority) which do not meet quality
specifications set for them by national standards (WHO, 2009a).”
Practically, illegal samples seized at the customs may be divided in two main groups
(counterfeit or imitations) according their physical appearance. These two main groups are
themselves subdivided in function of the chemical composition of the tablets. This
classification, proposed by the Dutch National Institute for Public Health and the Environment
(RIVM, 2007), is showed in table 2.
Table 1 PDE5 in-vitro pharmacological potencies of the three
approved PDE5-i and some of their analogues (data from (RIVM, 2007; Medsafe, 2009))
Compound
Potency relative to the inhibition of PDE 5 by sildenafil sildenafil 1 tadalafil 1,4 vardenafil 10,1 piperidino-sildenafil 0,62 acetildenafil 0,9 homosildenafil 1,9 hydroxyhomosildenafil 2,1 morpholinosildenafil 3,9 benzamidenafil 3,9 thiosildenafil 11,63
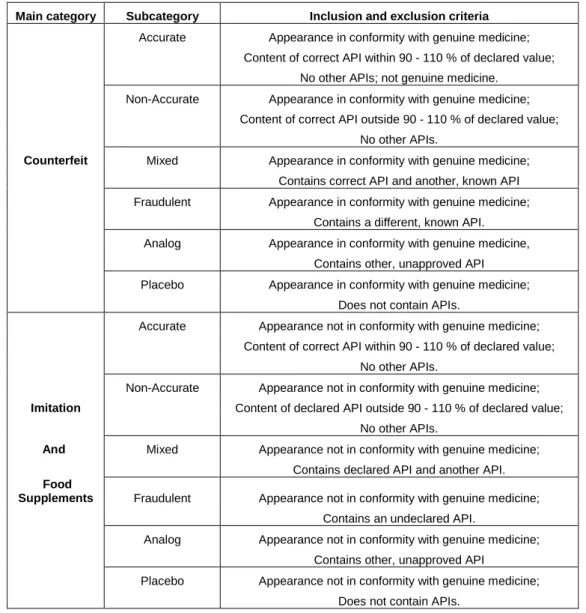
Table 2: Classification of illegal medicines proposed by the Dutch National Institute for Public Health and the
Environment (adapted from RIVM, 2007).
Main category Subcategory Inclusion and exclusion criteria
Accurate Appearance in conformity with genuine medicine; Content of correct API within 90 - 110 % of declared value;
No other APIs; not genuine medicine.
Non-Accurate Appearance in conformity with genuine medicine; Content of correct API outside 90 - 110 % of declared value;
No other APIs.
Counterfeit Mixed Appearance in conformity with genuine medicine;
Contains correct API and another, known API Fraudulent Appearance in conformity with genuine medicine;
Contains a different, known API.
Analog Appearance in conformity with genuine medicine,
Contains other, unapproved API
Placebo Appearance in conformity with genuine medicine;
Does not contain APIs.
Accurate Appearance not in conformity with genuine medicine; Content of correct API within 90 - 110 % of declared value;
No other APIs.
Non-Accurate Appearance not in conformity with genuine medicine;
Imitation Content of declared API outside 90 - 110 % of declared value;
No other APIs.
And Mixed Appearance not in conformity with genuine medicine;
Contains declared API and another API.
Food
Supplements Fraudulent Appearance not in conformity with genuine medicine;
Contains an undeclared API.
Analog Appearance not in conformity with genuine medicine;
Contains other, unapproved API
Placebo Appearance not in conformity with genuine medicine;
Does not contain APIs.
3. Detection of counterfeit PDE5-i drugs:
Several analytical techniques have already been used for the detection of counterfeit PDE5-i
most of them are fingerprinting methods. These techniques are separated in two main
groups: spectroscopic and chromatographic techniques.
3.1. spectroscopic techniques
Spectroscopic techniques study the interaction between an electromagnetic radiation and the
matter. These techniques are classified according to the region of the electromagnetic
Techniques such as Raman and Near Infrared (NIR) spectroscopy are becoming more and
more used for the detection of counterfeit medicines. This is explained by their rapidity and
easiness of use. Moreover only a little sample preparation or no preparation at all is needed
and these methods are non destructive (Rodionova et al., 2010). For the detection of
counterfeit drugs, the signals obtained with spectroscopic techniques must be pre-treated
and analysed by chemometric clustering tools such as principal component analysis (PCA) to
extract understandable and useful information from the spectra. The data analysis is the only
way to come to unambiguous and objective conclusions.
Raman spectroscopy
Raman spectroscopy studies the radiation scattered by a sample when irradiated with a
monochromatic radiation. It may be used in the elucidation of a molecular structure and is a
complementary technique to mid-IR and NIR spectroscopies. Indeed, a vibrational mode is
Raman active when there is a change in polarisability during the vibration whether it is mid-IR
and NIR active when there is a change in the molecular dipole moment during the vibration.
Thus, a vibrational mode that is highly Raman active will be weakly mid-IR active and vice
versa (Bugay et al., 2004).
de Veij et al. (2008) recorded the Raman spectra (between 700-1800 cm-1) of eighteen
suspect samples and one genuine sample. They were able to check the presence of
sildenafil and some of the excipients by visual inspection of the Raman spectra. This visual
inspection permitted the discrimination of two groups among the counterfeits but not to
distinguish them from the genuine one. Therefore, hierarchical cluster analysis (HCA) and
PCA analysis were performed. The combination of these two techniques allowed the
complete discrimination between genuine and counterfeit tablets. Raman spectroscopy has
also been used to analyse Cialis® counterfeits in association with 1H NMR and 2D Diffusion
Ordered Spectroscopy (DOSY) 1H NMR (Trefi et al., 2008). Seven counterfeits and one
corresponding to unusual excipients confirmed that the analysed samples were
counterfeited. The identity of these excipients was confirmed by the NMR spectra providing a
“signature” of the manufacturer which could be useful in sourcing studies.
Near infrared (NIR) spectroscopy
The NIR region of the electromagnetic spectrum is comprised between 12500 and 4000 cm-1
(800-2500 nm). While the mid-IR absorbances correspond mainly to fundamental vibrations,
the NIR absorbances correspond to overtones (excitation of a vibration to a double or higher
frequency) and combinations of molecular vibrations. This is why the interpretation of NIR
spectra is more difficult than mid-IR spectra.
NIR spectra are essentially used for qualitative analysis because of their fingerprint nature
and the fact that NIR spectra contain both chemical and physical informations. (Jee, 2004).
The analysis by NIR spectroscopy of 103 samples containing sildenafil citrate (in the range of
12000-3000 cm-1) allowed the detection of counterfeit samples based on the wavelength
correlation applied on spectra without pre-treatment (threshold value of 0.998). Analysts
were also able to predict the presence of sildenafil citrate in 98% of the samples
(Vredenbregt et al.,2006).
Fourier transform mid-infrared (FT-IR) spectroscopy
When irradiating a sample with a mid-IR radiation (wavenumbers of 4000-400 cm-1), a part of
the energy is absorbed by the molecules. If the energy is sufficient, the molecular bonds go
up to an excited state of energy. The amount of energy needed to excite a molecular bond
depends on the atoms involved and the strength of the bond. This is very useful to detect the
existence of functional groups in a molecule. Indeed, a specific wavelength radiation will
excite specific bonds. This opportunity to identify functional groups in a molecule is only
possible within the 4000-1800cm-1 region. Indeed, in the 1800-400 cm-1 region (fingerprint
groups. It may, on the other hand, be used as a specific fingerprint of the analysed molecule
for the identification of pure compounds or the identification of specific mix of compounds
(such as tablets).
The fingerprint region of the FT-IR spectrum has been successfully used for the detection of
counterfeit Viagra® and Cialis® tablets (Sacré et al., 2010). Transmittance spectra of 55
Viagra-like samples and 9 genuine Viagra® were measured using KBr disks. Then, Partial
Least Square (PLS) analysis has been performed on the normalized spectra. The same
procedure has been applied on 39 Cialis-like samples and 4 genuine Cialis®. A good
discrimination between genuine and illegal samples has been obtained in both cases.
Combination of infrared spectroscopic methods
Sacré et al. (2010) investigated which technique (FT-IR, NIR or Raman spectroscopy) or
combination of these techniques was the best to (1) detect counterfeit Viagra® and
counterfeit Cialis® and (2) to make clusters in illegal medicines. They found that the
combination of FT-IR (1800-400 cm-1) and NIR (700-4000 cm-1) spectroscopies provides the
best results for the analysis of illegal drugs containing sildenafil citrate while the combination
of NIR (700-4000 cm-1) and Raman (1400-1190 cm-1) spectroscopies was the best for the
analysis of medicines containing tadalafil as active pharmaceutical ingredient (API).
However, these conclusions were obtained by visual inspection of the PLS factors plots.
Therefore, Classification And Regression Trees (CART) algorithm was applied on the
infrared datasets in order to discriminate between genuine and counterfeit drug samples and
to classify counterfeit samples in different classes following the RIVM classification system
(Deconinck et al., 2012). The different models were validated for their descriptive and
predictive properties.
For the Viagra-like samples, the best results were obtained with two comparable models
based on the FT-IR and the NIR spectra respectively. Both models returned a 100% correct
classification rate (CCR) for the discrimination between genuine and counterfeit tablets
11.6% and 14.4% respectively and equal misclassification rates of 2/12 after external
validation for the classification of the samples in their respective RIVM class. The
combination of the different types of spectroscopic data did not result in better models
compared to the ones obtained with only FT-IR or NIR data.
For the Cialis-like samples, the best model has been obtained combining NIR and Raman
spectroscopy. This model gives 77,5% CCR during internal validation but 100% CCR during
external validation.
The results obtained with PLS are comparable to the results of the CART models. However,
CART also allows a clear discrimination of the counterfeit samples in different classes. This
possibility of classifying new unknown samples in their respective RIVM class allows a fast,
easy and reliable overview of their risk for public health (Sacré et al., 2010).
Raman Microspectroscopy imaging
Chemical imaging is a powerful tool that combines physico-chemical information and spatial
information of the sample. Raman microspectroscopy allows a complete mapping of a limited
area of a tablet with a limited sample preparation. The maps of 26 counterfeits and imitations
of Viagra® tablets and 8 genuine tablets of Viagra® were recorded (Sacré et al., 2011a). The
different maps were pre-processed to allow multivariate analysis.
Three different analyses were performed:
discrimination between genuine and illegal samples based on the whole Raman
spectrum (200-1800cm-1).
discrimination between genuine and illegal samples based on the presence of lactose
in the core of the tablets (830-880 cm-1). Lactose is not present in the core of genuine
Viagra® tablets but is a common and cheap filler probably used by counterfeiters.
discrimination between genuine and illegal samples based on the distribution of
sildenafil among the core of the tablets (1200-1290 cm-1). It is therefore expected that
the spatial distribution of sildenafil is less homogenous in illegal tablets than in
-150 -100 -50 0 50 100 150 200 250 300 -80 -60 -40 -20 0 20 40 60 PC2 (1,26%) PC3 (0,10%) -80 -60 -40 -20 0 20 40 60 80 100 -80 -60 -40 -20 0 20 40 60 PC2 (9,71%) PC3 (6,95%)
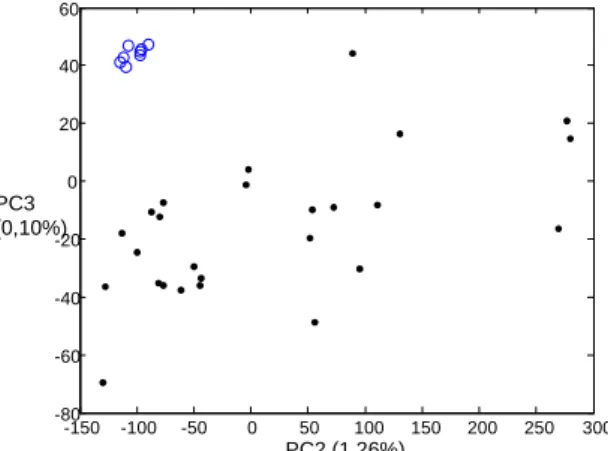
PCA analysis performed between the 200-1800cm-1 and the 830-880 cm-1 spectral range
(Figures 1 and 2) show a clear discrimination between genuine and illegal tablets. In the
830-880 cm-1 region, genuine tablets shows no peak because lactose is not present in the core of
genuine Viagra® tablets whereas illegal samples show two peaks at 851 and 876 cm-1. These
two peaks are attributed to lactose (de Veij et al., 2008; Degelder et al., 2007).
Figure 1: PCA plots of the Raman microspectroscopy data between the 200-1800cm-1 spectral range dataset. Black dots are illegal samples and blue circles are genuine Viagra® samples.
Figure 2: PCA plots of the Raman microspectroscopy data between the 830-880cm-1 spectral range dataset. This spectral region corresponds to lactose peaks. Black dots are illegal samples and blue circles are genuine Viagra® samples.
No discrimination has been obtained by the multivariate analysis of the spectral region
corresponding to the peak of sildenafil revealing that the spatial distribution of sildenafil
k-Nearest Neighbour (k-NN) algorithm has been applied on the spectral regions of 200-1800
cm-1 dataset. 100% correct classification rate has been obtained during both internal and
external validation confirming the ability of Raman microspectroscopy to detect counterfeit
Viagra samples.
X-Ray (XR) and Nuclear Magnetic Resonance (NMR)
X-Ray powder diffraction (XRD) allowed Maurin et al. (2007) to identify sildenafil and the two
most concentrated excipients (microcrystalline cellulose and anhydrous calcium hydrogen
phosphate) in suspect Viagra® samples. The discrimination between fake and original tablets
can be easily done, even visually, by comparison of diffraction patterns. The diffraction
patterns may be used as fingerprints of a given pharmaceutical (legal or not) since it is a
superposition of the patterns from all crystalline components of this product. XRD does not
require any sample preparation, is relatively fast (~45 min) and do not require advanced
statistical treatment of the data to obtain useful information.
Recently, Ortiz et al. (2012) analysed imitations and counterfeit sildenafil citrate and tadalafil
tablets by X-Ray Fluorescence spectrometry (XRF). XRF is mainly used in the
pharmaceutical industry to characterize the presence of metals. This technique may be
applied to a wide variety of samples and has many advantages among which its high
precision, good detectivity, short analysis times and its non destructive character. The
authors were able to perform semi-quantitative determination of the active ingredient
(sildenafil is detected by the presence of sulphur) and excipients such as calcium phosphate,
titanium oxide and iron oxide (Ca, P, Ti, Fe). Applying PCA and HCA on the data allowed the
distinction of seven groups of samples mainly due to differences in their Ca and Ti content.
Trefi et al. (2009) used 2D DOSY and 3D DOSY-COrrelation SpectroscopY (COSY) 1H NMR
to analyse counterfeit Viagra® samples. They were able to identify different active ingredients
and various excipients in a single experiment. The biggest advantage of this technique is the
(~2h). However, mineral components are not detected, it can only analyse compounds
soluble in the NMR solvents and it requires highly trained analysts to interpret the spectra.
Another disadvantage, common to both NMR and X-Ray diffraction is the cost of equipments
which can, therefore, not be present in the majority of control laboratories.
Visible light based techniques
The visible light range of the electromagnetic spectrum (380-730 nm) may also be used for
detecting counterfeit drugs. Rodomonte et al. (2010) investigated the possibility to use the
secondary packaging or the tablet colour as discriminating parameter. They analysed ten to
twenty batches for each dosage of genuine Viagra®, Cialis® and Levitra®. The reflectance
visible spectrum was measured on the less carved side of the tablets and on the more
distinctive colour of secondary packages (green for Cialis®, violet for Levitra® and blue for
Viagra®). The method was validated (ruggedness, repeatability and operator and
inter-day precision). The built model allowed the authors to detect counterfeit samples. This
colorimetric method may be used as very first step during the visual inspection of samples as
it is very fast, inexpensive portable and easy to use.
Photographs of Viagra® and Cialis® tablets have been used to detect counterfeit tablets
(Jung et al., 2012). Photographs of 19 genuine and 24 counterfeit tablets of Viagra® and 20
genuine and 53 counterfeit tablets of Cialis® were obtained using Video Spectral Comparator
(VSC) in order to acquire images with the same conditions (illumination, lens, …) Images
were then segmented and transformed in a statistical model based on the RGB
(Red-Green-Blue) colour component. The similarity of the statistical distributions has been measured and
compared between all samples and a threshold value has been calculated. Validation of the
model resulted in 100% classification accuracy for Viagra® samples while Cialis® samples
These two techniques based on visible light have limitations. The colour of both tablets and
secondary packaging may be altered (even for genuine drugs) by conservation conditions.
This may lead to a higher False Positive rate. The biggest problem is that if counterfeiters
produce packaging or coatings of very high quality, their products may be recognised as
genuine tablets no matter their physico-chemical quality. Therefore, the results obtained with
these techniques should imperatively be confirmed by another technique analysing the
content of the tablet.
3.2. Chromatographic techniques
Chromatography enables the separation, identification and quantification of chemical
compounds. In the field of counterfeit PDE5-i analysis, reversed phase high performance
liquid chromatography (RP-HPLC) is the most used technique to identify new analogues and
to quantify API in suspect tablets. Generally, the mobile phase is a combination of acidic
aqueous phase and acetonitrile as organic modifier while octadecylsilane (C18) is employed
as stationary phase (Singh et al., 2009). A range of detectors can be used, where mass
spectrometers and diode array detectors (DAD) are the preferred ones.
Reference draft methods have been published in Pharmeuropa for both sildenafil citrate and
tadalafil (EDQM, 2010; EDQM, 2011). The sildenafil citrate assay method is performed on a
HPLC system with an endcapped C18 stationary phase column of 150 x 3,9 mm and 5 µm
particle size. Mobile phase is constituted by a mixture of 17 volumes acetonitrile, 25 volumes
methanol and 58 volumes of a 0,7 % (V/V) solution of triethylamine adjusted at pH 3,0 (+/-
0,1) with phosphoric acid. The analysis is performed at 30°C with a flow rate of 1mL/min. An
aliquot of 20 µL of a solution containing 20 µg/mL of sildenafil base (~ 28 µg/mL sildenafil
citrate) is injected and the detection is performed at 290nm.
The tadalafil assay method is performed on a HPLC system with a sterically protected
diisopropyl-C8 stationary phase column of 250 x 4,6 mm and 5 µm particle size. Mobile
phase is constituted by a mixture of 45 volumes acetonitrile and 55 volumes of a 0,1% (V/V)
mL/min. An aliquot of 20 µL of a solution containing 100 µg/mL of tadalafil is injected and the
detection is performed at 285 nm.
Chromatographic impurity fingerprints
The treatment of chromatographic data as fingerprints is widely used in the field of
pharmacognosy for quality control of plants (Xu et al., 2006). Chromatographic fingerprints
allow a reliable evaluation of the quality and the identity of plant extracts even if neither the
identity nor the quantity of the constituents are known.
In the frame of counterfeit drug detection, chromatographic impurity fingerprints is interesting.
Indeed, a major hazard of counterfeit products is the presence of toxic impurities in unknown
amount. Therefore, as it is the case for herbal medicines, the fingerprint approach allows the
discrimination of tablets according to their chromatographic profiles without knowing a priori
neither the identity nor the quantity of the constituents. Furthermore, it provides a general
overview of the chemical composition of the drug with a possibility of identification of the
active compounds or impurities and the simultaneous quantification of the active compounds.
However, to obtain good and reliable results, a pre-processing step is crucial. This step is
mainly composed of signal enhancement, warping and mixture analysis.
A chromatogram contains three major components:
Noise (highest frequency component)
Signal (intermediate frequency component)
Background (lowest frequency component)
If needed, noise and background components are eliminated to enhance the signal. But the
biggest challenge is due to the shift in retention times that appears when performing several
chromatographic analyses. This shift is mainly due to stationary phase degradation,
techniques exist (Daszykowski et al., 2006) and each of them should be tested in order to
obtain the best results.
Sacré et al. (2011a) have analysed 73 Viagra-like samples and 44 Cialis-like samples on a
HPLC system with dual UV detector. The chromatograms were obtained on the same
HPLC-UV system with the same mobile phase (Figure 3).
a. b.
c. d.
Figure 3:
a. Impurity profile of a counterfeit tablet of Viagra® b. Impurity profile of a genuine tablet of Viagra®
c. Impurity profile of a coloured imitation tablet of Cialis® d. Impurity profile of a genuine tablet of Cialis®.
However, a shift in retention times was present and the chromatograms needed an alignment
prior any multivariate analysis. For each speciality, chromatograms were aligned in function
of the major (largest) peak. Once aligned, the chromatograms underwent logarithmic
transformation in order to reduce the influence of remaining slight differences and baseline
perturbations. After pre-treatment, PLS was applied on each dataset. The score plots
-2 -1.5 -1 -0.5 0 0.5 1 1.5 2 -2 -1.5 -1 -0.5 0 0.5 1 1.5 2 2.5 PLS2 PLS3 a. b. Figure 4:
a. PLS three dimensional plot of the log transformed impurity profiles of the Viagra® dataset. Black points are the illegal samples and blue circles are the genuine ones.
b. PLS2-PLS3 plot of the log transformed impurity profiles of the Cialis® dataset. Black points are the illegal samples and blue circles are the genuine ones.
Predictive models were built using the k-nearest neighbour algorithm (k-NN) and validated.
For the Viagra dataset, k-NN classifier allows 100% of correct classification rate in both
internal and external validation whether for the Cialis dataset, it returns 92,3% and 100%
during internal and external validation respectively.
The results showed that impurity fingerprints can be an interesting approach for the detection
of counterfeit drugs.
UHPLC-UV method
Liquid chromatography remains the gold standard technique to separate active compounds
and to quantify them in pharmaceutical preparations. If fingerprinting methods have classified
a suspicious sample as counterfeit, one needs to confirm the identity of the API and to
quantify it to know to which RIVM class (and therefore the public health risk associated) it
belongs. The same is true to classify a new sample and to detect new analogues. It is
therefore interesting to have a generic method able to detect and quantify the three
authorised PDE5-i and their analogues.
Sacré et al. (2011b) developed and validated a UHPLC method able to analyse sildenafil,
Figure 5: Chromatogram obtained by applying the gradient conditions for the UHPLC method developed by
Sacré et al. (2011b)
The UHPLC gradient was performed on an AcquityTM BEH Shield RP18 (100 mm x 2.1 mm,
1.7 µm particle size) column. Mobile phase A consisted of a 10 mM ammonium formate
buffer (pH 3.5) and mobile phase B was acetonitrile. The gradient conditions are presented in
table 3.
Table 3 : Gradient conditions (Sacré et al., 2011b)
Time
(min) Flow rate (ml/min) % A % B
0 0.55 75 25 2.5 0.55 65 35 3.5 0.55 55 45 3.8 0.55 30 70 4.5 0.55 30 70 5.0 0.55 75 25 injection volume: 1.5µl Column temperature: 40°C
The analogues of the registered API’s were chosen according to their availability and their
structural differences. The diastereoisomer of tadalafil, (-)-trans-tadalafil, was produced in the
Therefore, it was not quantified but its separation from the other peaks is important since it is
frequently present in illegal preparations as an impurity.
The method has been validated using the total error approach (Hubert et al., 2004; Hubert et
al., 2007a; Hubert et al., 2007b; Hubert et al., 2008). Spiked herbal matrix placebos were used as validation samples. This is justified by the fact that the method could be applied to a
great variety of matrixes (among them, vegetal matrixes are the most complex) and that
analogues are essentially found in vegetal alimentary complements. The validation
acceptance limits were set at +/- 5% as for pharmaceutical specialities. Once developed and
validated, the method has been compared to the reference draft method published in
Pharmeuropa (EDQM, 2011). This comparison showed that both methods gave comparable
results. The elucidation of structures and the confirmation of identity may be performed by
LC-MS systems since the mobile phase is compatible. The method has already been applied
to real samples and showed no interference with common other substances present as
yohimbine (retention time of 0.77 min) and caffeine (retention time of 0.57 min).
4. Conclusion
Counterfeit medicines become more and more sophisticated as well the packaging (i.e.
holograms etc.) as the tablet itself. Customs must therefore use more and more
sophisticated analytical techniques. Among them a difference must be made between the
expensive and complicated ones available in industrialized countries and the less efficient
and cheaper ones available in developing countries while these countries are the most
affected by the counterfeiting problem. As counterfeit erectile dysfunction drugs are mainly a
problem of industrialized countries, the developed methods use apparatus available in
control laboratories of these countries.
These results obtained with the different techniques described in this chapter indicate that
control laboratories can, in function of their equipment, implement fast, easy and reliable
detection of illegal preparations. However, the reliability of the results is dependent of the
The bigger and diversified the database is, the more reliable are the results.
Therefore, before starting to analyse new samples, laboratories must analyse a minimum
number of genuine and illegal preparations. As time goes by, each new analysed sample
could be included in the database and the models rebuilt. Each laboratory could then have a
powerful model of classification adapted to the kind of medication analysed.
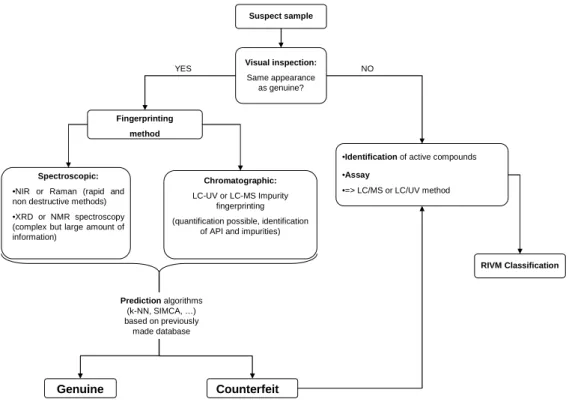
To conclude, a generic approach to detect counterfeit drugs containing PDE5-i is proposed
(see Figure 6). Visual inspection: Same appearance as genuine? Fingerprinting method Spectroscopic:
•NIR or Raman (rapid and non destructive methods) •XRD or NMR spectroscopy (complex but large amount of information)
Chromatographic:
LC-UV or LC-MS Impurity fingerprinting (quantification possible, identification
of API and impurities)
Genuine Counterfeit
•Identification of active compounds •Assay •=> LC/MS or LC/UV method YES NO Prediction algorithms (k-NN, SIMCA, …) based on previously made database Suspect sample RIVM Classification
Figure 6 : General strategy for the detection and classification (RIVM) of samples suspected to contain PDE5-i.
When a new sample arrives in the laboratory for analysis, the visual inspection is the first
analysis performed (eventually helped with colorimetry analysis). If the samples do not look
like genuine drug or if it is a dietary supplement, the only analysis to perform is a qualitative
and quantitative analysis using UHPLC-UV and/or LC-MS method. Indeed, no fingerprinting
method is necessary since it is evident that it is not a genuine drug. Using the obtained
information, it is therefore possible to classify the sample following the RIVM classification
If the new sample has the same appearance as genuine Viagra® or Cialis®, a fingerprinting
method is the first recommended analysis. Prior to any fingerprinting analysis, the control
laboratory must have developed and validated a predictive model based on the fingerprints
of a sufficient number of genuine and illegal samples. Thereafter, each new measured
sample will be added to the database and the predictive model rebuilt and revalidated. As
time goes by, the model will be more and more accurate as its database grows.
Two kind of fingerprinting approaches are available: spectroscopic and chromatographic
fingerprinting.
Spectroscopic fingerprinting is quick, non destructive and reproducible. However, not every
laboratory has a NIR or a Raman spectrometer and the apparatus are quite expensive.
On the other hand, chromatographic fingerprinting allows chemical analysis of the tablets
and the identification of potential toxic impurities while simultaneously quantifying the active
ingredient(s). Another advantage is that these fingerprints are obtained on classical
HPLC-UV systems present in every control laboratory. However, the main drawbacks are the fact
that it is a time consuming method and that a lot of parameters may change (mobile phase
composition, different analytical columns, ageing of stationary phase, different HPLC system,
etc.). All these parameters introduce changes in chromatograms, complicating data
alignment and pre treatment. In conclusion, we recommend the use of spectroscopic
fingerprinting methods. If the tablet has been declared counterfeit, it undergoes quantitative
and qualitative analysis with UHPLC-UV and/or LC-MS method and is classified following the
References:
Bischoff, E. (2004). Potency, selectivity, and consequences of nonselectivity of PDE
inhibition. International Journal of Impotence Research. 16 Suppl 1, S11-S14.
Bugay, D.E., Martoglio Smith, P.A. (2004) Raman spectroscopy in Moffat A.C., Osselton
M.D., Widdop B. (Ed.), Clarke’s analysis of drugs and poisons, Pharmaceutical Press,
London, UK.
Daszykowski, M., Walczak, B. (2006). Use and abuse of chemometrics in chromatography,
Trends in Analytical Chemistry 25, 11: 1081-1096
de Veij, M., Deneckere, A., Vandenabeele, P., de Kaste, D., Moens, L. (2008). Detection of
counterfeit Viagra with Raman spectroscopy. Journal of Pharmaceutical and
Biomedical Analysis 46, 2: 303-309
De Gelder, J., De Gussem, K., Vandenabeele, P., Moens, L. (2007). Reference database of
Raman spectra of biological molecules. Journal of Raman Spectroscopy 38, 9: 1133–
1147.
Deconinck, E., Sacré, P.-Y., Coomans, D., De Beer, J. (2012). Classification trees based on
infrared spectroscopic data to discriminate between genuine and counterfeit
medicines. Journal of Pharmaceutical and Biomedical Analysis, 57, 1: 68-75
Drake, A. (2004) Infra-red spectroscopy in Moffat A.C., Osselton M.D., Widdop B. (Ed.),
Clarke’s analysis of drugs and poisons, Pharmaceutical Press, London, UK.
EDQM (2010), Draft monography of tadalfil, Pharmeuropa 22, 3: 328–332
EDQM (2011), Draft monography of Sildenafil citrate, Pharmeuropa 23, 2: 381–383
FAMHP (2010), http://www.fagg-afmps.be/fr/news/news_pangea_III.jsp (last accessed
14-04-2011)
Hubert, P., Nguyen-Huu, J.J., Boulanger, B., Chapuzet, E., Chiap, P., Cohen, N.,
Compagnon, P.A., Dewe, W., Feinberg, M., Lallier, M., Laurentie, M., Mercier, N.,
of quantitative analytical procedures. A SFSTP proposal--Part I. Journal of
Pharmaceutical and Biomedical Analysis, 36, 3: 579-586
Hubert, P., Nguyen-Huu, J.J., Boulanger, B., Chapuzet, E., Cohen, N., Compagnon, P.A.,
Dewe, W., Feinberg, M., Laurentie, M., Mercier, N., Muzard, G., Valat, L., Rozet, E.
(2007a). Harmonization of strategies for the validation of quantitative analytical
procedures. A SFSTP proposal-part III. Journal of Pharmaceutical and Biomedical
Analysis , 45, 1: 82-96
Hubert, P., Nguyen-Huu, J.J., Boulanger, B., Chapuzet, E., Chiap, P., Cohen, N.,
Compagnon, P.A., Dewe, W., Feinberg, M., Lallier, M., Laurentie, M., Mercier, N.,
Muzard, G., Nivet, C., Valat, L., Rozet, E. (2007b). Harmonization of strategies for the
validation of quantitative analytical procedures. A SFSTP proposal-part II. Journal of
Pharmaceutical and Biomedical Analysis, 45, 1: 70-81
Hubert, P., Nguyen-Huu, J.J., Boulanger, B., Chapuzet, E., Cohen, N., Compagnon, P.A.,
Dewe, W., Feinberg, M., Laurentie, M., Mercier, N., Muzard, G., Valat, L., Rozet, E.
(2008). Harmonization of strategies for the validation of quantitative analytical
procedures: a SFSTP proposal-part IV. Examples of application. Journal of
Pharmaceutical and Biomedical Analysis, 48, 3: 760-771
Jee, R.D. (2004) Near-infrared spectroscopy. in Moffat A.C., Osselton M.D., Widdop B. (Ed.),
Clarke’s analysis of drugs and poisons, Pharmaceutical Press, London, UK.
Jung C., Ortiz R., Limberger R., Mayorga P. (2012) A new methodology for detection of
counterfeit Viagra® and Cialis® tablets by image processing and statistical analysis.
Forensic Science International, 216, 1-3: 92-96
Maurin, J.K., Pluciński, F., Mazurek, A.P., Fijałek, Z. (2007). The usefulness of simple X-ray powder diffraction analysis for counterfeit control – the Viagra example. Journal of
Medsafe, classification of analogues of sildenafil, vardenafil and tadalafil, Report for the 41st
MCC meeting, February 2009
Newton, P., Green, M., Fernández, F., Day, N., White, N. (2006). Counterfeit anti-infective
drugs, The Lancet Infectious Diseases. 6, 9: 602-613
Ortiz R., Mariotti K., Schwab N., Sabin G., Rocha W., de Castro E., Limberger R., Mayorga
P., Bueno I., Romão W. (2012). Fingerprinting of Sildenafil Citrate and Tadalafil
Tablets in Pharmaceutical Formulations via X-Ray Fluorescence Spectrometry (XRF).
Journal of Pharmaceutical and Biomedical Analysis, 58, 7-11
Pfizer, Viagra European public assessment report, Viagra -EMEA/H/C/000202 -II/0064, last
update 13-07-2010
RIVM (National Institute for Public Health and the Environment) Report 267041001/2005,
Blok-Tip, L., Vogelpoel, H., Vredenbregt, M.J., Barends, D.M., de Kaste, D.,
Counterfeit and imitations of Viagra® and Cialis® tablets: trends and risks to public
health, Bilthoven, 2005
RIVM (National Institute for Public Health and the Environment) Report 370030001/2007,
Venhuis B.J., Barends D.M., Zwaagstra M.E., de Kaste D., Recent developments in
counterfeit and imitations of Viagra®, Cialis® and Levitra® A 2005-2006 update,
Bilthoven, 2007
Rodionova O.Y., Pomerantsev A.L. (2010) NIR-based approach to counterfeit-drug
detection, Trends in Analytical Chemistry, 29, 8: 795-803.
Rodomonte A.L.., Gaudiano M.C., Antoniella E., Lucente D., Crusco V., Bartolomei M.,
Bertocchi P., Manna L., Valvo L., Alhaique F., Muleri N. (2010) Counterfeit drugs
detection by measurement of tablets and secondary packaging colour, Journal of
Pharmaceutical and Biomedical Analysis, 53, 2: 215-220
Sacré, P.-Y., Deconinck, E., De Beer, T., Courselle, P., Vancauwenberghe, R., Chiap, P.,
Crommen, J., De Beer, J. (2010). Comparison and combination of spectroscopic
Biomedical Analysis, 53, 3: 445-453
Sacré, P.-Y., Deconinck, E., Saerens, L., De Beer, T., Courselle, P., Vancauwenberghe, R.,
Chiap, P., Crommen, J., De Beer, J. (2011), Detection of counterfeit Viagra® by
Raman Microspectroscopy imaging and multivariate analysis. Journal of
Pharmaceutical and Biomedical analysis 56, 2: 454-461
Sacré, P.-Y., Deconinck, E., Daszykowski, M., Courselle, P., Vancauwenberghe, R., Chiap,
P., Crommen, J., De Beer, J. (2011a), Impurity fingerprints for the identification of
counterfeit medicines - a feasibility study, Analytica Chimica Acta, 701, 2: 224-231
Sacré, P.-Y., Deconinck, E., Chiap, P., Crommen, J., Mansion, F., Rozet, E., Courselle, P.,
De Beer, J. (2011b). Development and validation of a UHPLC-UV method for the
detection and quantification of erectile dysfunction drugs and some of their analogues
found in counterfeit medicines. Journal of Chromatography A 1218, 37: 6439-6447
Schoen, C., Bachmann, G. (2009). Sildenafil citrate for female sexual arousal disorder: a
future possibility? Nature Review Urology. 6, 4: 216-222.
Singh, S., Prasad, B., Savaliya, A.A., Shah, R.P., Gohil, V.M., Kaur, A. (2009). Strategies for
characterizing sildenafil, vardenafil, tadalafil and their analogues in herbal dietary
supplements, and detecting counterfeit products containing these drugs. Trends in
Analytical Chemistry, 28, 1: 13-28
Trefi, S., Gilard, V., Balayssac, S., Malet-Martino, M., Martino, R. (2009), The usefulness of
2D DOSY and 3D DOSY-COSY 1H NMR for mixture analysis: application to genuine
and fake formulations of sildenafil (Viagra), Magnetic Resonance in Chemistry 47, S1:
S163–S173
WHO (1999), Counterfeit drugs – guidelines for the development of measures to combat
counterfeit drugs. WHO/EDM/QSM/99.1. Geneva: WHO
WHO (2009), http://www.who.int/medicines/services/counterfeit/overview/en/index1.html (last
accessed 14-04-2011)
WHO (2009a), http://www.who.int/medicines/services/counterfeit/faqs/en/index.html (last
WHO (2010), http://www.who.int/bulletin/volumes/88/4/10-020410.pdf (last accessed
14-04-2011)
Xu, C.-J., Liang, Y.-Z., Chau, F.-T., Vander Heyden, Y. (2006). Pretreatments of
chromatographic fingerprints for quality control of herbal medicines. Journal of