HAL Id: hal-00297403
https://hal.archives-ouvertes.fr/hal-00297403
Submitted on 9 Apr 2008
HAL is a multi-disciplinary open access
archive for the deposit and dissemination of
sci-entific research documents, whether they are
pub-lished or not. The documents may come from
teaching and research institutions in France or
abroad, or from public or private research centers.
L’archive ouverte pluridisciplinaire HAL, est
destinée au dépôt et à la diffusion de documents
scientifiques de niveau recherche, publiés ou non,
émanant des établissements d’enseignement et de
recherche français ou étrangers, des laboratoires
publics ou privés.
A LEPS approach to the predictability of intense rain
storms in the Central Mediterranean basin
S. Federico, C. Bellecci, R. L. Walko
To cite this version:
S. Federico, C. Bellecci, R. L. Walko. A LEPS approach to the predictability of intense rain storms in
the Central Mediterranean basin. Advances in Geosciences, European Geosciences Union, 2008, 16,
pp.89-95. �hal-00297403�
www.adv-geosci.net/16/89/2008/
© Author(s) 2008. This work is distributed under the Creative Commons Attribution 3.0 License.
Geosciences
A LEPS approach to the predictability of intense rain storms in the
Central Mediterranean basin
S. Federico1,2, C. Bellecci2,3, and R. L. Walko4
1CNR-ISAC, Strada prov.le Lecce-Monteroni km 1.2, 73100, Lecce, Italy 2CRATI Scrl, c/o Universit`a della Calabria, Rende (CS), Italy
3Facolt`a di Ingegneria-Universit`a di “Tor Vergata”, via del Politecnico 1, Rome , Italy 4Pratt School, Duke University, Durham, NC, USA
Received: 12 August 2007 – Revised: 3 December 2007 – Accepted: 28 January 2007 – Published: 9 April 2008
Abstract. This study investigates a method for best mem-ber selection of a Limited area model Ensemble Prediction System (LEPS) with the goal to increase quantitative precip-itation forecast. A case study that occurred between 22-24 May 2002 over Calabria, southern Italy, is discussed.
Mediterranean storms often develop under upper level dis-turbances which are usually associated with high values of potential vorticity. Anomalously high values of potential vor-ticity can be identified by the METEOSAT water vapor chan-nel centered around 6.3 µm because they are associated with dark band on the METEOSAT image. This signature offers a chance to identify the upper level disturbance that can be exploited in data void countries as Calabria.
The working hypothesis is that the uncertainty in the rep-resentation of the upper-level disturbance has a major impact on the precipitation forecast. This issue is utilized in an en-semble forecast where member forecasts are compatible with the analysis and forecast errors. These members are grouped in five clusters by a hierarchical clustering technique which utilizes the height of the dynamical tropopause to compute distances between members. Therefore the members of a cluster have a similar representation of the upper level distur-bance. For each cluster a representative member is selected and its pseudo water vapor image is compared with the cor-responding METEOSAT 7 water vapor image at a specific time, antecedent to the rain occurrence over Calabria. The subjective evaluation of the comparison allows to gain phys-ical insight in the storm evolution and to select representative members which are more in agreement with the METEOSAT image.
Correspondence to: S. Federico
Results, even if for a case study, show the feasibility of the methodology that, if confirmed by further investiga-tions, could be valuable in data void countries as the central Mediterranean basin.
1 Introduction
The Mediterranean region is often characterized by torren-tial rainfall and flash floods at different spatorren-tial and temporal scales (Siccardi, 1996). Several cases have been studied, dis-cussed and reported in different countries around the basin (Homar et al., 2001; Fehlman et al., 2000; Buzzi and Fos-chini, 2000; Alpert et al., 2002).
Even if there are atmospheric forcings spanning different spatial and temporal scales that determine different types of intense rainfall in the Mediterranean region, extra-tropical intense cyclones often develop under upper-tropospheric jet streams. These are frequently characterized by anomalously high values of Potential Vorticity (PV). PV is conserved along the flow on a isentropic surface under adiabatic and frictionless conditions (Hoskins et al., 1985). Because of its conservative property, PV is used to trace the areas with spe-cific characteristic of air masses and it is applied in the anal-ysis of atmospheric processes. PV positive anomalies associ-ated with jets (PV streamers) influence the timing, amplitude, and location of intense surface cyclones and heavy precipita-tion events by the upper-tropospheric forcing (Fehlman and Davies, 1999; Fehlman et al., 2000; Krichack et al., 2007). Therefore, accurate specification of the troposphere PV dis-tribution might be a necessary prerequisite for the successful prediction of hazardous weather events (Romero et al., 2005; Romero et al., 2006).
90 S. Federico et al.: A LEPS approach to the predictability of intense rain storms
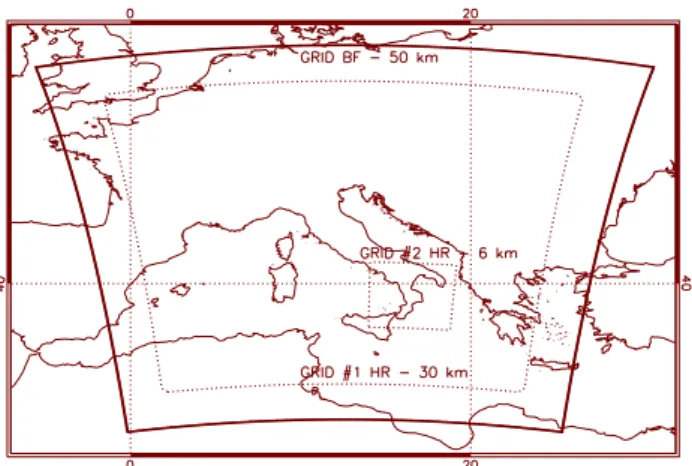
Fig. 1. Configuration of the different domains. The outermost grid
is used for RAMS-BF approach with 50 km horizontal resolution. The other two grids are used for the high resolution forecast of rep-resentative members. Their horizontal grid spacing is 30 km and 6 km.
The aim of this study is to suggest a new subjective ap-proach allowing correcting an already existing forecast; in-directly, it evaluates the sensitivity of the prediction of rain-storms over Calabria to the accuracy of model description of the upper-troposphere effects.
2 Methodology
The strategy adopted to study the sensitivity of the storm to the meteorological large scale patterns and to examine its predictability consists of generating different “scenarios” with respect to a reference run. In this approach, we assume that the model is “perfect” and that the major error sources are associated with deficiencies in the knowledge of initial conditions ingested in the mesoscale model, a real problem in the data void Mediterranean region. We utilize a LEPS approach which is detailed below.
1. Fifty one runs of the limited area model RAMS (Cot-ton et al., 2003) at 50 km horizontal resolution are performed driven by the 51 global predictions of the European Centre for Medium-range Weather Forecast-Ensemble Prediction System (ECMWF-EPS). These runs form the RAMS Brute Force (RAMS-BF) and are utilized to compute derived variables as PV or the height of the dynamical tropopause because they have a greater horizontal and vertical resolution compared to ECMWF-EPS.
2. RAMS-BF simulations are gathered by a hierarchical cluster analysis in five clusters. For each cluster a rep-resentative member is extracted by minimizing the ratio between the distance from the members belonging to its
own cluster and the members belonging to other clus-ters. The five sets of ECMWF-EPS initial and boundary conditions which drive representative member forecasts are the five “scenarios”.
The discriminating variable utilized in the clustering tech-nique is the height of the dynamical tropopause. For the extra-tropics, PV values above 3 PV units (1 PV unit is 10−6K kg−1m2s−1) are inferred to represent stratospheric
air masses because of the high values of static stability in this portion of the atmosphere. PV values of 1.5–3 PV units rep-resent air that originated near the tropopause. PV values less than 1.5 PV units represent tropospheric air masses. Follow-ing this classification, the height of the 1.5 PV units surface is the height of the dynamical tropopause. More details on RAMS LEPS can be found in Federico et al. (2006).
1. For each of the five “scenarios”, a high resolution RAMS forecast, with 6 km maximum horizontal reso-lution, is performed to resolve local scales which have a high impact on local weather and are not represented properly in the RAMS-BF. The five high resolution forecasts of the representative members and their asso-ciated weights accounting for the corresponding cluster population constitute the RAMS LEPS.
Figure 1 shows the horizontal domains for RAMS-BF and for representative member forecasts. RAMS-BF utilizes one grid with 50 km horizontal resolution whilst the representa-tive member forecasts have two two-way nested grids with 30 km and 6 km horizontal resolutions. Both configurations use thirty vertical levels, up to 16 000 m in the terrain follow-ing coordinate system. Levels are not equally spaced: within the planetary boundary layer the spacing is between 50 m and 200 m, while in the middle and upper troposphere it gradu-ally increases from 700 to 1000 m.
RAMS allows the selection of several options for the phys-ical parameterization schemes. The following is a brief de-scription of model set up for all grids and for all simulations performed. For details on these parameterizations the reader should refer to Cotton et al. (Cotton et al., 2003). The pa-rameterization of the surface-atmosphere diabatic processes is described in Walko et al. (2000). Non-convective precip-itation is computed from explicit prognostic equations for seven hydrometeors: rain, pristine ice, cloud particles, ice, snow, hail and aggregates. A generalized gamma function is used to describe hydrometeors size distribution. Convec-tive precipitation is parameterized following Molinari and Corsetti (1985) who proposed a simplified form of the Kuo scheme that accounts for updrafts and downdrafts.
All simulations start at 12:00 UTC on 22 May and last 84 h.
Table 1. Results of the application of the hierarchical clustering technique to the case study. Columns are cluster’s number. The numbers in
the cells are the cluster population and, in parenthesis, the cluster representative member.
CASE Cluster 1 Cluster 2 Cluster 2 Cluster 4 Cluster 5
May 2002 22 (3) 18 (43) 8 (38) 1 (8) 2 (50)
3 Results
Results are presented after a short overview of the synoptic situation based on the ECMWF analysis available on a 0.5◦
horizontal grid at standard pressure levels every 6 h. 3.1 The May 2002 case study
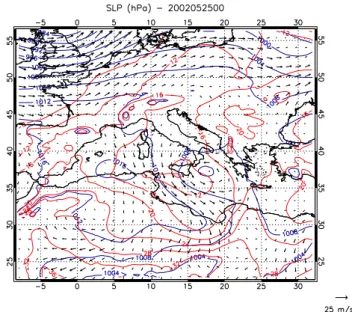
At 00:00 UTC 24 May (not shown), an intense north-south PV streamer, associated with a mid-tropospheric deep trough, extends from the North Sea to the Mediterranean, crossing Europe roughly along the German-French border. A cutoff low has already developed as a consequence of the interaction between the deep trough and western Alps, and, therefore, this storm can be classified as a baroclinic cyclone formed to the lee of the Alps (Buzzi and Tibaldi, 1978). During the following 24 h, the northern half of the PV streamer evolved quickly to the northeast, whereas, the southern one remained more to the west, crossing the Tyrrhe-nian Sea from northwest to southeast. The situation 24 h later, i.e. on 00:00 UTC 25 May, is reported in Fig. 2a which shows the 500 hPa geopotential height, the 500 hPa tempera-ture and the PV at 250 hPa. At this time, the cutoff low has already crossed Calabria and Sicily. In the following 12 h, the cold cutoff remained almost stationary over the Ionian Sea, then it moved to the southeast.
Figure 2b shows the surface analysis at 00:00 UTC 25 May. As the upper level cold low crossed Sicily and Cal-abria, the surface low deepened, aided by the interaction with local orographic barriers and a mesolow formed over the Io-nian Sea. The surface flow toward Calabrian IoIo-nian coast is mainly from east and remained stationary for 12 h, as already noticed for the upper level flow.
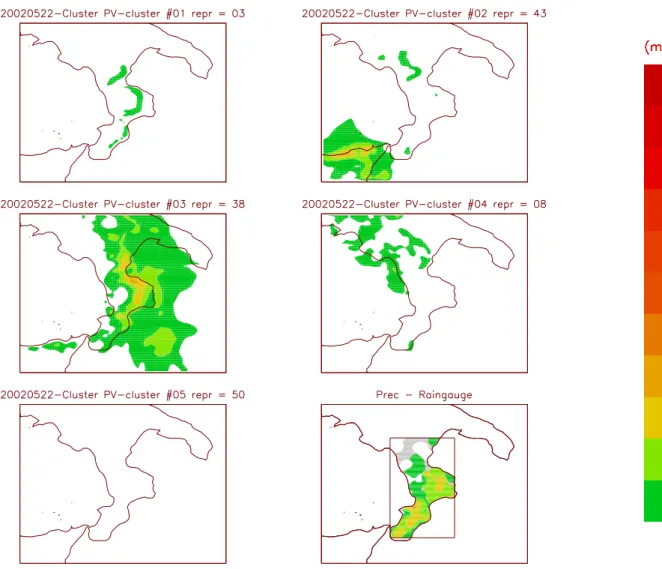
The hierarchical cluster analysis produces the five clusters reported in Table 1. The unperturbed forecast belongs to the first cluster. In the following discussion, we prefer to con-sider the ECMWF-EPS numeration for representative mem-bers because it is more general than our cluster numeration (1–5), whose members depend on the clustering technique.
Figure 3 shows the total precipitation accumulated for the high resolution forecasts of the representative members, to-gether with the raingauge measurements (lower right panel). Measurements show two main regions with increased pre-cipitation. The first one is located on the east side of the country; the second one affected the south of the peninsula. Throughout the event the main flow was from east,
north-Fig. 2a. Potential vorticity (PVU, shaded contours) at 250 hPa,
geopotential height (gpm, solid blue line) and temperature (◦C, solid red line) at 500 hPa on 00:00 UTC 25 May 2002.
Fig. 2b. Sea level pressure (hPa, solid blue line), 925 hPa wind
vector and temperature (◦C, solid red line) on 00:00 UTC 25 May 2002.
east or south-east and both cells show an orographic com-ponent because the most abundant precipitation is recorded
92 S. Federico et al.: A LEPS approach to the predictability of intense rain storms
Fig. 3. Total precipitation accumulated for the representative member forecasts and for raingauges (lower right panel) from 18:00 UTC
24 May to 00:00 UTC 26 May 2002. The representative member number is reported on the upper right corner of each panel. Raingauges data have been objectively analyzed by a Cressman scheme with 0.15◦search radius. This analysis is performed into the inner box of the lower right panel and grey shades are areas with missing data.
upstream and over the main peaks. Filled contours are the same for all plots. With the exception of the representa-tive member 38, all representarepresenta-tive members underestimate rainfall. This result suggests that RAMS LEPS performed not very well for this case study because rainfall amount is strongly underestimated by the larger portion of the repre-sentative members.
3.1.1 Comparison between RAMS water vapor pseudo im-ages and METEOSAT 7 scene
The potential vorticity perspective adopted here allows a unique chance to discuss the different precipitation simu-lated by representative members (Fig. 3) because these pat-terns, in terms of amplitude, timing and distribution, are re-flected in the structure of the upper level PV filament. In
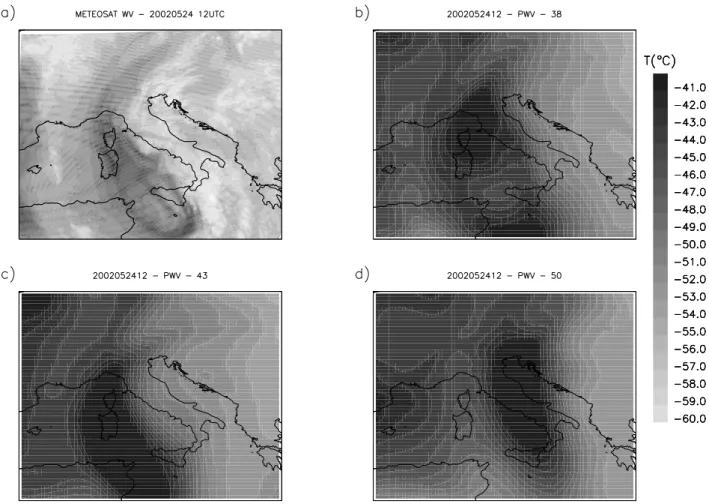
the following discussion, for brevity, we report results for representative members 38, 43 and 50. Figure 4, panel a, shows the METEOSAT 7 water vapor (WV) image for the 12:00 UTC 24 May. Water vapor images are derived from ra-diance measurements in the spectral region centered around 6.3µm and provide a measure of the integrated water vapor content above 500hPa with a horizontal resolution of about 8 km×5 km (Fisher et al., 1981). Dark band on these images in midlatitudes are an indicator of significant in situ descent (Menzel et al., 1998) and concomitant high PV values. In-deed there is a strong resemblance between these images and the PV distribution on troposphere transcending isentropic surfaces (Appenzeller and Davies, 1992; Appenzeller et al., 1996). Moreover in cloud-free region there is a reasonable quantitative relationship between the temperatures on the wa-ter vapor isoswa-teric surface of 75 mg/kg and the corresponding
Fig. 4. METEOSAT 7 WV image and RAMS pseudo water vapor images for 1200 UTC 24 May 2002. Gray shaded colour bar is valid
for RAMS pseudo water vapor images. Panel (a): METEOSAT scene. Copyright 2007 © EUMETSAT. All rights reserved. Panel (b): Representative member 38 pseudo water vapor image. The image has been derived from the high resolution forecast. The plotted field is the temperature (◦C) of the 75 mg/kg isosteric surface. Panel (c): As in panel b for the representative member 43. Panel (d): As in panel b for the representative member 50.
water vapor image (Ramond et al., 1981, Appenzeller et al., 1996). An inspection of the METEOSAT 7 visible and in-frared images (not shown) at 12:00 UTC 24 May reveals that almost all the Tyrrhenian Sea bounded by the Italian penin-sula and Sardinia and Corsica islands, was a cloud free re-gion.
Figure 4, panels b, c and d, shows the pseudo water va-por images for the representative members 38, 43 and 50 re-spectively. Panel b, shows a rather complex pattern, as in the METEOSAT image: the fine structure and the position of the dark band are well represented by the representative member 38. In particular, the more advanced portion of the PV anomaly and its structure over the Tyrrhenian Sea is well represented but, at the same time, the structure of the north-ernmost part of the PV filament is shifted to the north of the METEOSAT image and it is wider than the real PV filament. The comparison between representative member 43 pseudo water vapor image (Fig. 4 panel c) and the
ME-TEOSAT image reveals that the forecast is partially satisfac-tory. The westernmost part of the PV anomaly is represented by the simulation but the fine structure of the METEOSAT scene between Sicily and Tunisia is missed. Moreover the westernmost part of the PV streamer is misplaced to the west of the corresponding METEOSAT scene and shows that the simulated storm movement from west to east is slower than the real one.
Comparison between representative member 50 pseudo water vapor image (Fig. 4 panel d) and the METEOSAT image shows that the PV filament structure is completely missed by this forecast. Indeed the dark band in repre-sentative member 50 is about 500 km to the east of the METEOSAT WV image and we conclude that this forecast should be discarded.
The comparison between pseudo water vapor images of representative members 03 and 08 and the corresponding METEOSAT image (not reported) shows that pseudo images
94 S. Federico et al.: A LEPS approach to the predictability of intense rain storms
Fig. 5a. RAMS ensemble mean precipitation.
miss several features of the METEOSAT scene and their forecast should not be considered reliable as representative member 38.
From this analysis, we conclude that the PV perspective adopted in this work would have clearly improved the en-semble forecast through the qualitative comparison presented above. Scenarios of representative members 03, 08 and 50 would have been discarded, because their pseudo water va-por maps do not resemble the corresponding METEOSAT image. Comparatively, the representative member 43 and, especially, representative member 38 would have been con-sidered more likely.
3.2 General comments
From previous section, it follows that the use of METEOSAT WV images can be very useful in a LEPS environment.
First of all, it should be considered that the ensemble did not perform very well for the case study. The ensemble mean precipitation, Fig. 5a, is less than 40mm over Calabria, if we exclude the northernmost peak of the peninsula where precipitation is less than 50 mm. The ensemble probability to have more than 30 mm rainfall (not shown) is less than 20% everywhere over the country and the ensemble did not suggest a probable moderate-intense event.
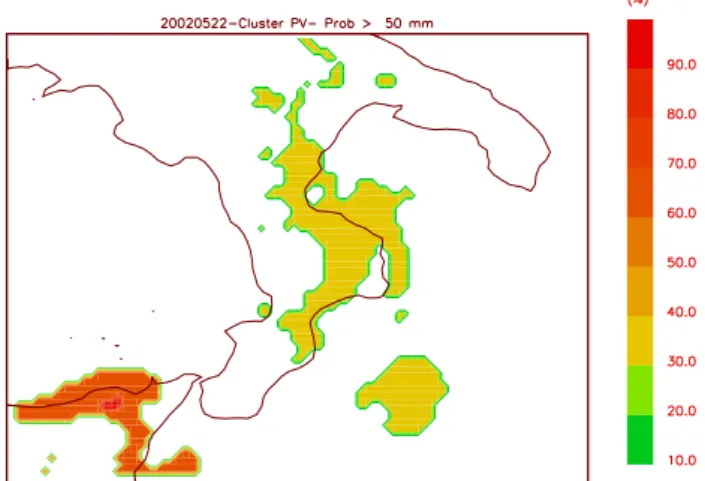
The comparison between the METEOSAT WV image and RAMS LEPS pseudo water vapor maps shows that some sce-narios and their associated forecasts should be discarded. In particular, discarding the scenarios associated with represen-tative members 03, 08 and 50, the quantirepresen-tative precipitation forecast would have been improved. As an example, Fig. 5b shows the probability to have more than 50 mm rainfall when all the ensemble clusters are considered, whilst Fig. 5c shows the same map when representative members 03, 50 and 08 are discarded. In Fig. 5c the weights of representative mem-bers 38 and 43 are renormalized according to their cluster
Fig. 5b. Probability to have more than 50 mm rainfall for the May 2002 case study considering all clusters of RAMS LEPS.
Fig. 5c. As in Fig. 5b but removing clusters whose representative
members are 03, 08 and 50.
population. Over northeast and central Calabria the probabil-ity increases from 16% to 37%, thus improving the forecast. These results, if confirmed by further investigation, can have some impact on operational weather forecast in data void countries, because the methodology can be imple-mented operationally. RAMS LEPS probability maps and ensemble weighted mean could be tuned dynamically by the forecaster to take into account his/her subjective analysis in the forecast issue. In particular, an interactive tool could be realized by which the forecaster chooses the clusters utilized for weighted mean ensemble maps and probability maps.
4 Conclusions
This study reports on the RAMS model ensemble precipi-tation forecast for a moderate-intense rainstorm occurred in southern Italy. It adopts a potential vorticity perspective.
The main goal is to study the possibility to improve the ensemble forecast by a subjective analysis and comparison between the METEOSAT water vapor images and the model pseudo water vapor images. In order to achieve this goal, different pseudo water vapor images are generated from five scenarios of the ensemble. Images are subjectively com-pared with the corresponding METEOSAT scene. The re-sults show that the forecast is improved by the methodology and this conclusion is particularly valuable considering that the Mediterranean basin is a data void rergion.
The study indirectly verifies the sensitivity of the precip-itation field to the different pattern of potential vorticity for timing, location, and abundance.
Even if the results refer to a single case study, they are en-couraging and claims for further investigation. We are cur-rently acquiring a larger dataset of moderate-intense rainfall events over Calabria to assess statistically the following two issues: a) how many storms show a clear signature of a PV streamer in the METEOSAT WV images, and b) how many forecasts can be subjectively improved by the comparison presented in this work.
Acknowledgements. This work was partially funded by “Ministero
dell’Universit`a e della Ricerca Scientifica” in the framework of the projects “SAI - Messa a punto di un Sistema per l’Allerta precoce di Incendi e per la minimizzazione dei falsi allarmi” and “TAI – Tecniche Agronomiche Innovative per la valorizzazione delle produzioni ed il miglioramento della qualit`a ambientale”. We are grateful to the Italian Air Force and ECMWF for MARS database account and to Christophe Accadia of EUMETSAT for METEOSAT 7 images.
Edited by: S. C. Michaelides
Reviewed by: two anonymous referees
References
Alpert P., Ben-Gai, T., Baharad, A., and Coauthors: The paradox-ial increase of Mediterranean extreme daily rainfall in spite of decrease in total values, Geophys. Res. Lett., 29, 1536, 2002. Appenzeller, C. and Davies, H. C.: Structure of stratospheric
intru-sions into the troposphere, Nature, 358, 570–572, 1992. Appenzeller, A, Davies, C. H., and Norton, W. A.: Fragmentation of
stratospheric intrusions, J. Geophys. Res., 101(D), 1435–1456, 1996.
Buzzi, A. and Tibaldi, S.: Cyclogenesis on the lee of the Alps: A case study, Quart. J. Roy. Meteor. Soc., 104, 271–287, 1978. Buzzi, A. and Foschini, L.: Mesoscale meteorological features
as-sociated with heavy precipitation in the southern Alpine region, Meteor. Atmos. Phys, 72, 131–146, 2000.
Cotton, W. R., Pielke, R. A. S., Walko, R. L., Liston, G. E., Tremback, C. J., Jiang, H., McAnelly, R. L., Harrington, J. Y., Nicholls, M. E., Carrio, G. G., and McFadden, J. P. : RAMS 2001: Current satus and future directions, Meteor. Atmos., 82, 5–29, 2003.
Federico, S., Avolio, E., Bellecci, C., Colacino, M., and Walko, R. L.: Application of the LEPS technique for Quantitative Precipi-tation Forecasting (QPF) in southern Italy: a preliminary study, Nonlin. Processes Geosci, 13 , 53–66, 2006.
Fehlmann, R. and Davies, H. C.: Role of salient potential vorticity elements in an event of frontal-wave cyclogenesis, Quart. J. Roy. Meteor. Soc., 125, 1801–1824, 1999.
Fehlmann, R., Quadri, C., and Davies, H. C.: An Alpine rainstorm: Sensitivity to the mesoscale upper level structure, Wea. Forecast-ing, 15, 4–28, 2000.
Fisher, H., Eigenwillig, N., and Muller,H.: Information content of METEOSAT and Nimbus/THIR water vapor channel data: Al-titude association of observed phenomena, J. Appl. Meteor., 20, 1344–1352, 1981.
Hoskins, B. J., McIntyre, M. E., and Robertson, A. W.: On the use and significance of isentropic potential vorticity maps, Quart. J. Roy. Meteor. Soc., 111, 877–946, 1985.
Homar, V., Ramis, C., and Alonso, S.: A deep cyclone of African origin over the Western Mediterranean: diagnosis and numerical simulation, Ann. Geophys., 20, 93–106, 2001,
http://www.ann-geophys.net/20/93/2001/.
Krichak, S. O., Alpert, P., and Dayan, M.: A southeastern Mediter-ranean PV streamer and its role in December 2001 case with torrential rains in Israel, Nat. Hazards Earth Syst. Sci., 7, 1–12, 2007,
http://www.nat-hazards-earth-syst-sci.net/7/1/2007/.
Menzel, W. P., Holt, F. C., Schmit, T. J., Aune, R. M., Schreiner, A. J., Wade, G. S., and Gray, D. G.: Application of GOES-8/9 soundings to weather forecasting and nowcasting, B. Am. Me-teor. Soc., 79, 2059–2077, 1998.
Molinari, J. and Corsetti, T.: Incorporation of cloud-scale and mesoscale down-drafts into a cumulus parametrization: results of one and three-dimensional integrations, Mon. Weather Rev., 113, 485–501, 1985.
Ramond, D., Corbin, H., Desbois, M., Szejwach, G., and Wald-teufel, P.: The dynamics of polar jet streams as depicted by the METEOSAT WV channel radiance field, Mon. Weather Rev., 109, 2164–2176, 1981.
Romero, R., Mart´ın, A. , Homar, V., Alonso, S., and Ramis, C.: Pre-dictability of prototype flash flood events in the Western Mediter-ranean under uncertainties of the precursor upper-level distur-bance: The HYDROPTIMET case study, Nat. Hazards Earth Syst. Sci., 5, 505–525, 2005,
http://www.nat-hazards-earth-syst-sci.net/5/505/2005/.
Romero, R., Mart´ın, A., Homar, V., Alonso, S., and Ramis, C.: Pre-dictability of prototype flash flood events in the Western Mediter-ranean under uncertainties of the precursor upper-level distur-bance, Adv. Geosci., 55–63, 2006.
Siccardi, F.: Rainstorm hazards and related disasters in the western Mediterranean region, Remote Sens. Rev., 14, 5–21, 1996. Walko, R. L., Band, L. E., Baron, J., Kittel, T. G., Lammers, R., Lee,
T. J., Ojima, D., Pielke, R.A. Sr., Taylor, C., Tague, C., Trem-back, C. J., and Vidale, P. L.: Coupled Atmosphere-Biosphere-Hydrology Models for environmental prediction, J. Appl. Met., 39, 931–944, 2000.