Academic Performance of College Students With
and Without Disabilities: An Archival Study
Shirley Jorgensen
Catherine S. Fichten
Alice Havel
Daniel Lamb
Crystal James
Maria Barile
Dawson College The academic outcomes of students with (n = 653) and without disabilities (n = 41,357) were compared over a 12-year period at a large Quebec college. Results showed that students with and without disabilities, including learning disabilities, had virtually iden-tical grades and graduation outcomes. However, students with disabilities undertook lighter course loads and took approximately one semester longer to graduate. The find-ings suggest that counsellors need to urge students with disabilities to consider higher education when developing their career plans. In planning the transition, students need to be made aware of disability-related services at post-secondary institutions.
Les résultats scolaires d’étudiants d’un grand collège québécois, avec (n = 653) et sans (n = 41 357) déficience, ont été comparés en utilisant des données s’étendant sur 12 années. Les étudiants ayant des déficiences, y compris des troubles d’apprentissage, et les étudiants sans déficience ont obtenu des résultats et des taux de diplômation sensi-blement identiques. Les étudiants avec déficience avaient un horaire de cours moins chargé et prenaient environ un semestre de plus pour obtenir leur diplôme. Les résul-tats donnent à penser que les conseillers pédagogiques devraient encourager les étu-diants ayant une déficience à incorporer les études supérieures à leurs plans de carrière. Ils devraient être renseignés sur les services qui leur sont offerts dans les établissements post-secondaires au moment de la planification de leur transition.
Higher education has presented many minority and disadvantaged groups with a means of entering the Canadian mainstream. One group of Canadians who can benefit from the new emphasis on information and knowledge is the ap-proximately 10% of working-age Canadians (between the ages of 15 and 64) who have some level of disability (Statistics Canada, 2002).
In 2001, a substantially smaller proportion of working-age Canadians with disabilities (38%) than without disabilities (48%) had some post-secondary edu-cation (Statistics Canada, 2003). Although the percentages of students with and without disabilities who obtained junior/community college qualifications were similar (16% versus 17%), only 11% of working-age Canadians with disabilities
graduated from university compared to 20% of those without disabilities. As post-secondary education is generally seen as a key vehicle for creating a labour force ready to meet the challenges of the new knowledge-based economy, it is important to examine how students with disabilities fare academically once they enter higher education.
Grayson and Grayson (2003), in a recent review of the literature on student persistence in post-secondary education, found that the main research paradigm in much of the current research on student retention is based on Tinto’s “student integration” model (Tinto, 1993). In this model, pre-entry characteristics, ini-tial goals and commitments, academic and social integration, and emerging goals and commitments resulting from experience within the institution are seen as key factors that can help identify students at risk of abandoning their studies. Although theoretical approaches are proving useful in sensitizing researchers to relevant issues, the ability to successfully isolate specific factors that can be tar-geted for intervention has been questioned (Grayson, 1995; Grayson & Grayson; Nelson et al., 1993). Concerns relating to the Tinto model, and models influ-enced by it, have been summarized by Grayson and Grayson as (a) variable attri-tion explained by these models (ranging from 11% to 46%), (b) factors that are important varying from institution to institution, (c) failure to delineate the dif-ferent categories of attrition (e.g., voluntary versus non-voluntary drop-out), (d) low sample sizes, and (e) failure to consider the student’s point of view. Although Canadian studies based on theoretical paradigms do exist (e.g., Darroch, Northrup, & Ondrack, 1987; Grayson, 1994, 1997, 1998), research has been limited, especially studies related to students with disabilities. In one study us-ing the Tinto model, Duquette (2000) examined the perceived experiences of a limited sample of 36 students with disabilities at a large Ontario university. How-ever, this study only assessed the degree of social and academic integration re-ported by students with disabilities. It did not assess how these variables were related to the relative attrition rates of students, or compare the outcomes to students without disabilities.
A large number of atheoretical studies have been conducted by universities and colleges. These studies are concerned with determining local rates of attri-tion, the relative academic performance of different groups of students, and the variables that influence successful academic outcomes (e.g., Astin, 1984; Dolan, 1986; Montmarquette, Mahseredjian, & Houle, 2001; Ungar, 1980). In addi-tion, the Consortium for Student Retention Data Exchange (CSRDE, 2001) collects annual retention information from a number of universities and colleges in the US and Canada. Results are reported by gender, race, institution size, and part- and full-time status. The collection does not report the retention rates for students with disabilities.
Research and data collection with respect to the academic success of students with disabilities is sparse. Canadian studies are largely atheoretical and tend to examine single variables and employ cross-sectional rather than longitudinal de-signs (e.g., Moisey, 2004; Outcomes Group, 1998; Taillon & Paju, 1999). For
example, the Outcomes Group examined the grade point averages (GPAs) of former students with and without disabilities from 21 British Columbia public junior/community colleges and institutes. Students were surveyed nine months after they had completed all, or a significant part, of their program. The results showed that the GPAs of students with and without disabilities were virtually identical, regardless of program of study. The study also found that women with and without disabilities had higher GPAs than men, and this was true regardless of program. However, the sample was heterogeneous, except for gender and pro-gram type, and did not take into consideration other background variables. Moisey examined the course completion rates of students with disabilities in distance education at a Canadian university, and found that their completion rates were lower than the general university population (45.9% versus 52.5%). Taillon and Paju examined the labour market outcomes of 300,000 Canadians who gradu-ated in 1995. The study reported that 6% of graduates in vocational and career programs and 4% of university graduates in Bachelor’s, Master’s, and Doctorate programs were persons with a disability. These percentages are lower than the 7% of persons with disabilities who reportedly participate in post-secondary edu-cation in Canada (Canadian Association of Disability Service Providers in Post-Secondary Education [CADSPPE], 1999), suggesting a lower graduation rate. None of these studies examined graduation or retention rates based on a longi-tudinal tracking of students.
American studies have provided conflicting results with respect to the aca-demic outcomes of students with disabilities. For example, a study from Gavilan College (2002) showed that students with “learning disabilities” and “other dis-abilities” performed as well as students without disabilities in math and English courses, and that students with learning disabilities were more likely to obtain an award. Horn and Berktold (1999), on the other hand, reported that students with disabilities who enrolled in post-secondary education for the first time in 1989–90 were less likely than students without disabilities to have stayed en-rolled or earn a post-secondary degree or credential within five years. Vogel and Adelman (1992) found that graduation rates for college students with a learning disability were not significantly different from those of a group without disabili-ties, although they undertook a lighter course load and took longer to graduate. This contradicts the findings of an earlier study (Adelman, 1990), which found that the time taken to graduate for students with a learning disability did not differ from those without a disability.
In Britain, Richardson and his colleagues (e.g., Richardson, 2001; Richardson & Roy, 2002) carried out a series of large-scale studies on the academic out-comes of university students with and without disabilities. Richardson and Roy compared a large group of students with visual impairments to students with no reported disabilities. In a cross-sectional analysis, the relative proportion of stu-dents with visual impairment in a group of stustu-dents who had completed their studies (completed group, n = 363,631) was compared to a group who were enrolled and were still progressing toward their qualifications (continuing group,
n = 1,183,285). The representation of students with a visual impairment was
lower in the “completed group” (.09%) than in the continuing group (.13%). This difference, which remained significant even when background variables (age, gender, ethnicity, entrance qualifications, and program-related variables) were taken into consideration, suggested that students with a visual impairment were less likely to complete their programs of study. However, in another study (Richardson), when differences in similar background variables were taken into consideration, it was found that hearing loss had no effect on the academic mea-sures examined (number of courses passed, credit points gained, and final workload).
Using both theoretical and descriptive approaches and a range of measures of academic success, researchers have been trying to identify factors that place stu-dents at risk of leaving post-secondary study without obtaining an academic quali-fication. Clearly, a complex interplay of factors influences the likelihood of students leaving. Although it can easily be assumed by counsellors, academic advisors, and faculty, both at the high school and post-secondary levels, that stu-dents with disabilities are more likely to be at risk of academic failure, the stud-ies reviewed here suggest that this may not necessarily be the case.
Present Investigation
Using a large eastern Canadian college as a case study, the aim was to deter-mine whether students with disabilities were at risk, by comparing the academic performance and graduation rates of students with and without disabilities. The effects of gender and high school grades were examined to determine the extent to which these background characteristics, rather than the presence of a disabil-ity, per se, could account for any differences between the groups. These two vari-ables were chosen as they are important determinants of academic success. A substantial body of data exists showing that men tend to underperform in com-parison to women in terms of degree attainment in a variety of countries (Gouvernement du Québec, 2001). For example, the difference in graduation rates between men and women at the college in this study has averaged about 13% over the last 10 years (Jorgensen, 2004). The correlation between high school grades and academic success is well documented (Garton, Dyer, & King, 2000; Mulvenon, Stegman, Thorn, & Thomas, 1999; Peters, 2000).
Overview
This archival study examined the academic records of 653 students with dis-abilities and 41,350 students without disdis-abilities at a large urban junior/com-munity college (Collège d’enseignement général et professionnel [Cegep]) in Montreal. The college enrolls approximately 7,400 full-time day students in di-ploma programs. Following high school completion in grade 11, students who
plan on pursuing a university education must complete a two-year Cegep di-ploma program of pre-university studies. Cegep programs also include three-year career/technical diploma programs (e.g., nursing) and a limited number of continuing education courses. This system is unique in Canada. Québec’s 48 tuition-free public Cegep programs account for close to 150,000 post-secondary students (Ministère de l’éducation–Enseignement supérieur, 2002).
Sample Selection
To be included in the study (a) students must have enrolled at the college for the first time between the autumn session of 1990 and the winter session of 2002; (b) they must have had no prior history of having studied at a Cegep; and (c) if the student had a disability, they had to have had this for a minimum of six months (cf. Taillon & Paju, 1999) and to have registered with the college’s Cen-tre for Students with Disabilities during the study period. Eligible students were identified based on the college’s records. There were 653 students with disabili-ties included in the study (315 women and 338 men). Of these, 475 were regis-tered in pre-university programs (275 of these were in social science), 74 were registered in career programs, 50 in preparatory sessions, and 54 in continuing education.
Students’ records at the Centre for Students with Disabilities usually indicate the “primary” or “most important” impairment that necessitates an accommo-dation. Although some students may have had several impairments, few were identified as having more than one for the purpose of obtaining accommoda-tions. The breakdown of disability types are detailed in Table 1. Students whose Table 1
Nature of Students’ Disabilities
Nature of Disability N % Visual impairment Low vision 26 3.6 Blind 7 1.0 Mobility impairment No wheelchair 22 3.0 Wheelchair user 34 4.7
Arms and hands 18 2.5
Hearing impairment/deafness Oral 35 4.8 Sign 16 2.2 Communication impairment 7 1.0 Learning disability/ADD 380 52.6 Psychiatric impairment 60 8.4
Chronic medical condition 102 14.1 Other disability or impairment 15 2.1
Total 722 100
eligibility was uncertain were contacted by telephone and asked to self-identify as having one or more of these impairments. Of the total sample of 653 dents, 81 (12%) were contacted. A single disability was reported by 596 stu-dents, 45 students reported two, and 12 students reported three disabilities. It can be seen in Table 1 that of the 722 disabilities recorded for the 653 students, slightly more than half (52.6%) were diagnosed learning disabilities and/or At-tention Deficit Disorder (ADD).
Students without disabilities were those 41,357 individuals (21,587 women, 19,770 men) who met the eligibility criteria but did not register with the Centre for Students with Disabilities. Of these, 25,157 were registered in pre-university programs (14,161 of these were in social science), 4,689 were registered in ca-reer programs, 2,352 in preparatory sessions, and 9,159 in continuing educa-tion. Given the relatively large size of the sample, inclusion of students with disabilities who did not register with the Centre would have had only a minor impact on the outcomes measured.
Success Indicators
Three outcome measures were examined: (a) graduation rates in diploma pro-grams at different points in time, (b) average grades in the first semester of study, and (c) pass rates in courses undertaken in the first semester of study. The data used to derive the indicators was obtained from the college’s academic records system. A cohort-based tracking system was used to determine graduation rates for full-time students enrolled in diploma programs. The progress of each cohort of students who commenced their studies full-time in the autumn session of each year from 1990 to 1998 was tracked, and the status of each cohort was assessed in May, at the end of the Winter 2002 semester. This allowed all students in the sample at least two additional years beyond the minimum time required to com-plete their diplomas. The graduation rates were calculated by dividing the cu-mulative number of students who graduated by the total number in the commencing cohort in three different time frames: the time prescribed for the program of study, two years beyond the prescribed time, and over the total pe-riod of observation. Using the extended time frames allowed us to determine the length of time taken to graduate, and, if any differences in graduation rates ex-isted between students with and without disabilities, to determine whether the rates equalized over time. Due to the small numbers of students with disabili-ties, the graduation rates were averaged for combined cohorts for the time frames selected. It should be noted that the reported rates will tend to underestimate the true rates at which students graduate from college, since 2% to 3% of each commencing cohort complete their diplomas at another Cegep.
Course pass rates were based on total grades (3,385 for students with disabili-ties; 210,037 for students without disabilities), and were calculated by dividing the total number of first semester courses passed by the total number under-taken. Final grades for each course were obtained from the college academic records system, at the end of the first semester exam period. These grades were
then averaged for each student. Failure grades of zero were excluded, as these generally occur when students withdraw from courses after the no-penalty dead-line. The frequency of “zero fail” grades for students with disabilities (3.2%) was lower than for students without disabilities (5.2%). A course average that ex-cludes failure grades of zero is a better measure of the ability of students to suc-ceed in courses, as it includes only students who actually participated in the course assessment activities.
The proportion of students with and without disabilities differed across pro-grams. Therefore, the analyses compared students with and without disabilities enrolled in (a) all programs combined, (b) career/technical programs, (c) pre-university programs, and (d) the social science pre-pre-university program. Social science students were examined separately because the largest number of stu-dents in both groups were enrolled in this program. Because all stustu-dents in the program were required to take similar courses, differences in performance that could be attributed to differing fields of study were removed.
The number of students in some of the disability categories was small. There-fore, to examine the performance of students with different disabilities, the sample was grouped into (a) those with learning disabilities/ADD (the largest group) and (b) all other students with all other disabilities combined. The students with multiple disabilities were included in the “all other disabilities” group. Because background factors could affect graduation rates, students with and without dis-abilities were compared on: gender, high school grades, academic programs in which students were registered, and first semester course load.
Student Characteristics
The group of students with disabilities, when compared to students without disabilities, had a significantly higher proportion of men (51.8% versus 47.8%), χ2 (1, N = 42,010) = 4.04, p < .05. Analysis of high school grades was carried out using a 2 x 2 analysis of variance (ANOVA) (disability status x gender). Re-sults showed a significant main effect for gender, with higher high school aver-ages for women (M = 74.5, SD = 7.7) than for men (M = 72.1, SD = 7.6), F (1, 23,327) = 59.35, p < .001). The disability status main effect was also significant,
F (1, 23,327) = 35.15, p < .001, and shows that students with disabilities (M =
71.2, SD = 7.0) had lower high school grades than students without disabilities (M = 73.5, SD = 7.8). The disability x gender interaction was not significant.
Students with disabilities who were enrolled as full-time students in diploma programs undertook a significantly lighter course load in the first semester (by .65 courses, representing approximately 92% of full load), compared to students without disabilities, t (542) = 9.69, p < .001. When only students enrolled in the social science program were compared, the mean difference of .91 courses (rep-resenting 87% of full load) was also significant, t (272) = 10.75, p < .001.
Course Pass Rates
Only first semester course pass rates were examined in order to ensure that students were undertaking courses at a similar level of difficulty. When all pro-grams were considered, the difference in pass rates between students with and without disabilities was not significant (80.5% for students without disabilities versus 81.2% for students with disabilities). When course pass rates for students with learning disabilities/ADD were compared to those of students with all other disabilities, the results were significant, χ2 (1, N = 3,085) = 24.87, p < .001 (78.3% of the courses undertaken by students with learning disabilities/ADD were passed compared to 85.1% for students with all other disabilities). The comparison of pass rates of students without disabilities and students with learning disabilities/ADD was not significant (Figure 1). The rate for students with all other disabilities (85.1%), compared to students without disabilities (80.5%), was significant, χ2 (1, N = 211,472) = 18.98, p < .001.
There was no significant difference in pass rates between students with and without disabilities in either the career/technical programs (83.6% for students without disabilities versus 84.9% for students with disabilities) or pre-university programs (80.5% for both groups). When only students in the social science program were considered, the percentage of courses passed by students with abilities was significantly higher than the percentage for students without dis-abilities (80.5% versus 76.6%, respectively), χ2 (1, N = 86,105) = 11.91, p < .001. This, however, was due to the relatively low pass rates of students without
Figure 1. Comparison of the pass rates of courses undertaken in the first
disabilities, as the rate for students with disabilities was similar to their rates in the all-program and pre-university program comparisons. A comparison of pass rates for the different groups is shown in Figure 1.
Average Grades
Students with disabilities entered their programs with lower high school aver-ages than students without disabilities. This is consistent with the findings of several studies (e.g., Horn & Berktold, 1999; Richardson, 2001; Richardson & Roy, 2002). The relationship between high school grades and average first se-mester grades is shown for the social science program in Figure 2. This regres-sion is typical of the relationship that exists in other programs. Given the strong relationship between average first semester grades and high school average, one might have expected students with disabilities to have obtained lower average grades in Cegep compared to students without disabilities.
To correct for possible gender differences in performance, the average grades of students with and without disabilities were examined for men and women. In addition, high school entry grades, where available, were used as a covariate in some analyses. Grades in first semester courses were examined to ensure that students were undertaking courses at a similar level of difficulty. To equate for possible differences due to field of study, students enrolled in the social science program were treated as a separate group.
Figure 2. Regression of high school averages and average first semester grades
Mean grades for the 2 x 2 ANOVA comparison (gender x disability status), for students in all programs, showed a significant main effect only for gender,
F (1, 40890) = 51.5, p < .001, indicating higher grade averages for women (68.3%)
than men (63.2%). There was no significant difference in the average grades between men with and without disabilities. The same held true for women. These findings held even when the high school grade was used as a covariate. Although details are not shown here, the pattern was similar for the pre-university and career program comparison.
When grades in the social science program were examined, the results of the 2 x 2 ANOVA (gender x disability status) indicated significant main effects for both gender, F (1, 14173) = 41.53, p < .001, and disability status, F (1, 14173) = 15.8, p < .001. Students with disabilities had higher average grades than stu-dents without disabilities, and women had higher average grades than men. The interaction was not significant. When high school entry grades were co-varied with average grades in social science, the analysis of covariance (ANCOVA) (gen-der x disability status) also showed a significant main effect for gen(gen-der, F (1, 9965) = 46.23, p < .001, and disability status, F (1, 9965) = 7.57, p < .001. Again, the interaction was not significant. In the social science program, both men and women with disabilities had higher grades than might have been expected given their lower high school averages (Table 2). However, it should be noted that the average grades for students with disabilities in social science (63.6%) did not differ from the average grades they obtained in all programs (63.7%) or in pre-university programs (63.9%). The better grade average in social science for stu-dents with disabilities is due to the fact that stustu-dents without disabilities performed less well in social science as compared to other programs, and this is a typical feature for social science, as the program admits weaker students. The average grade calculation for social science excludes students in science and liberal arts, Table 2
Average First Semester Grades of Women and Men by Disability Status for the Social Science Program
Students With Disabilities Students Without Disabilities Average Average Average Average
Grade High School Grade High School
Group N (SD ) Grade N (SD ) Grade
All women 110 70.9% n/a 7,347 65.6% n/a
(11.8) (17.9)
With high school grade 85 71.5% 69.1 5,222 66.2% 70.8
as covariate (11.7) (17.3) 70.8
All men 159 62.7% n/a 6,561 58.7% n/a
(16.4) (19.6)
With high school grade 126 61.5% 65.7 4,536 58.9% 67.4
programs with the highest entry requirements and average first semester grades. Relatively few students with disabilities enroll in these programs, as they tend to be overrepresented in social science.
When all programs were considered, a one-way ANOVA comparison of the three groups (learning disabilities/ADD, all other disabilities, students without disabilities) showed a significant difference in average grades, F(2, 40891) = 6.93,
p < .001. The same was also true for the social science program, F(2, 14174) =
8.69, p < .001. Post hoc testing (Tukey HSD test with alpha set to .05), and means in Table 3, show that for both comparisons students with learning dis-abilities/ADD had grades that were significantly lower than the average for stu-dents with all other disabilities. However, grades of stustu-dents with learning disabilities/ADD were not significantly different from those of students without disabilities, while grades of students with all other disabilities were significantly higher than grades of students without disabilities.
A 2 x 3 ANOVA (program x group) was used to examine average grades in pre-university and career/technical programs for three groups of students: (a) those with learning disabilities/ADD, (b) those with all other disabilities, and (c) those with no disability. The results show a significant main effect for group,
F(2, 29906) = 4.48, p < .05. There was no significant main effect for program,
and the interaction was not significant. Post hoc testing revealed the same pat-tern as for social science and the all program comparisons (Table 3).
Graduation Rates
Students enrolled in two-year pre-university programs between 1990 and 1998 or in three-year career programs between 1990 and 1997 were included in the analyses of graduation rates. The sample consisted of 316 students with ties (pre-university: n = 269; career: n = 47) and 18,747 students without disabili-ties (pre-university: n = 16,053; career: n = 2,694). The distribution of disabilidisabili-ties for the 316 students was similar to the proportions reported in Table 1.
Table 3
Average First Semester Grades of Students With Learning Disabilities/ADD, Students With All Other Disabilities, and Students With No Disabilities
Learning Disability/ADD All Other Disabilities No Disability
Average Average Average
Program N Grade SD N Grade SD N Grade SD
All programs 347 63.7% 16.5 285 69.5% 14.6 40,262 65.9% 19.8 Social science 166 63.6% 15.8 103 70.0% 13.3 13,908 62.3% 19.0 Pre-university 273 63.9% 15.9 188 70.3% 14.4 24,745 65.7% 18.7 Careers / 32 64.0% 19.4 40 70.8% 12.2 4,634 67.0% 16.7 technical
Pre-university programs. There was a significant difference between students
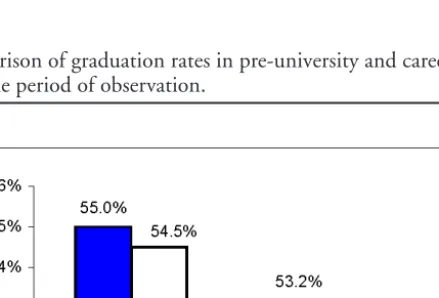
with and without disabilities in graduation in prescribed time (which takes four sessions), χ2 (1, N = 16,322) = 22.61, p < .001. The rate was lower for students with disabilities (15.2% versus 27.7%). However, there was no significant dif-ference in graduation in prescribed time plus two years (which takes eight ses-sions) (49.8% for students with disabilities versus 51.5% for students without disabilities), or over the total period of observation (55.0% for students with disabilities versus 54.5% for students without disabilities). Students with dis-abilities took longer to graduate (M = 5.95 sessions) compared to students with-out disabilities (M = 5.24 sessions), t (8891) = 4.38, p < .001. There was also no significant difference in the graduation rates for students with learning disabili-ties/ADD (55.5%) when compared to students with all other disabilities (54.5%) in any of the time frames considered. Figure 3 illustrates graduation rates in the pre-university and career/technical programs over the period of observation.
Career/technical programs. There was no difference in the graduation rates for
prescribed time plus two years (which takes 10 sessions) (46.8% for students with disabilities versus 49.5% for students without disabilities) or the period of observation (53.2% for students with disabilities versus 51.7% for students with-out disabilities). Students with disabilities (M = 8.24 sessions) took significantly longer to graduate than students without disabilities (M = 6.92 sessions), t (1417) = 3.43, p < .001.
Figure 3. Comparison of graduation rates in pre-university and career/technical
Gender and disability status. The sample size permitted an analysis of
gradua-tion rates broken down by gender and disability status for students in pre-uni-versity programs. Men graduated at significantly lower rates than women in each of the three time frames considered (p < .01 for the three chi-squaretests). There was no significant difference between men with and without disabilities for gradu-ation rates in prescribed time plus two years (41.8% vs. 44.2%) or for the period of observation (48.6% vs. 47.7%). The same held true for women in prescribed time plus two years (59.3% vs. 57.5%) and over the period of observation (62.6% vs. 60.2%). The only differences found were for the prescribed time rates be-tween men with (10.3%) and without (21.5%) disabilities (χ2 (1, N = 7,456) = 10.78, p < .001), and women with (21.1%) and without (32.8%) disabilities (χ2 (1, N = 8,866) = 7.55, p < .01). Both students with and without disabilities had significantly lower graduation rates for men in each of the time frames (p < .01 for the six chi-square comparisons). Over the period of observation these differ-ences were similar for both groups (students with disabilities = 14.0%; students without disabilities = 12.5%).
The findings indicate that students with disabilities at the college had gradu-ation outcomes that were virtually identical to those of students without dis-abilities. The main difference was that students with disabilities took, on average, approximately one semester longer to graduate. Examination of average grades and course pass rates showed that students with disabilities did at least as well as, and in some cases significantly better than, students without disabilities. When students with disabilities were divided into two groups, students with learning disabilities/ADD and students with all other disabilities, the overall trend was for students with learning disabilities/ADD to have similar academic outcomes to students without disabilities (grades, course pass rates, graduation rates) and for students with all other disabilities to have equivalent (graduation rates) or superior outcomes (grades, course pass rates). In some cases students with dis-abilities performed better than would have been expected based on their high school grades.
Several studies in the literature show either that post-secondary students with disabilities do almost as well as students without disabilities (Horn & Berktold, 1999) or that they do equally well (e.g., Outcomes Group, 1998), especially when scores are corrected for lower high school grades (Richardson, 2001; Richardson & Roy, 2002). Consistent with our results, one study conducted at a junior/community college showed that students with disabilities do as well as or better than students without disabilities (Gavilan College, 2002). Other studies suggest that students with disabilities do less well (Adelman, 1990; Horn & Berktold; Moisey, 2004). It is not surprising that results vary, since the system used to classify the disability, the manner in which students with disabilities are identified, the methodologies used to measure the success of students,
demo-graphic variables, and the quality and extent of the disability support services provided will influence the outcomes reported in different studies and make com-parisons difficult.
All of the post-secondary institutions in Canada are provincially regulated and exercise some degree of self-governance. There is no national requirement that institutions collect and report on the status of students with disabilities (CADSPPE, 1999). This makes it difficult to conduct the systematic research required to measure success rates, identify the factors that contribute to academic success, and determine the extent to which accommodations contribute to im-proved academic performance of students with disabilities in post-secondary study. The sample of students with disabilities in this study consisted of students who registered with the college’s Centre for Students with Disabilities and had access to disability-related accommodations. However, this group represents only a portion of the total number of students with disabilities at the college, as many students fail to register to receive disability-related services for a variety of rea-sons (Fichten et al., 2004; Fichten, Bourdon, Creti, & Martos, 1987). Would the findings in the present study have been as optimistic had students received poor-quality or no services? The relatively better performance of students with disabilities at college, despite lower high school grades, suggests that college ac-commodations may be a contributory factor. The fact that students with learn-ing disabilities/ADD performed less well than the “other disabilities” group suggest that students with learning disabilities/ADD may have more difficulty in mas-tering course materials compared to those with other disabilities. However, this group did perform as well as students without disabilities and graduated at the same rates, again suggesting that the accommodations provided may have been responsible for allowing these students to perform at this level. The fact that the “other disabilities” group performed better than students without disabilities may be related to a number of factors, such as their lower course load and the ability to pre-register in their preferred classes and to select supportive teachers, along with any of the more disability-specific accommodations they may have used. However, it may also be due to factors unrelated to these accommodations (e.g., greater level of motivation) or an interplay of both. The study outcomes, al-though suggestive of a positive impact of accommodations, do not permit us to draw any conclusions. Further study is required to address the question. For ex-ample, we are currently undertaking research to examine the factors that stu-dents with disabilities perceive as facilitating and as hampering their academic progress, and to compare students with disabilities who did or did not register to receive disability-related services.
What the present study does show, however, is that students who register to receive disability-related services from their college can and do achieve good aca-demic results, and that they are just as likely to graduate, given sufficient time. This has implications for both counsellors and policy makers. As the number of students with disabilities continues to rise (CADSPPE, 1999), demands on dis-ability service providers will escalate. It is important that decision makers
associ-ated with budget allocations are provided with evidence-based research that shows how investment in disability support services results in improvements in gradua-tion and retengradua-tion rates. Better system-wide collecgradua-tion of data indicating the disability status of students is required in order to achieve this. Many institu-tions set policies regarding eligibility for scholarships and admission to competi-tive programs that require full course loads to be undertaken. The present study, as well as others (e.g., Vogel & Adelman, 1992), have shown that students with disabilities may take lighter course loads and take longer to graduate. These policies need to ensure that students with disabilities are not systematically discriminated against due to their lighter course loads. Admissions policies need to recognize that despite lower high school grades, students with disabilities are capable of succeeding as well as students without disabilities.
High school students with disabilities need to be encouraged to pursue post-secondary education. Counsellors, like parents and the students themselves, are frequently unaware of the services available to students with disabilities in post-secondary settings—services that, in many cases, are superior to those available in high school (Jean-Charles Juhel, personal communication, January 21, 2004). Guidelines for accessing disability-related services at the post-secondary level should be part of a college transition plan, developed collaboratively with pro-spective students and their parents, teachers, and counsellors. Providing oppor-tunities to meet students with disabilities who have been successful in post-secondary education can provide positive role models for those developing their career plans. Faculty, both at high school and at the post-secondary level, need to be made aware that students with disabilities are capable students who need to be suitably challenged. Students with disabilities may get the message from their teachers, parents, and fellow students that they must set their goals lower, that they are “in”capable and “un”able, and that “they must be realistic” (cf. Wright, 1983). The present results, which show that students with disabili-ties performed as well as or better than would have been expected given their high school grades, go a long way to help dispel such myths.
Acknowledgements
This article was prepared with assistance from a grant from the Programme d’aide à la recherche sur l’enseignement et l’apprentissage (PAREA) and Dawson College. We are grateful for the generous support of these organizations.
References
Adelman, P. B. (1990). College graduates with learning disabilities employment attainment and career patterns. Learning Disability Quarterly, 13, 154–166.
Astin, A. (1984). How “good” is your retention rate? Research in Higher Education, 38(6), 647– 658.
Canadian Association of Disability Service Providers in Postsecondary Education (CADSPPE). (1999). A report on support for students with disabilities in postsecondary education in Canada. Kingston, ON: Author.
Consortium for Student Retention Data Exchange (CSRDE). (2001). Executive summary. 2000– 01 retention report. Report retrieved February 2, 2004, from <http://tel.occe.ou.edu/csrde/ execsum.pdf>.
Darroch, G., Northrup, D., & Ondrack, M. (1987). Student withdrawals at York University: First and second year students, 1984–1985. Toronto, ON: Institute for Social Research, York University.
Dolan, E. (1986). Retention study: Year 1 students 1982/3 and 1983/4. Toronto: York University. Duquette, C. (2000). Experiences at university: Perceptions of students with disabilities.
Cana-dian Journal of Higher Education, 30(3), 123.
Fichten, C. S., Asuncion, J. V., Barile, M., Robillard, C., Fossey, M. E., & Lamb, D. (2004). Canadian postsecondary students with disabilities: Where are they? Canadian Journal of Higher Education, 33(3), 71–114.
Fichten, C. S., Bourdon, C. V., Creti, L., & Martos, J. G. (1987). Facilitation of teaching and learning: What professors, students with a physical disability and institutions of higher edu-cation can do. Natcon, 14, 45–69.
Garton, B. L., Dyer, J. E., & King, B. O. (2000). The use of learning styles and admission criteria in predicting academic performance and retention of college freshmen. Journal of Agricultural Education, 41(2), 46–53.
Gavilan College. (2002). Academic performance in math and English and award rates of disabled students. Retrieved June 17, 2003, from <http://www.gavilan.edu/research/reports/DSPS023. PDF>.
Grayson, J. P. (1994). Who leaves science? The first year experience at York University. Toronto, ON: Institute for Social Research.
Grayson, J. P. (1995). Race and first year retention on a Canadian campus. Toronto, ON: Insti-tute for Social Research.
Grayson, J. P. (1997). Institutional failure or student choice? The retention of adult students in Atkinson College. Canadian Journal for the Study of Adult Education, 11(2), 7–30.
Grayson, J. P. (1998). Racial origin and student retention in a Canadian university. Higher Edu-cation, 36, 323–352.
Grayson, J. P., & Grayson, K. (2003). Research on retention and attrition. Retrieved February 2, 2004, from <http://www.millenniumscholarships.ca/en/research/retention_final.pdf>. Horn, L., & Berktold, J. (1999). Students with disabilities in post-secondary education: A profile of
preparation, participation and outcomes. Washington, DC: National Center for Education Sta-tistics. Retrieved June 17, 2003, from <http://nces.ed.gov/pubs99/1999187.pdf>.
Jorgensen, S. (2004). Male academic underachievement: An examination of the evidence, reasons and possible solutions. (Available from the Office of Institutional Research, Dawson College, 3040 Sherbrooke Street West, Montreal, Quebec, Canada H3Z 1A4)
Gouvernement du Québec, Ministère de l’éducation. (2001). Graduation rates in OECD coun-tries: Education statistics bulletin, 21 (Code: 28-2726A). Québec: Gouvernement du Québec. Ministère de l’éducation—Enseignement supérieur (Gouvernement du Québec). (2002). Nombre d’élèves inscrits au collégial à l’enseignement ordinaire et à temps plein, selon le type de formation et la classe: Réseau public. Retrieved December 8, 2002, from <http://www.meq.gouv.qc.ca/ stat/Sipeec/Reseau_public.htm>.
Moisey, S. D. (2004). Students with disabilities in distance education: Characteristics, course enrollment, and completion and support services. Journal of Distance Education, 19(1), 73– 91.
Montmarquette, C., Mahseredjian, S., & Houle, R. (2001). The determinants of university drop-outs: A bivariate probability model with sample selection. Economics of Education Review, 20(5), 475–484.
Mulvenon, S. W., Stegman, C., Thorn, A., & Thomas, S. (1999). Selection for college admis-sion: Refining traditional models. Journal of College Admission, 162, 20–27.
Nelson, B., Dunn, R., Griggs, S. A., Primavera, L., Fitzpatrick, M., Bacilious, Z., et al. (1993). Effects of learning styles intervention on college students’ retention and achievement. Jour-nal of College Student Development, 34, 364–368.
Outcomes Group. (1998). 1998 outcomes of former students with disabilities: BC college and insti-tute student outcomes report. Retrieved June 17, 2003, from <http://outcomes.bcstats.gov.bc.ca/ Publications/disabilities/Disabled.pdf>.
Peters, R. D. (2000). Predicting the end of term status of community college general psychology students. Journal of College Student Retention, 2(2), 109–114.
Richardson, J. T. E. (2001). The representation and attainment of students with a hearing loss in higher education. Studies in Higher Education, 26, 184–204.
Richardson, J. T. E., & Roy, A. W. N. (2002). The representation and attainment of students with a visual impairment in higher education. British Journal of Visual Impairment, 20, 37– 49.
Statistics Canada. (2002). A profile of disability in Canada, 2001: Participation and Activity Limi-tation Survey (PALS). Catalogue no. 89-577-XIE. Retrieved June 17, 2003, from <http:// www.statcan.ca/english/freepub/89-577-XIE/index.htm>.
Statistics Canada. (2003). Participation and Activity Limitation Survey, 2001: Education, employ-ment and income of adults with and without disabilities—Tables. Catalogue no. 89-587-XIE. Retrieved October 5, 2003, from <http://www.statcan.ca/english/freepub/89-587-XIE/ free.htm>.
Taillon, J., & Paju, M. (1999). The class of ’95: Report of the 1997 national survey of 1995 graduates. Ottawa, ON: Statistics Canada. Retrieved June 17, 2003, from <http://www.hrdc-drhc.gc.ca/arb/publications/books/class95/class95.pdf>.
Tinto, V. (1993). Leaving college (2nd ed.). Chicago: University of Chicago Press.
Ungar, S. A. (1980). The retention problem: An analysis of enrolment attrition at a Canadian college. Canadian Journal of Higher Education, 10(1), 55–78.
Vogel, S. A., & Adelman, P. B. (1992). The success of college students with learning disabilities: Factors related to educational attainment. Journal of Learning Disabilities, 2(7), 430–461. Wright, B. A. (1983). The coping-versus-succumbing frameworks. In Physical disability: A
psy-chosocial approach (2nd ed.). New York: Harper & Row.
About the Authors
Shirley Jorgensen is the institutional research coordinator at Dawson College and has worked extensively in the field of institutional research in both Canada and Australia. She has com-pleted her MBA in Management Information Systems.
Catherine Fichten, Ph.D., teaches psychology at Dawson College, where she also co-directs the Adaptech Research Network. She is also a clinical psychologist at the Jewish General Hospital in Montreal and is an associate professor of psychiatry at McGill University.
Alice Havel has been the coordinator of services for students with disabilities at Dawson College since 1992. She completed a Ph.D. in Counselling Psychology from McGill University and has over 25 years’ experience in the counselling field.
Daniel Lamb graduated from Concordia University in 1992. Through personal experience, he acquired expertise and knowledge of computer technology as a means of circumventing disabili-ties. He is now associate project manager of the Adaptech Research Network.
Crystal James is an undergraduate in psychology at Concordia University and a research trainee with the Adaptech Research Network.
Maria Barile holds a Master’s in Social Work and has been a community-based activist in dis-ability issues for many years. She co-directs the Adaptech Research Network at Dawson College. Address correspondence to Shirley Jorgensen, Dawson College, 3040 Sherbrooke St. West, Westmount, Quebec, H3Z 1A4, e-mail <[email protected]>.