HAL Id: halshs-03022276
https://halshs.archives-ouvertes.fr/halshs-03022276
Preprint submitted on 24 Nov 2020
HAL is a multi-disciplinary open access
archive for the deposit and dissemination of sci-entific research documents, whether they are pub-lished or not. The documents may come from teaching and research institutions in France or abroad, or from public or private research centers.
L’archive ouverte pluridisciplinaire HAL, est destinée au dépôt et à la diffusion de documents scientifiques de niveau recherche, publiés ou non, émanant des établissements d’enseignement et de recherche français ou étrangers, des laboratoires publics ou privés.
Income Inequality under Colonial Rule: Evidence from
French Algeria, Cameroon, Tunisia, and Vietnam and
comparisons with British colonies 1920-1960
Facundo Alvaredo, Denis Cogneau, Thomas Piketty
To cite this version:
Facundo Alvaredo, Denis Cogneau, Thomas Piketty. Income Inequality under Colonial Rule: Evidence from French Algeria, Cameroon, Tunisia, and Vietnam and comparisons with British colonies 1920-1960. 2020. �halshs-03022276�
Income Inequality under Colonial Rule:
Evidence from French Algeria,
Cameroon, Tunisia, and Vietnam
and comparisons with British colonies 1920-1960
Facundo Alvaredo, Denis Cogneau,
Thomas Piketty
July 2020
1
Income Inequality under Colonial Rule
Evidence from French Algeria, Cameroon, Tunisia, and Vietnam
and comparisons with British colonies 1920-1960
*Facundo Alvaredo
Paris School of Economics, IIEP-UBA-Conicet, EHESS Denis Cogneau
Paris School of Economics, IRD, EHESS Thomas Piketty
Paris School of Economics, EHESS July 2020
Abstract: In this article we assess income inequality across French and British colonial empires between 1920 and 1960. For the first time, income tax tabulations are exploited to assess the case studies of French Algeria, Tunisia, Cameroon, and Vietnam, which we compare to British colonies and dominions. As measured by top income shares, inequality was high in colonies. It fell after WWII, but stabilized at much higher levels than in mainland France or the United Kingdom in the 1950s. European settlers or expatriates comprised the bulk of top income earners, and only a minority of autochthons could compete in terms of income, particularly in Africa. Top income shares were no higher in settlement colonies, not only because those territories were wealthier but also because the average European settler was less rich than the average European expatriate. Inequality between Europeans in colonies was similar to (or even below) that of the metropoles. In settlement colonies, the post-WWII fall in income inequality can be explained by a fall in inequality between Europeans, mirroring that of the metropoles, and does not imply that the European/autochthon income gap was reduced.
JEL Codes: O15, O53, O55, N3, N35, N37
Keywords: Inequality; Top incomes; Colonialism; Africa; Asia
* We acknowledge the financial support that the French National Agency for Research (ANR-11-BSHS1-006), the Institute for New Economic Thinking, the ESRC-DFID Joint Fund (Grant ES/I033114/1), and the European Research Council (Grants 340831 and 856455) provided at different stages of this research. We are grateful to Louise Guillouët and Augustin Bergeron for excellent research assistance at different stages of the project. Jean-Pascal Bassino kindly gave us access to his data on Vietnam. We thank Sylvie Lambert for helpful comments, as well as conference participants at University of Sussex (AEHN 2016), the Paris School of Economics, and MIT (WEHC 2018). The usual disclaimer applies.
2
1. Introduction
Almost by definition, colonial societies entailed huge inequalities in political power and agency, as well as in social and economic opportunities, if only along the racial divide between European and autochthonous populations. The day-to-day experience of colonized peoples is well known; from very early on, the various forms of domination and discrimination were exposed through
militant pamphlets, analytical essays, and sociological works.1,2 In contrast, the within-group
inequalities of both the colonizers and the colonized have received little attention. On European settlers or expatriates, recent historical works have described opportunities offered by the colonial context (Lambert 2009; Chambru & Viallet-Thévenin 2019; Michel 2019). However, success stories are only part of the picture, and not all Europeans managed to find their way into the elite. Regarding autochthons, while some chiefs, landlords, religious leaders or scholars opposed colonial domination and were wiped out, others entered into various forms of collaboration with colonial authorities and were able to reap political and economic benefits. Furthermore –and despite colonial discrimination-, commerce, urbanization, and education opened new channels for accumulation and upward mobility, and also produced some of the soon-to-be leaders of the independence era (Chater 1993; Sraieb 1993; Brocheux & Hémery
1994; Pervillé 1997; Bezançon 2002; 2002).3 Colonial societies also included autochthonous or
immigrant minorities, such as Jews in North Africa, Levantines in West Africa, Indians in East Africa, or Chinese in Indochina, who played an important role in trade, and who were able to occupy intermediate positions within the income and wealth distributions. In any case, the current picture of colonial inequality is incomplete.
As far as the quantitative evidence is concerned, little is known about income and wealth concentration in colonial societies, especially from a comparative standpoint, and particularly for
Africa. How great was economic inequality in the colonies of the 20th century, and how did it
compare to other historical cases? Could autochthonous elites compete with the richest Europeans in terms of economic affluence, and how high was inequality among the colonized, including non-European minorities? Was inequality higher where Europeans were many? Were the European enclaves homogeneous or not? How did the richest Europeans in the colonies compare with the richest in the mainland? As inequality fell in Europe following World War II, and colonialism became increasingly scrutinized for the treatment of its subjects, did inequality also decrease in the colonies, and why? This paper contributes to answering these questions by studying the concentration of income in four French colonies across Africa and Asia, and comparing them to those of the British Empire. Knowing more about colonial inequality is essential to better understanding the political economy of colonialism itself. It is also important for understanding the socioeconomic structures that the newly independent nations inherited with the end of the colonial rule, hence the political economy of the postcolonial era. In terms of inequality, colonial legacies varied depending on whether settlers left (Algeria) or stayed (South Africa). Furthermore, the ideological pathways chosen by newly independent nations ranged
1Among the earliest works in the French colonial context, Nguyen Ai Quoc (1925) belongs to the first category, Franz Fanon (1952) and Albert Memmi (1957) to the second, and Georges Balandier (1955) and Pierre Bourdieu (1958) to the third.
2The fate of mixed-race individuals also well demonstrates the difficulty of bridging the divide between colonizer and colonized (White 1999; Saada 2012).
3
from Marxism-Leninism (North Vietnam, and later the whole of Vietnam), to ‘planned’ or ‘community’ liberalism (doctrines of the two successive presidents of independent Cameroon), to variations of socialism (Algeria, Tunisia, India) that were later either abandoned or amended. Despite their diversity, what these doctrines had in common was an objective to reduce inequality by breaking with colonial structures.
Until recently, studies on colonial inequality have focused on the distribution of the populations across social classes, each of which is associated with an estimate of average income; today, this construct is known as a “social table”. In a seminal work on French North Africa, Samir Amin estimates the average income of Muslims and non-Muslims in agricultural and non-agricultural
occupations in 1955, at the end of the colonial period (1970, pp. 60-89).4 Bigsten (1986)
disaggregates national income in Kenya from 1914-1976 into 13 occupational groups; having estimated income inequality within each group for a given date, he assumes the within components to be time-invariant and produces a time series for the Gini coefficient of income inequality. He finds that the Gini coefficient increases sharply between 1914 and 1950, from 0.50 to 0.70, following the urban-rural income gap, and then fluctuates between 0.60 and 0.70 in the 1950s and 1960s. Bolt and Hillbom (2016) use the same method to study income inequality in Botswana from 1921 to 1974; they find a regular increase in the income Gini from the mid-1930s to the mid-1970s, followed by stagnation at a very high level. Aboagye and Bolt (2018) construct social tables for Ghana between 1891 and 1960, and also find an increase in the Gini coefficient between 1930 and 1960. In contrast, Alfani and Tadei (2017) look at Cote d’Ivoire and Senegal, two French colonies in West Africa, and find a significant decrease in the Gini and Theil coefficients between 1939 and 1954, which they link to the reduction of inequality between Europeans and autochthons. Milanovic, Lindert, and Williamson (2011) use social tables to estimate Gini coefficients for 28 pre-industrial societies, including New Spain (1790) and
precolonial (1750) and colonial (1947) India.5 Milanovic (2018) adds 13 social tables to this
database, including one from Sarah Merette (2013a, b) on colonial Southern (Cochinchina) and Northern (Tonkin) Vietnam in 1929. The social table approach entails a number of limitations. First, the method is mostly based on labor earnings linked to occupations, and often ignores (or
fails to capture) other relevant sources of income (rents, profits).6 Second, inequality within
occupational groups can be severe, and can change across time. Third, the contents of each occupation may vary across space and time.
Fiscal sources allow for a more direct approach that can complement social tables and address some of the drawbacks of missing survey data. After World War I, Britain and France gradually introduced progressive personal income taxes in their colonial empires, shortly after the
enactment of these taxes in the metropolis.7 In recent work, Atkinson (2014, 2015a, b, c)
4 See Appendix Table C1. Ageron (2005) discusses Amin’s figures for Algeria, and points to large uncertainties. 5 On the basis of these estimates, Williamson (2010, 2015) contradicts Engerman and Sokoloff (2000), arguing that inequality in Spanish and Portuguese America was moderate and that it rather rose long after independence, following the first wave of globalization in the late 19th century.
6 Frankema (2010) analyzes the colonial origins of land inequality in Malaysia, Sierra Leone and Zambia.
7Even if this work is related to the latest developments in the study of top incomes (Atkinson and Piketty, 2007, 2010; Alvaredo et al., 2013), it is worth recalling that this area of literature has long been concerned with the colonial territories: Frankel and Herzfeld (1943) published estimates of the European income distribution in South Africa based on the income tax returns by making use of control totals from the population census and from the national
4
exploited income tax data for former British territories in Central, West and East Africa. Here, we use income tax distributional tables published in French statistical abstracts to estimate and analyze the shares accruing to top income groups across four French colonial territories, Algeria, Tunisia, Vietnam, and Cameroon, between 1920 and 1960. We then compare the data to British colonies and former dominions in Africa and Asia (Atkinson 2014, 2015a, b, c; Alvaredo and Atkinson 2010; Alvaredo, Bergeron and Cassan 2017, Banerjee and Piketty, 2010), as well as with France or the United Kingdom (Atkinson 2005, 2007b; Piketty 2001, 2007). No data source is perfect, and this approach is not exempt from shortcomings. We discuss, in particular, a number of methodological limitations: sensitivity to population and income aggregates, coverage and enforcement of the income tax, and definitions of income.
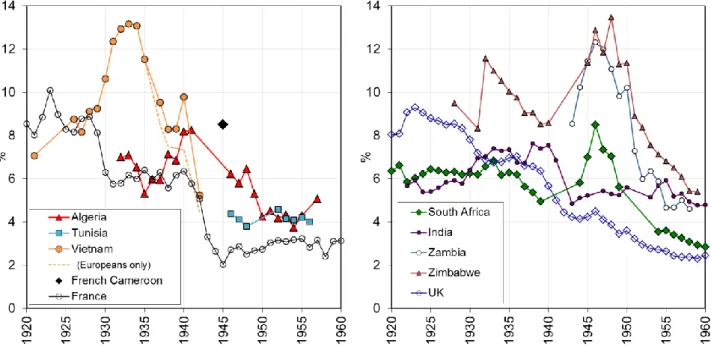
Figures 1 and 2 provide a preview of the main results. Unsurprisingly, we find that top income
inequality in the French and British empires of the 20th century was high. Although it fell
significantly after World War II, as it did in mainland France or United-Kingdom, it stabilized in the 1950s at higher levels than in the metropoles. Although non-Europeans were sometimes present at the top of the income distribution, this was rarely the case in Africa. In Tunisia, non-Europeans, including the Jewish minority, could represent up to 20% of top income earners; in South Vietnam, non-Europeans, including the Chinese minority, could reach up to 30 to 40% of the top income group. European settlers or expatriates always made up the majority of top income recipients, to a greater extent in Africa. Despite being wealthier, the top income shares of settlement colonies were no higher than in colonies where the number of European expatriates was far smaller. This was because in non-settlement colonies the top rich expatriates were more exclusive or received higher bonuses than settlers did. Inequality between Europeans must have been close to, or even lower than, inequality in the mainland of origin. We show that in the settlement colonies of South Africa, Algeria, or Zimbabwe, the post-war fall in colonial inequality can be explained by the fall of inequality between Europeans alone, which mirrored that of mainland Europe, and cannot be taken to imply that the income gap between Europeans and autochthons decreased.
The remainder of this paper is organized as follows. Section 2 provides a brief historical background for the four French colonies, along with a description of the various forms of income taxes that were implemented after WWI. Section 3 presents the income distribution data and estimation methodology. Section 4 describes our estimates of the population of tax units and of the total (fiscal) reference income. Section 5 presents the results, with details on wealthy autochthons, European settlers and expatriates, and an analysis of the evolution of inequality before and after World War II. Section 6 concludes.
accounts; their use of external information to complement income tax data pre-dates Kuznets’ study of upper income groups in the US by ten years (1953).
5
Figure 1. Top 1% income share in the French and British colonial empires, 1920-1960
Sources: Table 2A (Algeria), Table 2B (Tunisia), Table 2D (Indochina), Piketty, 2001, 2007 (France), Atkinson, 2005, 2007a (UK), Alvaredo and Atkinson, 2010 (South Africa), Banerjee and Piketty, 2010 and Alvaredo, Bergeron and Cassan, 2017 (India).
Figure 2. Top 0.1% income share in the French and British colonial empires, 1920-1960
Sources: Table 2A (Algeria), Table 2B (Tunisia), Table 2C (French Cameroon), Table 2D (Vietnam), Piketty 2001, 2007 (France), Atkinson 2005, 2007a (UK), Alvaredo and Atkinson 2010 (South Africa), Banerjee and Piketty, 2010 and Alvaredo, Bergeron and Cassan 2017 (India), Atkinson 2015b, (Zambia and Zimbabwe).
6
2. Historical background and chronology of tax reforms
Algeria. Before the French invasion of 1830, Algeria was part of the Ottoman Empire. It was
officially annexed by France in 1848 and divided into three départements, although conquest wars would continue for the next four decades, the last major insurrection being that of the Kabylie province in 1871. French and other European populations (Spanish, Italian) more than doubled between 1871 and 1914. The Jews of Algeria were granted French citizenship in 1871. With the advent of the Third Republic, settlers’ opposition to the military administration gained momentum, and by 1900 they obtained some autonomy in government. In 1932, where our income tax data series on Algeria begins, non-Muslims accounted for 13.5% of the population (14.4% of tax units, given the differences in age, structure, and household composition between
Europeans and Muslims).8 After the mid-1930s, the share of non-Muslims began to slowly
decrease until it reached 10% in 1961. After the end of the independence war, in 1962, almost all French pied-noirs (settlers) and Jews left Algeria. Settlers made up the majority of the urban population, and in agriculture they produced wine and grew wheat and barley, oranges, lemons, and olives. Oil and gas production only became significant at the very end of the colonial period. After WWI, tax obligations made no distinction between French or European citizens and from Algerian “Muslims” as colonial subjects. The impôt complémentaire sur le revenu was set as early as in 1920, soon after the introduction of the income tax in mainland France in 1914. It came on top of other schedular taxes on salaries, profits, and rental income. The income tax also came to replace the old impôts arabes (Arab taxes) that had survived from the Ottoman period and were
abandoned in 1919.9 Published income tax tables make no distinction between Muslim and
non-Muslim taxpayers.10 Available distributional data cover the years from 1932 to 1957 (1942-1945
are missing).11
Tunisia. France conquered Tunisia (also formerly part of the Ottoman Empire) in 1881. It
remained a protectorate, under the official rule of the bey of Tunis, even if the actual power was exerted by the résident général de France and the French administration. French and Italian immigrants trickled in until WWI, by which point Europeans made up 7% of the population. Most of them gradually left the country in the decade that followed independence in 1956. In 1947, when our income tax data begins, Europeans represented 7.3% of population, of which
61% were French and 34% Italian (8.8% of tax units).12 By 1956, the year of the country’s
independence, this share had decreased to 6.7%. In contrast with Algeria, Jews were not granted French citizenship and were counted as “Tunisians” in official statistics; they represented 1.5% of the population in 1955, hence 18% of “non-Muslims.” The Jewish population left Tunisia after independence, half of them to Israel, and the other half to France. As in Algeria, settlers produced wine and grew wheat, oranges, lemons, and olives in the outskirts of the cities. The personal income tax, called the contribution personnelle d’État, was established in 1928. It began as a very simple tax with five income ranges (a lump-sum corresponding to each range) on the
8 See Appendix Table B1.A, column (9).
9 The achour and the hokkor (only in Constantine area) were taxes on agricultural land, the zekkat was a tax on cattle, the lezma only prevailed in Kabylie and was a head tax with three distinct rates according to estimated wealth. 10 Until 1938, the income tax was only levied in Northern Algeria, where more than 90% of the population lived. 11 Dates correspond to the year when incomes were earned, given that the income tax was levied the year after. 12 See Appendix Table B1.B, column (8).
7
resident population. Subsequently, it was transformed into a progressive income tax in 1937 with increasingly refined schedules as time went on. The tabulations from the income tax span from 1946 to 1956 (1949-1951 are missing), and provide a breakdown of European and Tunisian income recipients.
French Cameroon. French Cameroon resulted from the partition of the German colony of
Kamerun between the British and the French at the end of WWI. In 1920, about three quarters of the territory was placed under French rule as part of a mandate from the League of Nations. The remainder from the border of present-day Nigeria was placed under British rule. By 1946, the French population was still very small, and did not count more than 4,000 people -a little over 0.1% of the total. Independence came in 1960. French colonists established plantations for palm oil, bananas, and groundnuts. Coffee, cocoa, and rubber only arrived in the late 1950s, and oil production at the end of the 1970s. The impôt global sur le revenu was introduced in French Cameroon in 1937 and applied to all residents. For eligible taxpayers with incomes above the given threshold, it replaced the head tax. There were two versions of the tax, one for Europeans
and the other for Africans.13 The European income tax was truly progressive, while the African
version was a lump-sum tax whose amount depended on income. In 1945, the same system still applied: Europeans were subject to the impôt général sur le revenu, while relatively rich Africans had the impôt personnel nominatif par tranche de revenu. The Annuaire Statistique du Cameroun 1938-1945 provides two separate income tabulations for Africans and Europeans for incomes accrued in 1945. This is the only year for which we have been able to locate income distribution statistics.
Indochina / Vietnam. French Indochina was composed of five territories that were gradually
conquered by France between 1858 and 1899. Cochinchina (Southern Vietnam, capital city Saigon) was the first, in 1862, and was directly ruled as a colony. The other four, Annam (Central Vietnam, capital city Hue), Tonkin (North Vietnam, capital city Hanoi), Cambodia (capital city Phnom Penh), and Laos (capital city Vientiane), were officially registered as protectorates, although Tonkin was eventually managed as a colony. The gouvernement général of Indochina was established in 1897, putting the five territories under a federal administration. Europeans living across these territories were mostly French (constituting 95% of the total European population) and counted some 20,000 people in 1920, and a little less than 50,000 at the beginning of the 1940s. In 1920, half of this total resided in Cochinchina, which rose to two-thirds by 1948. Most of the remainder were based in Tonkin, and never represented more than 0.25% of the population. Chinese people constituted a larger minority, counting around 300,000 people in 1920 and over 600,000 in 1948 (over 2% of the population). After a short-lived invasion by the Japanese at the end of WWII, the French lost ground and were unable to regain control over the North. In 1947, partial autonomy was granted to Vietnam, Cambodia, and Laos, with Vietnam still divided into three regions (South, Central, and North). The war for Indochina ended with the French defeat of Dien-Bien-Phu in 1954. The French had invested in rice production and exports, rubber, tea and coffee plantations, and exploited coal and tin mineral resources. The taxe
personnelle sur les européens et assimilés was enforced in 1920 in all of Indochina and applied only to
13 According to public finance accounts (Cogneau, Dupraz & Mesplé-Somps 2018), the income tax was introduced in 1934 in French Central Africa (Afrique Equatoriale Française) and French Western Africa (Afrique Occidentale
Française), apart from Côte d’Ivoire, where it was installed in 1937, Togo in 1943, and Madagascar in 1946.
8
Europeans, Westerners, and the Japanese. It was a lump-sum which increased over twelve ranges of income. The implicit rates were very low. The tax was later replaced by the impôt général sur le
revenu, which applied to all households whose income lay above a relatively high threshold. The
latter was first implemented in Cochinchina and Cambodia in 1937. It then reached Laos and Annam in 1938, and finally Tonkin in 1940; however, in these three territories only Europeans, Chinese and other Asians were liable, while Indochinese households were exempt. In Cochinchina and Tonkin, tabulations from statistical annals distinguish Europeans, Chinese,
Asian foreigners, and Indochinese (the latter only in Cochinchina).14 As we lack estimates for
Cambodia and Laos’ domestic income, we focus on Vietnam (i.e. the reunion of Cochinchina, Annam and Tonkin), and only report estimates for the two other colonies in the Appendix.
British colonies and dominions. Our main focus is not the colonial history, economic
structure, or the income taxation features of the colonies, territories, and dominions of the British Empire included in our comparison; rather, we borrow results from a number of authors. In alphabetical order we consider: Ghana (former Gold Coast), India (British India then independent India without Pakistan), Kenya, Malawi (former Nyasaland), Nigeria, South Africa, Tanganyika (mainland part of Tanzania, merged with Zanzibar island in 1964), Uganda, Zambia (former Northern Rhodesia) and Zimbabwe (former Southern Rhodesia). The interested reader is referred to the papers of Atkinson on the British colonies in Africa (Atkinson 2014, 2015a, b, c), to Alvaredo and Atkinson (2010) on South Africa, and to Banerjee and Piketty (2010) and Alvaredo, Bergeron and Cassan (2017) on India. Each had its particular political arrangements, and not all remained strict colonies for the duration of the period under analysis. The Union of South Africa was a British dominion formed in 1910, and was made up of the former colonies of the Cape of Good Hope, Natal, Orange River Colony (or Free State) and Transvaal, and was transformed into a republic in 1961, before eventually leaving the Commonwealth; as is well known, the rule of the white minority only ended in 1994. India became independent in 1947. Following Ghana in 1957, all other British colonies gained their independence after 1960. Southern Rhodesia declared unilateral independence from Britain in order to preserve the white minority rule, which only came to an end with the creation of Zimbabwe in 1980. For our purposes, it is enough to say a final word on European settlement patterns. White settlers
represented around 20% of the population of South Africa from the beginning of the 20th
century until 1960, after which their population share decreased. Zambia and Zimbabwe, at the time respectively Northern and Southern Rhodesia, were settlement colonies like South Africa, although to a lesser extent, as Europeans never constituted more than 4% of the total population in the former, and never more than 7.5% in the latter; these fractions increased significantly in the 1950s. Kenya was another intermediate case, with the population of white settlers at around 0.6% in 1948. In other African colonies, Europeans did not make up more than 0.15% of the populations, like in Cameroon (but also Vietnam). In Eastern Africa, a significant Indian minority could also be found (such as in Kenya, Uganda, and Tanganyika). In all African colonies, except for South Africa and Southern Rhodesia, the majority of white settlers left the country after independence; many white Zimbabweans also left after the end of the white rule in 1980. Last, in India, Europeans represented an even smaller proportion of the population, less than 0.05%.
14 See the top panel of Appendix A1.E for population coverage. Again, dates correspond to the year when incomes were earned; the true date of implementation is the year after.
9
3. Income tax data and estimation methods
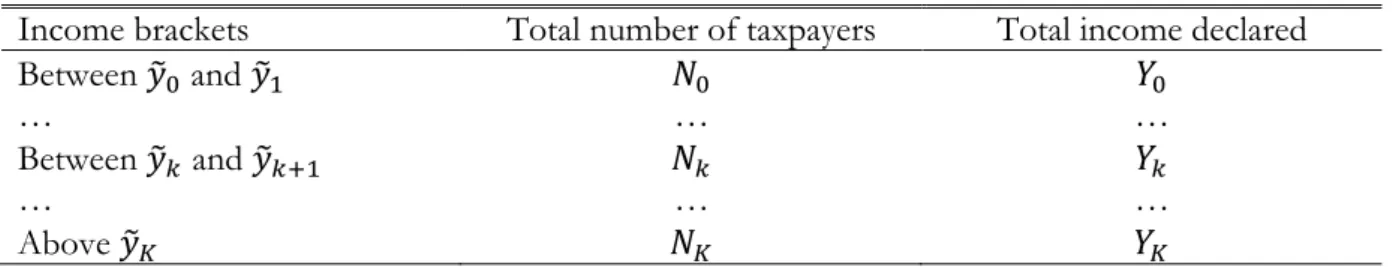
The data used here do not come in the form of individual tax records, which no longer exist for the period studied; rather, we make use of readily published tabulations. The information necessary for the estimation of top income shares is the distribution of taxpayers assessed by ranges of income and, ideally the amount of income in each range (present in many, but not all
cases). The tabulations categorize taxpayers by income ranges [𝑦̃𝑘; 𝑦̃𝑘+1[; for each income range
they report the number of taxpayers 𝑁𝑘 and the total income before tax 𝑌𝑘, as exemplified in
Table 1.
Table 1. The typical income tax tabulation
Income brackets Total number of taxpayers Total income declared
Between 𝑦̃0 and 𝑦̃1 𝑁0 𝑌0
… … …
Between 𝑦̃𝑘 and 𝑦̃𝑘+1 𝑁𝑘 𝑌𝑘
… … …
Above 𝑦̃𝐾 𝑁𝐾 𝑌𝐾
With the total number of potential tax units, N (assuming everyone was required to file for the income tax, i.e. including those who lay below the minimum income tax threshold), we can calculate the cumulated population share lying above the lower bound of each income
bracket: 𝑃𝑘= ∑𝑗≥𝑘𝑁𝑗⁄𝑁, for tax payers whose pre-tax income lies above 𝑦̃𝑘. In addition, if we
know the (before tax) total household income, Y, we are also able to estimate the income share
earned by people lying above 𝑦̃𝑘: 𝑆𝑘 = ∑𝑗≥𝑘𝑌𝑗⁄𝑌. Pareto interpolation techniques allow us to
estimate 𝑆𝑞, the income share earned by the q richest percent, for any q lying below 𝑃0.15 In this
paper, we apply the mean-split histogram method (Atkinson, 2005, 2007b).When the coverage of
the income tax is low, we can only estimate the shares of the very rich groups (the top 1% or the top 0.1%).
For some years, income tax tabulations only report the number of taxpayers and not their total declared income: Algeria 1932-1941 and 1946, Tunisia 1956, and for Vietnamese colonies
following the introduction of the income tax.16 We impute total declared income to each
bracket.17 The simplest solution can be applied to cases where the income records are available
for the previous or next year with the same income brackets; we then import the average income from the year with no missing income totals: Algeria 1946, using 1947; Tunisia 1956, using 1955; and Tonkin 1921, using 1922. A second and relatively easy case is that of Vietnam, where we still have access to the total amount of taxable income of liable taxpayers. Under the general income
tax, the total amount of incomes sitting above the liability threshold 𝑦̃1 (=3600 piasters) is
15 Readers interested in the details of the estimation methods are referred to Atkinson (2007b), Cowell (2011), and Blanchet, Fournier, and Piketty (2017).
16 See bottom panel of Appendix Table A1.E. 17 See Appendix A1.F.
10
reported.18 This is good because liable taxpayers make up just over 0.1% of fiscal units, so that
the estimate of the 0.1% income share is anchored on this known amount and does not depend much on our imputations (although lower top percentile shares do). For each bracket, we write:
𝑌𝑘 = 𝑁𝑘[𝑦̃𝑘+ 𝛼(𝑦̃𝑘+1− 𝑦̃𝑘)] for k=0, …, K, while setting 𝑦̃0 = 0 and 𝑦̃𝐾+1 = 2𝑦̃𝐾.19 The
parameter 𝛼 is then calibrated to fit the reported total amount. In Algeria 1932-1941, where the total of taxable incomes is not even available, we assume that the mean income exceeds the lower
bound of the bracket by 30% of the bracket range, and by 30% of 𝑦̃𝐾 in the last bracket.20
In the early years of Vietnamese colonies, before the introduction of the general income tax, incomes declared in the last bracket are obviously capped; indeed, as the tax is a lump-sum tax based on the brackets, it is not necessary to know the exact figure of incomes above the last threshold, as they are in any case subject to the maximum lump-sum tax. We use the ratio (1 +
𝛼) to 𝑦̃𝐾 for 1937 and 1938. This is innocuous for the estimate of the 0.1% income share (but
not for the 0.01%), as taxpayers in the last bracket never represent more than 0.006% of fiscal units.
Once all imputations are implemented separately, we aggregate the income tabulations of the three Vietnamese colonies into one, and estimate the top shares for Vietnam as a whole (1921 to 1942). In Appendix Figure D2 we also provide separate figures for Cochinchina, Annam, and Tonkin, while data for Cochinchina (South-Vietnam) extends beyond World War II, until 1949. In Algeria, until 1945, lump-sum deductions for family charges applied, and reported income was net of these deductions. Before 1937, only the number of children under 18 years old mattered. Starting in 1938, deduction schedules changed somewhat: married couples benefited from an initial deduction even in the absence of children, and the total deduction was modulated according to the level of declared income. These deductions mechanically generate an underestimation of the top income shares. As household composition is most likely correlated with income, it is very difficult to implement a refined correction. We can still compute a coarse estimate for the resulting underestimation. We used population census data for Algeria in 1948 to estimate the distribution of family types (married couples or single parents according to the number of children). Two separate distributions were produced for non-Muslims and Muslims. We then calculated the average deduction that would have applied to each year, assuming that the household composition of taxpayers was the same as in a population composed of 90% of the average non-Muslim household and 10% of the average Muslim household (while ignoring the
decrease in deductions with declared income, which is conservative).21 Under these assumptions,
18 In all years, the total number of registered European tax units is also reported, even below the liability threshold; this is why the first income bracket [0; ỹ1[ is not empty. In 1940, the reported taxable income total includes the income of these non-liable Europeans. See Appendix A1.F.
19 The latter ỹK+1= 2ỹK is arbitrary, yet it results in rather plausible estimates of α, which make the average income in the last unbounded income bracket exceed ỹK by 23 to 72%, depending on the colony and the year considered. 20The latter assumption is innocuous for the estimates of the 1% or 0.1% income shares, as the last open bracket never represents more than 0.004% of tax units, and always less than 0.002% after 1934.
21 This 90/10 weighing rule is motivated by the case of Tunisia where the breakdown of taxpayers by citizenship is reported. In Tunisia after WWII, around 20% of liable taxpayers are not Europeans, yet some of them are Jews. This is why we consider that only 10% of taxpayers were Muslim before WWII. Given the differences in household structure and the deductions schedule, assuming 0% or 20% of Muslims makes very little change.
11
the top 1% income share could be underestimated by 2.5 to 3.5 percentage points in the years 1932 to 1941. This would shift Algeria in the 1930s to above South Africa (Figure 1), and the fall of the top income share after WWII would look even sharper. Given that deductions are lump-sum amounts, their impact on the 0.1% top income share is negligible (one tenth of the calculated impact on the 1% share in percentage points).
To summarize, we believe that the impact of taxable income imputations, corrections for capped incomes, and deductions for family charges should be limited, both for the top 1% and top 0.1% income shares estimates on the total population. They could have more impact on the estimates of the within-group distributions (Europeans and non-Europeans); this source of uncertainty will be given due consideration in the analytical section.
4. Total population and income
In order to arrive at meaningful inequality estimates, the distribution of taxpayers by income ranges have to be combined with totals for the number of households N, and for household income Y. The income tax data can only be interpreted in the light of such external information. The assembly of this information for much of the first half of the twentieth century in the colonial territories requires a considerable investment, and further elements of uncertainty. As also stressed in Alvaredo and Atkinson (2010), an understanding of these processes is necessary to appreciate the limitations of the estimates, but may also provide confidence in their use. The next two sub-sections explain our estimates for the population total, as well as for total household income.
4.1 Population of tax units
In the four French colonies being studied, the income tax was originally levied on the tax unit, as in most countries, treating single adults and married couples as units. This is still the case in France today (and in the UK until 1989). Our income shares are consequently defined with respect to the population of tax units. In principle, the derivation of these numbers involves the following steps: (1) estimate of total population, (2) exclusion of those aged under 15, to arrive at the number of adults, and (3) subtraction of the number of married women to arrive at a total for tax units. The selection of the age of 15 is arbitrary but does not seem unreasonable, and follows common practice within the literature.
In this paper, due to the limitations of the available statistics, we will simply calculate the number of tax units as 60% of the population aged 15 and over. This method was chosen according to the data that was available, but also for the purpose of comparing our results with those of Atkinson (2014; 2015a, b, c), who made the same choice when analyzing British colonies. In the case of Algeria, and for Europeans in Indochina, we can confirm that this option is consistent
with a more refined analysis of demographic structures, as we detail below.22
22 The series of the control totals for population and income are given in Appendix Table B1.A (Algeria), Table B1.B (Tunisia), Table B1.C (Cameroon), and Table B1.D (Indochina). Sources for demographic estimates are in Appendix A2.
12
Algeria. The total numbers of “Muslims” and “non-Muslims” are drawn from population
censuses of 1931, 1936, 1948, and 1954 (Annuaire Statistique de l’Algérie, 1955). A population estimate for 1960 is taken from the United Nations Demographic Yearbook for 1966. The number of non-Muslims is drawn from the Annuaire Statistique de la France for 1962. These figures were double-checked with demographic studies from CICRED (1974a), and from Fargues (1986). Starting with 1931, demographers deem population censuses reliable enough. Age pyramids are available for the population censuses of 1936, 1948 and 1954. We use them to estimate the total population aged 15 and over, separately for Muslims and non-Muslims. We assume that the 1936 age structure applies to 1931, and that the 1954 age structure applies to 1960. Between census years, population figures are interpolated with constant annual growth rates.
Using the 1948 population census, we first estimate the number of tax units for 1948 as the sum of married men aged 15 and over, widowed and divorced men and women aged 15-69, single men and women aged 30-69, 80% of single men and women aged 25-29, 50% of single men and women aged 20-24, 20% of single men and women aged 15-19, and 50% of single men and
women over 70.23 For Europeans, the figure obtained represents 58% of the adult population,
close to the 60% figure used by Atkinson (2014; 2015a, b, c). For Muslims, it reaches 54%. For the sake of simplicity and comparison with existing estimates for the British Empire, we still take 60% of the population aged over 15 as the number of tax units, as mentioned above.
Tunisia. The total numbers of Europeans and Tunisians (including Jews) are drawn from
population census of 1946 and 1956, corrected by CICRED (1974b). To obtain the number of people aged 15 and over, we use the age pyramids also found in the censuses. We then apply the same ratio as in Algeria (60%) to arrive at the number of tax units in the European and Tunisian populations, respectively.
French Cameroon. For the population of Cameroon in 1945, we take the estimate from
Frankema and Jerven (2014), as colonial enumerations severely underestimate the total population, and are inconsistent with post-independence census figures. To calculate the population of the French region, we apply a ratio of 85% to account for the fact that the Southern part of British Cameroon merged with French Cameroon to form present-day Cameroon. The enumeration for 1945, as reported in the Annuaire Statistique du Cameroun
1938-1945 (vol. 1), points to a proportion of 65% of people aged 15 and over. As this kind of
enumerations tend to leave out a significant portion of children, the share is likely to be overstated. In 1948 Algeria, this share represents 57% for Muslims. We prefer to apply Algeria’s proportion for the population aged 15 and over, and then take 60% of those over 15 as our total population of tax units.
Indochina / Vietnam. Both the total population and the population of over 15-year-olds in
each of the five colonies of Indochina are from Banens (2000). We again take 60% of the 15 and over population as an estimate of the total number of tax units. The population of Europeans is available for the years 1921, 1929, 1931, 1936, 1937 (all of which were specific censuses specific for Europeans), 1947, and 1948. We are also able to estimate the number of European soldiers,
13
who always made up at least 20% of the European population, although from 1947 this rose to at least 50%. The majority of the members of the armed forces were exempt from income taxes. Once again, taking 60% of the number of Europeans aged 15 and over is therefore well suited to estimating the total number of Europeans in civilian employment, for both 1929 and 1937.
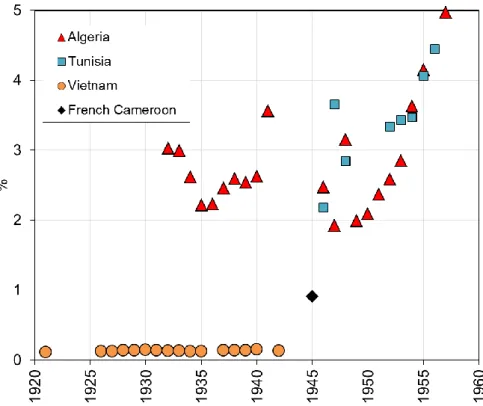
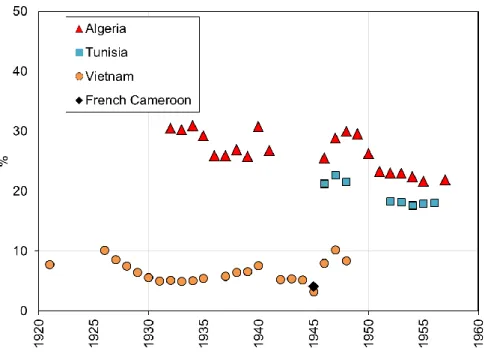
Figure 3. Income taxpayers as a percentage of total tax units, 1920-1960
Sources: Appendix Tables B1.A-B1.D, and Appendix A2.
Figure 3 displays the number of income tax payers covered by the published statistics as a proportion of the number of total tax units, whose estimation we have just described. While in Algeria and Tunisia income taxpayers represented over 2% of tax units, in Cameroon they made up only 0.9%, and in Vietnam just slightly more than 0.1%. These figures fix bounds to the top
income groups that we are able to study in each colony (𝑃0, as defined above). In North Africa,
they point to quite significant variations in coverage. In Algeria, the share of taxpayers varies between 1.9 (for 1947) and 5% (for 1957), and in Tunisia ranges from 2.2% in 1946 to 4.4% in 1956. These variations are mainly due to inflation and delayed adjustments of liability thresholds; the period of 1937-1949 is indeed characterized by high inflation, particularly between the years
1946 and 1949.24 In Tunisia, during 1955 and 1956, the notable increase in coverage stems from
the inclusion of more non-European taxpayers following independence in 1956 (given the one year delay, data for 1956 correspond to the income tax collected in 1957).
14
4.2. Total income
The tax records only cover a fraction of income, so we need to estimate control totals for aggregate income. As Atkinson points out “If the population totals pose problems, then control totals for household income take us into still more treacherous territory” (2014, p. 11). The difficulties in calculating national income in Africa are widely recognized, and there is much criticism of contemporary macro-economic statistics. Nonetheless, there is a long history of research on national accounts in Africa, specific to each of the countries that form the basis of our series. For the most part, we import the GDP and price data constructed by Cogneau, Dupraz and Mesplé-Somps (2018); the sources and methods for which are briefly described
below.25
Algeria. Official national accounts are available from 1950. We extrapolate GDP backwards
from 1950 to 1932, using Samir Amin’s estimate of the growth rate of real GDP between 1930
and 1955 (1970, p.54).26 To obtain GDP in current francs, for years 1938 to 1957, we use the
consumer price index of Algiers, and for years 1932 to 1938 we use the France price index from
Villa (1994).27 We must then go from GDP to household (fiscal) income. In 1950s France, the
gross primary income of households was around 85% of GDP, and household income was around 60% of gross primary income, due to important conceptual differences between the definition of income by national accounts and by the fiscal administration, in particular for non-salaried occupations (Piketty 2018, Appendix G). In Algeria, households’ gross primary income also lies between 80 and 87% of GDP in 1950-1957, with a mean of 83% which matches the
level at 1950, the base year for our backward projection.28 To calculate total household income
we then apply a ratio of 0.83×0.60=0.50 to GDP.
Tunisia. Estimates of GDP in constant francs are available for the years 1950 to 1961, as
reported in Amin (1966), Zarka (1964) and the Annuaire Statistique de la Tunisie (1955, 1959, 1960, and 1961-62). We grant our preference to Amin’s (1966) figures for 1953 (p. 297), 1955 (p. 101), and 1957 (p. 297). For 1953, Amin’s GDP is consistent with the Annuaire (1955), but 15% lower than Zarka’s. Amin’s figure for 1955 is 5% higher than Zarka’s, which means that 1953-1955 is a period of high growth (6.8% per year) according to the former, while GDP decreases according to the latter. Given the large public investments financed by loans at the end of the colonial period (Saul, 2016), Amin’s figures seem more likely. For 1957, the three estimates are very close; GDP falls down in the immediately following independence, and positive growth only resumes after 1958. We translate these estimates into current francs using the consumer price index of Tunis for the years 1938 to 1962. To obtain household income, we take 50% of GDP, as we did for Algeria.
25 More details are provided in the data appendixes of this paper. Original sources are detailed in Appendix A3. 26 Between 1930 and 1950, Cogneau, Dupraz, and Mesplé-Somps (2018) also make use of exports and imports data to estimate year-to-year GDP variation, see their data appendix.
27 Between 1938 and 1957, the Pearson coefficient of correlation between the two indexes is 0.99.
28 After 1954, large inflows of military soldiers, who are treated as residents in national accounts, tend to distort the representativeness of national income figures. The 1950s are also specific in that remittances (not included in GDP but included in household income) from Algerian migrants in France were already quite significant. For these reasons, taking 1950 as the base year is safer than taking an average of the 1950s.
15
French Cameroon. The GDP of the French part of Cameroon was estimated for the years 1947
and 1953 by the French administration in charge of the overseas territories. From 1947 back to 1945, we use Cogneau, Dupraz and Mesplé-Somps’ (2018) extrapolation, based on trade data. We translate the constant franc estimate to current prices using the consumer price index for Brazzaville (the capital city of French Congo, the nearest place where price data were collected between 1938 and 1951). We take 50% of GDP to obtain household income.
Indochina / Vietnam. GDP estimates at current prices for the three parts of Vietnam between
1920 and 1952 are from Jean-Pascal Bassino (2000), who generously shared his estimates with
us.29 Using these estimates, we apply the ratio of 50% to obtain household income.
Unfortunately, no GDP estimates were available for Cambodia and Laos. Even so, we still tentatively computed top income shares for these two colonies, by assuming that Cambodia and Laos had the same GDP per capita as Annam (Appendix Figure D6).
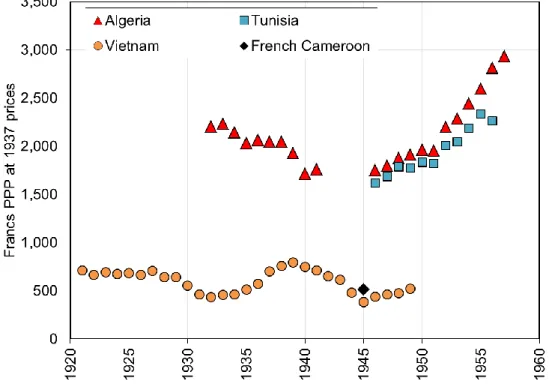
Figure 4. Estimates of GDP per capita in Algeria, Tunisia, French Cameroon and Indochina, 1920-1960
Sources: see text and Appendix A3.
Notes: The purchasing power parity conversion factor has been constructed using a basket of goods for years 1936-38. Compared to the reference country Algeria, prices are found to be lower by 5% in Tunisia, 20% in Cameroon, and 60% in Vietnam. See Cogneau, Dupraz and Mesplé-Somps (2018) (data appendix).
Figure 4 displays the time profile of the real GDP per capita between 1920 and 1960, for the
years when tax data are available. A number of comments are in order. In the first half of the 20th
century, average incomes in Algeria and Tunisia are considerably higher than in the rest of the empire. In particular, Cameroon and Indochina were four to five times poorer than Algeria in terms of PPP.
29 We use the Saigon consumer price index of 1920-1940 for Southern Vietnam (Cochinchina) and Central Vietnam (Annam), and the Hanoi consumer price index for Northern Vietnam (Tonkin).
16
In Algeria, GDP per capita decreased by 20% between 1930 and 1950, corresponding to the Great Depression and World War II. Very high growth rates were achieved in the 1950s, despite
the independence war which began in 1954. This can be attributed to the significant
infrastructural investments financed by the metropolis, as well as to growth recovery in France which encouraged Algerian exports. In Tunisia, growth was also quite high between 1946 and independence in 1956. In Cameroon, GDP per capita showed no signs of change until 1946, when large public investments financed by grants began, so that the only point we observe is before this growth spell. In Indochina, GDP per capita stagnated in the 1920s; subsequently, the Great Depression resulted in a collapse of the international prices of rice and rubber, causing a deep deflationary crisis in the first half of the 1930s. Growth resumed in the second half, but GDP collapsed again during WWII.
Figure 5 displays the ratios between the average incomes of the empire and mainland France. Before WWII, the metropole was three times richer than Algeria, and over ten times richer than Indochina (note that here, in contrast to Figure 4, the series are not adjusted for differences in price levels). After WWII, France experienced very high growth rates, increasing the gap with Algeria and Tunisia, which, despite their own growth processes, ended up four to five times poorer than France by the mid-1950s.
Figure 5. Average income in Algeria, Tunisia, French Cameroon and Indochina: ratio to average income in France, 1920-1960
Sources: Tables B1.A-B1.D and WID.world.
17
5. Income concentration in the French and British colonial empires 5.1. The income shares of the top 1% and 0.1% groups across time
Table 2 presents our estimates of top income shares for Algeria (Table 2A), Tunisia (Table 2B), French Cameroon (Table 2C), and Vietnam (Table 2D). Figure 1 shows the income share of the top 1% in Algeria and Tunisia, compared to France, and in South Africa and India compared to the United Kingdom, between 1920 and 1960. In Algeria, this share starts from a very high 22% in 1932, then drops steadily throughout the 1930s, and drops further during WWII, like in France. It stabilizes at around 15% in the 1950s. Measured between 1946 and 1956, the figures for Tunisia are slightly lower but close, at around 14%.
The inequality levels in Algeria in the early 1930s appear to be among the highest recorded in
WID.world.30 Even if the available data do not allow for a precise estimate, this suggests a top
10% income share of at least 60%, if not higher.31 As in many other countries, the Second World
War resulted in a sharp and definitive fall of top shares. French North Africa overwhelmingly depended on the mainland economy for its exports, and the fall of France resulted in a deep recession. The arrival of Allied forces in 1943 and ensuing warfare in Tunisia further deepened
the disruption of trade, and most likely accelerated capital losses.32 In contrast, South Africa
suffered less of an impact, and benefitted from the price boom of mineral exports, gold in particular, in the late 1940s. Inequality peaked; however, in the 1950s top shares finally fell far below pre-war levels (Alvaredo and Atkinson 2010). In the late 1950s, the levels of income concentration in Algeria, Tunisia, and India were greater than apartheid South Africa.
The set of top 0.1% shares depicted in Figure 2 includes figures for Vietnam between 1920 and 1942, for French Cameroon in 1945, and for Zambia and Zimbabwe on the side of British
colonies.33 In the 1920s, the top 0.1% share for Vietnam is estimated to be around 8%, a level
that sits in the same range as France, the UK, or Zimbabwe. As Europeans in Vietnam make up around 0.1% of tax units, this share reflects the average income of Europeans compared to autochthons, at least until 1937, when rich autochthons became liable to the income tax. After this date, the dotted line in Figure 2 shows the top 0.1% share when only Europeans are considered; the difference remains minimal until 1940, when many more wealthy non-Europeans came to be counted. Europeans seem to have been relatively well protected from the deflation and economic collapse of the first half of the 1930s, so that their share in total income actually jumps upward to 12% before falling back to pre-crisis levels at the end of the decade. This increase in top shares is observed across all parts of Vietnam (see Figure 6 and Appendix Figure D2). This is striking, as historical accounts of the period describe the bankruptcies of several French firms in Indochina (Brocheux and Hémery 2001; Brocheux 2009). While income tax
30 See also the discussion in section 3 about tax deductions for family charges in Algeria, whose reintegration would put Algeria significantly above South Africa in the 1930s.
31In 1932 France, the top 10% share is 2.9 times the top 1% share. Cogneau, Dupraz and Mesplé-Somps (2018, Appendix I) estimate the total income share of Europeans at 64% in 1925.
32 In 1943, exports from the two colonies went down to less than 10% of their value in 1942. Cogneau, Dupraz and Mesplé-Somps (2018) estimate that GDP per capita decreased by around 20% between 1938 and 1945, both in Algeria and Tunisia. The estimate for France is a 25% decrease.
18
tabulations indeed show a decrease in the average income of European taxpayers, in nominal terms and even in real terms (despite deflation), this decrease is much less pronounced than the fall of GDP in Bassino’s (2000) estimates. Poor Vietnamese rice producers may have suffered even more than European businesses from the collapse in rice prices and exports. The same explanation could hold for India where the top 0.1% share also increased significantly during the first half of the 1930s, although to a lesser extent.
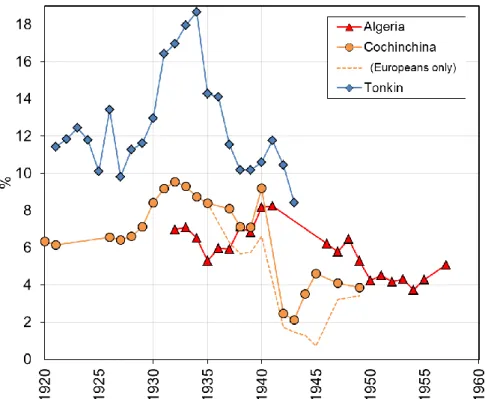
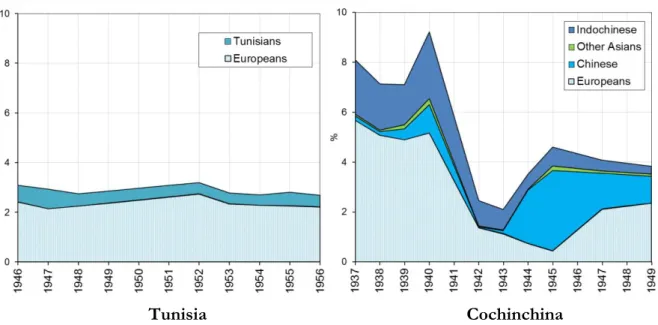
Figure 6. Top 0.1% income share in Cochinchina and Tonkin, 1920 to 1949
Sources: Table 2A (Algeria) and authors’ calculations (Cochinchina and Tonkin).
Notes: Due to the small number of taxpayers, the 0.1% income share cannot be computed for Annam (Center Vietnam).
Data for Cochinchina (South-Vietnam) allow us to extend the top 0.1% estimation to 1949 (Figure 6). In 1921, the top 0.1% share for this single colony is below that of the whole Vietnam (i.e. 6% against 8%), and is much lower than that of the poorer Tonkin (around 12%), which it
remains so throughout the 1920s and 1930s.34 The share in Cochinchina then abruptly falls from
around 8% in 1937-1940 to 2.1% in 1943, and stabilizes at around 4% between 1944 and 1949. The beginning of a drop is also observed for Tonkin in 1943. After 1943, the economy of Cochinchina collapsed. In March 1945, the Japanese army took hold of Saigon, and the Vietminh rebel forces entered into action; famine and epidemics spread, Europeans fled. Between 1939 and
34 These results are at odds with the low Gini coefficients from Milanovic (2018, p. 1033) where Cochinchina (36.8) appears more unequal than Tonkin (25.6) in 1929. The social tables and Gini coefficients are supposed to come from Merette (2013a), yet in her paper the Gini coefficients are higher and closer (39.0 and 38.6 respectively), even if they are just a little bit higher than the Gini coefficient of 35.6 for Vietnam in 2008 cited by Merette (2013a), after a few decades of socialism. Both authors provide little clue as to their calculations. Besides, in Milanovic (2018) Cochinchina’s GDP per capita is just 40% higher than in Tonkin, whereas in our data, Cochinchina is almost three times above, like in Merette (2013a, b), who also used Bassino’s (2000) estimates.
19
1945, the number of European taxpayers in Cochinchina fell by 30%, and not many came back; in 1949, they still counted for 28% less than the 1939 numbers. But the income of those who remained also fell. Cogneau, Dupraz and Mesplé-Somps (2018, Appendix II) show that the average real wage of European civil servants fell by 60% between 1925 and 1945, due to inflation; those civil servants represented more than one third of employed Europeans, even excluding army men. In colonial India, the top 0.1% share also fell during WWII, although much less so, from 7.5% in 1940 to less than 5% in 1945, in particular because India was less impacted by warfare; like in Vietnam, the share never went back to pre-war levels, neither before independence in 1947 nor even after. In contrast, and much like in South Africa, the top shares peaked in the late 1940s in Zambia and Zimbabwe, due to the mining boom; it is only in the 1950s that they converged to the levels reached by the other colonies, and finally broke with the high pre-war levels.
To summarize, colonies displayed higher levels of income concentration than the mainland. During the Great Depression, and in contrast to France or the United Kingdom, top income shares did not fall (Algeria, South Africa), and in some cases they even increased (Vietnam, India, Zimbabwe). After World War II, and once the impact of the boom in mineral prices had faded away in British Austral Africa, inequality stabilized to levels much lower than before, although still significantly higher than in the metropoles.
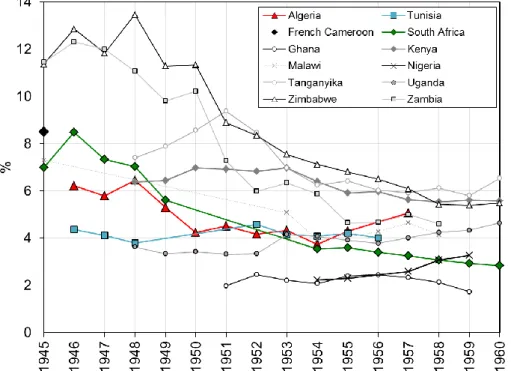
Figure 7. Top 0.1% income share in French and British colonies and dominions 1945-1960
Sources: Table 2A (Algeria), Table 2B (Tunisia), Table 2C (French Cameroon), Table 2D (Indochina), Alvaredo and Atkinson, 2010 (South Africa), Atkinson 2014, 2015a, b, c (Ghana, Malawi, Tanganyika, Zimbabwe, Kenya, Nigeria, Uganda, Zambia).
While inequality was higher in colonies, this does not mean that top-income earners were as rich as their mainland counterparts (i.e. in the same overall top quantile). The two North African
20
colonies were four to five times poorer than France in the 1950s (Figure 5), yet their top 1% shares were “only” 50% higher, meaning that the average income of top 1% earners in the colonies was 30 to 50% that of the top 1% in the metropole. In other words, by 1955 the average income of the top 1% rather corresponded to the average income of the top 10% in France. In both 1921 and 1932 in Vietnam, the top 0.1% earned on average the mean income of the top 4% or 5% in France. The same was true of Cameroon in 1945. The South African elite were more affluent. In the 1950s, the average income in South Africa was half that of the UK at market exchange rates, and the mean income the top 1% earners in South Africa was 75% of the mean income of the British top 1%.
The comparison of top 0.1% shares (Figure 2) would also suggest that inequality was not systematically different in settlement colonies like Algeria or South Africa compared to colonies where the Europeans only represented a very small minority, like Vietnam, or India. In the second half of the 1930s, the top 0.1% share is between 7 and 8% in these four colonies. In the late 1950s, it lies between 4 and 5%. Figure 7 displays the top 0.1% shares for another set of British African colonies between 1945 and 1960. Once again, in the late 1950s, the highest top shares (above 5%) are those of Kenya, Tanganyika and Zimbabwe, while the lowest shares (below 4%) are those of Ghana, Nigeria and South Africa. It is hard to discern any patterns linked to the presence of Europeans.
To shed more light on the comparison of top-income earners, both between colonies and the metropoles and within colonies, we must dig further into the composition of these groups in terms of citizenship and ethnicity.
Let us more formally portray how Europeans and autochthons enter the colonies’ income distribution. The top p% share reads
𝑆𝑝 = 𝑝.𝑦̅𝑝
𝑦̅ (1)
Where 𝑦̅𝑝 and 𝑦̅ reflect, respectively, the average incomes of the top p% richest and the colony
average income. The average income 𝑦̅ combines the average income of Europeans (𝑦̅𝑒) and of
autochthons (𝑦̅𝑎)
𝑦̅ = 𝜀𝑦̅𝑒+ (1 − 𝜀)𝑦̅𝑎 = [𝜀 + (1 − 𝜀)/𝛿]𝑦̅𝑒 (2)
where 𝜀 is the share of Europeans in the total population of tax units, and 𝛿 is the Europeans to autochthons average income ratio, which our data cannot not capture because it focuses on top
income earners. Likewise, the average income 𝑦̅𝑝 combines the average income of Europeans and
of autochthons
𝑦̅𝑝 = 𝜀𝑝𝑦̅𝑝𝑒+ (1 − 𝜀
𝑝)𝑦̅𝑝𝑎 = [𝜀𝑝+ (1 − 𝜀𝑝)/𝛿𝑝]𝑦̅𝑝𝑒 (3)
where 𝜀𝑝 is the share of Europeans in the top p%. If p is small, we can expect 𝛿𝑝 to be close to 1,
as rich autochthons and Europeans gathered at the top of the income distribution should not differ too much in terms of average income. By knowing the ethnic composition of the top p%,
i.e. of 𝜀𝑝, we can find out to which top q% among Europeans it corresponds to
21
Among Europeans, the top share of the q% richest then reads 𝑆𝑞𝑒 = 𝑞.𝑦̅𝑞
𝑒𝑒
𝑦̅𝑒 = 𝑞.
𝑦̅𝑝𝑒
𝑦̅𝑒 (5)
Where 𝑦̅𝑞𝑒𝑒 is the average income of the top q% Europeans among Europeans, equal to 𝑦̅𝑝𝑒 by
definition. 𝑆𝑞𝑒 can only be known when we have separate income tax tabulations for Europeans,
and when we can make a safe calculation of the average income of Europeans, like in Cameroon and Vietnam (see next section).
Combining all terms yields
𝑆𝑝 = 𝜀 𝜀𝑝 𝜀𝑝+ (1 − 𝜀𝑝)/𝛿𝑝 𝜀 + (1 − 𝜀)/𝛿 . 𝑆𝑞 𝑒 (6)
The top p% share is the product of 𝑆𝑞𝑒, which measures inequality among Europeans in the
colony, and of a first term that combines the between-group inequality (𝛿), and the inequality
among non-Europeans. When 𝜀𝑝 = 1 the European and autochthon distributions do not overlap
at the top, either because autochthons are not liable (their incomes are not reported, as in Vietnam before 1937), or else because the richest autochthons are too poor to enter the top p% (as in Cameroon or South Africa as we will see).
The next sub-section looks for autochthons at the top of the colonial income distributions. Sub-section 5.3 then analyzes the inequality among Europeans, within colonies, and between the colonies and the metropoles.
22
Top 1% Top 0.5% Top 0.1% Top 0.05% Top 0.01%
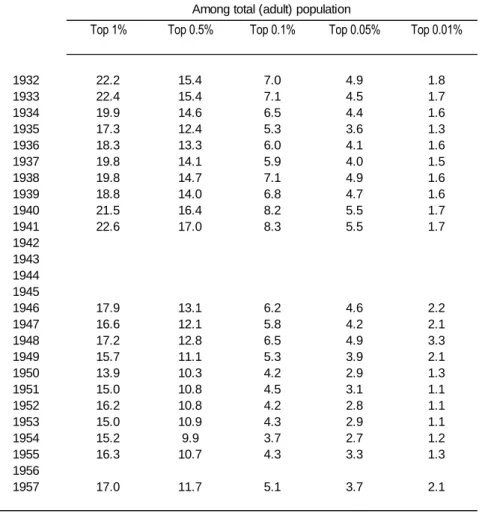
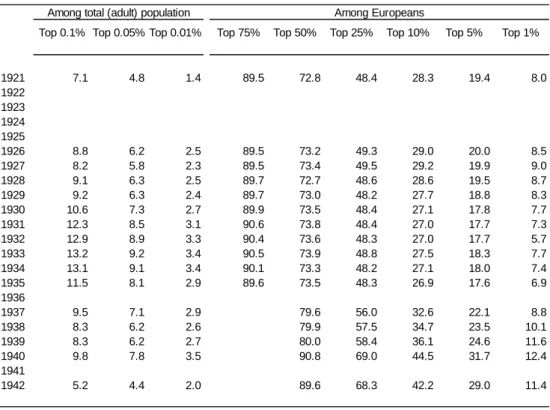
1932 22.2 15.4 7.0 4.9 1.8 1933 22.4 15.4 7.1 4.5 1.7 1934 19.9 14.6 6.5 4.4 1.6 1935 17.3 12.4 5.3 3.6 1.3 1936 18.3 13.3 6.0 4.1 1.6 1937 19.8 14.1 5.9 4.0 1.5 1938 19.8 14.7 7.1 4.9 1.6 1939 18.8 14.0 6.8 4.7 1.6 1940 21.5 16.4 8.2 5.5 1.7 1941 22.6 17.0 8.3 5.5 1.7 1942 1943 1944 1945 1946 17.9 13.1 6.2 4.6 2.2 1947 16.6 12.1 5.8 4.2 2.1 1948 17.2 12.8 6.5 4.9 3.3 1949 15.7 11.1 5.3 3.9 2.1 1950 13.9 10.3 4.2 2.9 1.3 1951 15.0 10.8 4.5 3.1 1.1 1952 16.2 10.8 4.2 2.8 1.1 1953 15.0 10.9 4.3 2.9 1.1 1954 15.2 9.9 3.7 2.7 1.2 1955 16.3 10.7 4.3 3.3 1.3 1956 1957 17.0 11.7 5.1 3.7 2.1
Table 2A. Algeria. Shares of income of top groups 1932-1957
per cent
Among total (adult) population
Top 1% Top 0.5% Top 0.1% Top 0.05% Top 0.01% Top 10% Top 5% Top 1% Top 0.5% Top 0.1% Top 0.05% Top 0.01% Top 1% Top 0.5% Top 0.1% Top 0.05% Top 0.01%
1946 13.1 9.5 4.4 3.1 1.3 31.3 22.8 10.2 7.2 3.0 1.9 0.7 2.8 2.1 1.0 1947 13.5 9.4 4.1 2.9 1.3 31.9 22.0 9.2 6.3 2.6 1.7 0.8 6.0 3.1 2.3 1.2 1948 11.1 8.0 3.8 2.7 1.2 26.9 19.3 9.0 6.6 2.9 2.2 1.5 4.4 2.2 1.6 0.8 1949 1950 1951 1952 14.5 10.4 4.6 3.2 1.3 34.6 24.8 11.0 7.7 3.1 2.1 1.3 5.6 2.6 1.8 0.8 1953 14.1 10.0 4.1 2.8 1.1 32.9 23.4 9.8 6.6 2.5 1.7 0.9 6.0 2.7 1.8 0.7 1954 14.1 9.9 4.1 2.7 1.0 33.0 23.2 9.6 6.5 2.5 1.6 0.9 5.7 2.6 1.8 0.6 1955 15.0 10.4 4.2 2.8 1.1 34.5 23.9 9.6 6.4 2.5 1.7 1.0 9.0 6.5 3.0 2.0 0.8 1956 13.5 9.6 4.0 2.7 1.0 30.9 22.1 9.2 6.2 2.4 1.6 0.9 8.1 5.9 2.7 1.8 0.7
Table 2B. Tunisia. Shares of income of top groups 1946-1956
Among total (adult) population Among Europeans Among Tunisians-non Europeans
23
5.2 Were there non-Europeans among the rich?
One unsurprising characteristic of the concentration of income in territories under colonial rule is that most members of the top groups were Europeans. In Kenya and Tanganyika in 1949, Atkinson (2014) shows that Europeans made up 73 and 74% of taxpayers, respectively. The remaining fraction was not necessarily composed of Africans, for these colonies also had significant Asian, and in particular Indian, minorities. The relatively large size of the Indian community also explains why Europeans only made up 50% of taxpayers in Uganda in 1949. In Ghana, in 1951, and Nigeria in 1957, the shares of Europeans reached 70 and 79%, respectively, while the shares of Africans were 18% and 14%, the rest being from India or the Middle East (Atkinson 2015a). Furthermore, the proportion of Europeans in the upper range of the income
distribution (𝜀𝑝 in the notations introduced above) is often likely to surpass the fraction of
Europeans in the taxpaying population as a whole. Alvaredo and Atkinson (2010) show that in South Africa in the late 1950s, when the breakdown of taxpayers by race becomes available, the
Top 0.5% Top 0.1% Top 0.05% Top 0.01% Top 50% Top 25% Top 10% Top 5% Top 1%
1945 11.1 8.5 5.9 2.2 79.8 53.6 30.9 20.2 7.1
Among total (adult) population Among Europeans
Table 2C. Cameroon. Shares of income of top groups 1945
per cent
Top 0.1% Top 0.05% Top 0.01% Top 75% Top 50% Top 25% Top 10% Top 5% Top 1%
1921 7.1 4.8 1.4 89.5 72.8 48.4 28.3 19.4 8.0 1922 1923 1924 1925 1926 8.8 6.2 2.5 89.5 73.2 49.3 29.0 20.0 8.5 1927 8.2 5.8 2.3 89.5 73.4 49.5 29.2 19.9 9.0 1928 9.1 6.3 2.5 89.7 72.7 48.6 28.6 19.5 8.7 1929 9.2 6.3 2.4 89.7 73.0 48.2 27.7 18.8 8.3 1930 10.6 7.3 2.7 89.9 73.5 48.4 27.1 17.8 7.7 1931 12.3 8.5 3.1 90.6 73.8 48.4 27.0 17.7 7.3 1932 12.9 8.9 3.3 90.4 73.6 48.3 27.0 17.7 5.7 1933 13.2 9.2 3.4 90.5 73.9 48.8 27.5 18.3 7.7 1934 13.1 9.1 3.4 90.1 73.3 48.2 27.1 18.0 7.4 1935 11.5 8.1 2.9 89.6 73.5 48.3 26.9 17.6 6.9 1936 1937 9.5 7.1 2.9 79.6 56.0 32.6 22.1 8.8 1938 8.3 6.2 2.6 79.9 57.5 34.7 23.5 10.1 1939 8.3 6.2 2.7 80.0 58.4 36.1 24.6 11.6 1940 9.8 7.8 3.5 90.8 69.0 44.5 31.7 12.4 1941 1942 5.2 4.4 2.0 89.6 68.3 42.2 29.0 11.4 Among total (adult) population Among Europeans