Constitutive Model of Aligned Carbon Nanotube/Nafion
Nanocomposite Ionic Electroactive Polymer Actuators
by
Douglas S. Jacobs
B.S.E., Electrical Engineering
University of Michigan (2009)
Submitted to the Department of Mechanical Engineering
in partial fulfillment of the requirements for the degree of
Master of Science in Mechanical Engineering
at the
MASSACHUSETTS INSTITUTE OF TECHNOLOGY
February 2016
c
Massachusetts Institute of Technology 2016. All rights reserved.
Author . . . .
Department of Mechanical Engineering
January 15, 2016
Certified by . . . .
Brian L. Wardle
Professor of Aeronautics and Astronautics
Thesis Supervisor
Certified by . . . .
Sang-Gook Kim
Professor of Mechanical Engineering
Thesis Reader
Accepted by . . . .
Rohan Abeyaratne
Quentin Berg Professor of Mechanics
Chairman, Department Graduate Committee
Constitutive Model of Aligned Carbon Nanotube/Nafion
Nanocomposite Ionic Electroactive Polymer Actuators
by
Douglas S. Jacobs
Submitted to the Department of Mechanical Engineering on January 15, 2016, in partial fulfillment of the
requirements for the degree of
Master of Science in Mechanical Engineering
Abstract
Research is progressing rapidly on composite nano-structured materials, including aligned carbon nanotube (A-CNT) polymer nanocomposites (PNC), and with device construction utilizing these novel materials. However, the material constitutive relations of the PNCs and tailoring of these is lagging. In this work, A-CNT and Nafion PNC electrodes are manufactured and investigated as the key active element in ionic-electroactive polymer (i-EAP) devices. i-EAP actuators are known to create relatively large strains with low input voltages, and could therefore be used for future high-strain actuation mechanisms such as synthetic muscles, microfluidic drug delivery, or low-frequency energy harvesting. Tailor-ing the PNC is accomplished by process control and movTailor-ing to higher volume fraction (Vf) A-CNTs, in order to increase both the rate and magnitude of strain through increased non-isotropy and specific surface area for ionic transfer efficiency. This work shows methods to increase the A-CNT synthesis yield from below 50% to ∼90%, while keeping quality and morphology stable. Porous A-CNT based i-EAP electrodes are synthesized with CNT and Nafion volume fractions of 10-40% and 10-25%, respectively. Key elements of the non-isotropic mechanical, electrical and electroactive constitutive law are discussed and calculated for different morphologies of the electrodes. Tailored high Vf i-EAP devices at ±3 V show ±4,130 microstrain in the transverse direction and an order of magnitude smaller strain (±420 microstrain) in the CNT axis direction, with A-CNT and Nafion Vfs of ∼20% and ∼15%, respectively. These large non-isotropic strains correspond to elec-troactive coupling coefficients of 7.1 x 10⁻¹² m/V in the transverse direction and 7.2 x 10⁻¹³m/V along the CNT axis. In addition, the i-EAP material’s moduli are measured to be ∼85 MPa in the CNT axis direction and ∼50 MPa in the transverse direction, with a relative dielectric permittivity of 79, for this polymeric based i-EAP device. These coef-ficients constitute the first assembly of mechanical, electrical and electroactive properties into a constitutive relation for such an active nano-structured material. More extensive data sets for completing the full constitutive model and reducing measurement uncertainty are recommended for future work.
Thesis Supervisor: Brian L. Wardle
Acknowledgements
I would like to acknowledge the following people who have helped not only make this re-search a reality, but turned it into a successful work and a fun journey. First, I would like to thank my adviser Professor Brian Wardle, who has been patient with my odd circum-stances while always providing insight and great advice in terms of how to tackle the many unforseen problems, and motivation for pushing the boundaries on CNT technologies. My first postdoctoral adviser at MIT, Dr. Noa Lachman, for working with me on how to suc-cessfully and effectively conduct research, as well as how to keep my tools and workspace clean. I would also like to thank Dr. Sunny Wicks for teaching me the finer details in creat-ing PNCs, after I had many failures to cure bubble free PNC samples; Rich Li for assistcreat-ing me with many processes in the lab and to collect the TGA data; Diana Lewis who has taught me a lot about the CVD process and A-CNT forest growth; Itai Stein for teaching me La-TeX which this thesis is written in; Dale Lidston for keeping the 1” furnace going when I am not around, reviewing this thesis, and for the biltong; Dr. Estelle Cohen for her expert TEM and SEM imaging used in this work; Mackenzie Devoe for her work on the Raman spectroscopy; Dr. Bharath Natarajan and the National Institute of Standards and Technol-ogy (NIST) team for attempting the first ever quantitative 3-D electron tomography of the Nafion PNC samples, as well as SEM and TEM imaging; the Pennsylvania State Univer-sity Zhang Research Group including Dr. Mehdi Ghaffari and Professor Q. M. Zhang for sharing the processing and definition for the i-EAP manufacturing and collaborating; Luiz Acauan and Yue Zhou for their time spent reviewing this thesis; Amy Tatem-Bannister and Dr. Steven Kooi at the MIT Institute for Soldier Nanotechnologies (ISN) for the lab usage and hospitality, specifically for the use of the glove box, potentiostat and Zwick equipment; and the necstlab at MIT for providing a fun and challenging environment for completing
advanced research. In addition, this work would not be possible without the Aero Astro and Mechanical Engineering departments at MIT, and the GE Aviation Edison and ACE programs who have supported this research. Last but most importantly, I would like to ex-press my appreciation and love for my fiance Emily Altman, for providing moral support, love, and helping me to fix my many grammatical mistakes. Thank you to everyone on this list who has made this thesis possible!
Table of Contents
1 Introduction 27
1.1 Aligned Carbon Nanotube Nafion Nanocomposite Ionic Electroactive
Poly-mer Actuators . . . 28
1.2 Thesis Outline . . . 29
2 Background 31 2.1 Electroactive Polymer Materials and Applications . . . 31
2.2 Aligned Carbon Nanotube Composites . . . 35
2.2.1 Carbon Nanotubes . . . 35
2.2.2 Aligned Carbon Nanotube Polymer Nanocomposites . . . 38
2.3 Nano-structured Ionic Electroactive Polymer Materials . . . 41
2.4 Materials . . . 43
2.4.1 Nafion Polymer . . . 43
2.4.2 Ionic Liquids and Solvents . . . 44
2.4.3 Dimethylformamide . . . 46
2.5 Electroactive Polymer Challenges and Literature Gaps . . . 46
3 Objectives and Approach 49 4 Experimental 51 4.1 Aligned Carbon Nanotube Synthesis . . . 51
4.1.1 Chemical Vapor Deposition Processing . . . 51
4.1.3 Biaxial Densification . . . 55
4.2 Growth Enhancements for High Yield 1 mm Tall Aligned Carbon Nanotube Samples . . . 56
4.2.1 Catalyst Ripening and Furnace Overshoot . . . 57
4.2.2 Humidity and Water Usage . . . 59
4.2.3 Forest Height Control . . . 61
4.2.4 Wafer Positioning . . . 62
4.2.5 Summary of Growth Conditions . . . 62
4.3 Polymer Nanocomposite Fabrication . . . 63
4.3.1 Nafion Solution Preparation . . . 64
4.3.2 Nafion Infusion . . . 64
4.3.3 Annealing Process . . . 67
4.3.4 Airbrush Speckling . . . 70
4.4 Electroactive Polymer Nanocomposite . . . 72
4.4.1 Ionic Liquid Preparation . . . 72
4.4.2 Ionic Liquid Infusion . . . 76
5 Results 79 5.1 Growth Enhancements and Aligned Carbon Nanotube Characterization . . 80
5.1.1 Process Enhancement . . . 80
5.1.2 Scanning Electron Microscopy . . . 83
5.1.3 Transmission Electron Microscopy . . . 84
5.2 Polymer Nanocomposite Characterization . . . 85
5.2.1 Thermogravimetric Analysis . . . 85
5.2.2 Scanning Electron Microscopy . . . 87
5.2.3 Transmission Electron Microscopy . . . 93
5.3 Electroactive Polymer Device Characterization . . . 96
5.3.1 Electrical . . . 97
5.3.2 Digital Image Correlation . . . 104
5.3.4 Electroactive . . . 113
5.4 Constitutive Model . . . 121
5.4.1 Model Derivation . . . 122
5.4.2 Ionic Electroactive Polymer Device Constitutive Model . . . 124
6 Conclusions and Recommendations 127 6.1 Aligned Carbon Nanotube Contributions . . . 127
6.2 Ionic Electroactive Polymer Device Contributions . . . 128
6.3 Recommended Further Research . . . 129
6.3.1 Material and Device Processing Techniques . . . 129
6.3.2 Recommended Property Studies . . . 131
A Final A-CNT Growth Procedure and Recipe 133
B Full Summary of Devices Manufactured 137
List of Figures
1.1 A-CNT and PNC local material axes, with x axis parallel to A-CNT aligned direction. . . 29
2.1 Parker’s flexible electroactive polymer sensor and actuator products, de-rived from technology developed at Artificial Muscles, Inc. . . 33 2.2 Electroactive polymer bending actuator, with (a) no voltage applied in the
initial condition with no strain and (b) in a strained state with voltage ap-plied. This shows the method of strain based on excess ion concentrations towards the positive cathode and negative anode electrodes, as well as to-wards the positively and negatively charged electronic fillers. . . 34 2.3 A-CNT growth process, showing ripening, initiation and self aligned
ver-tical growth stages. Includes SEMs of growth morphology of up to 5 mm tall CNTs, 2-3 walls thick grown at atmospheric pressure. . . 36 2.4 A-CNT nano-indentation curves showing loading and unloading curves of
force and displacement, for both the spherical and Berkovich tips on 10% Vf and 20% Vf samples. The modulus is calculated from the unloading curve, which is generally more consistent but also larger than the compres-sive loading modulus. . . 37 2.5 Plots of full non-isotropic constitutive model of A-CNT epoxy PNC
sam-ples across various A-CNT Vfs. The transverse (y) modulus, shear mod-ulus and Poisson ratios do not vary significantly with A-CNT Vf, but the modulus in the direction of the A-CNT varies linearly with Vf. . . 39
2.6 Four A-PNC samples characterized using 3D quantitative electron tomog-raphy from FIB-TEM imaging. Left series shows CNT direction by color for calculation of alignment, and the right series shows the measured Vf. . . 40 2.7 Thickness actuator setup, including positive and negative A-CNT and Nafion
electrode based i-EAP devices in a pool of ionic liquid. Potentiostat setup provides actuation potential, and small yellow anions and large red cations are shown reacting to this voltage. The axes are defined such that the di-rection of the CNTs is the x didi-rection with the y and z didi-rections isotropic. . 42 2.8 Structural formula for DuPont Nafion, showing teflon backbone and acidic
sulfonic group side chains. . . 44 2.9 Structural formula of BMI-BF4 ionic liquid. . . 46 2.10 BMI-BF4 cyclic voltammogram across moisture levels showing impact to
ECW. Largest ECW is vacuum dried, followed by atmospheric, and then wet at 298◦K, 318◦Kand 338◦K. . . 46 2.11 Suggested characterization properties of significance for EAP materials
from Bar-Cohen et al. 2001. Some of these have been investigated, but many assume full isotropy or remain unknown. . . 47
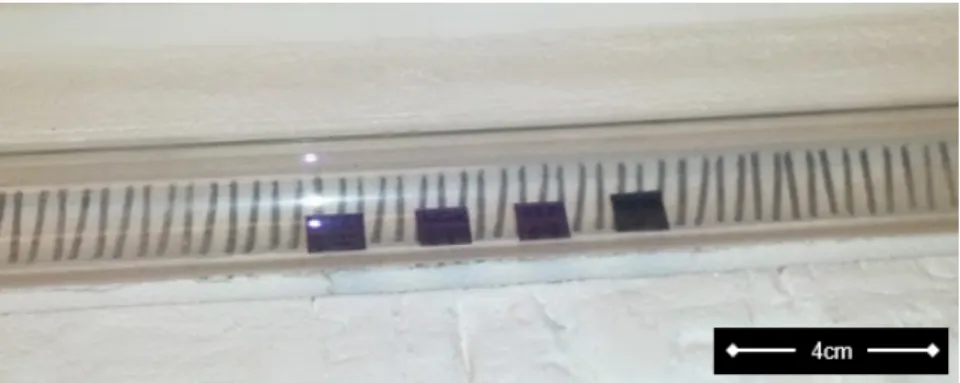
4.1 CVD furnace with 1” diameter tube for growing tall A-CNT forests, lo-cated in fume hood on MIT building 35. Includes helium, hydrogen and ethylene inlet lines, mass flow controllers, 1” quartz tube, water bubbler, exhaust bubbler, pre-heater furnace, main furnace, and locating marks for placement consistency. . . 53 4.2 Quartz tube loaded with four 1 cm growth wafer chips at -2, 0, 2 and 4 cm
positions. . . 53 4.3 CNT densification station, including densifier jig fixture, tools and
anti-static mat. The anti-anti-static mat and wrist strap remove the issue of the A-CNT samples statically clinging to the metallic tools. . . 56
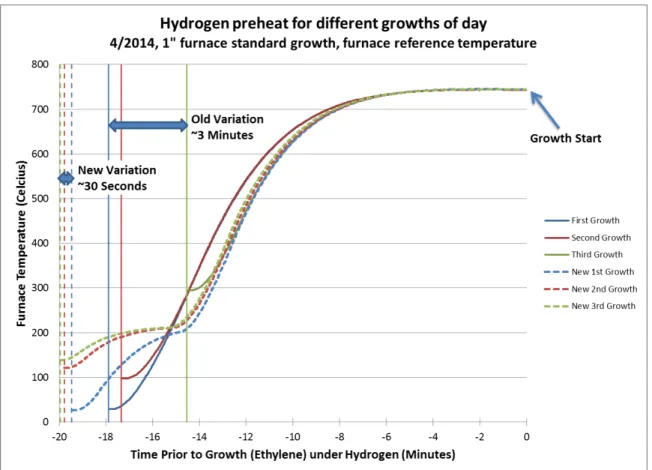
4.4 Temperature variation from the actual growth zone inside the quartz tube to the reference furnace thermocouple over a standard growth thermal profile. There is a large internal temperature overshoot, as well as the temperature takes a very long time to fully stabilize. The actual growth temperature is near 800◦Cversus the set point of 740◦C. . . 58 4.5 Furnace thermal ramp rate variation of old and new growth control
meth-ods, showing reduced variation in catalyst pretreatment for consecutive growths. . . 59 4.6 Effects of moisture on CNT growth quality, showing the ∼500 ppm (0.7
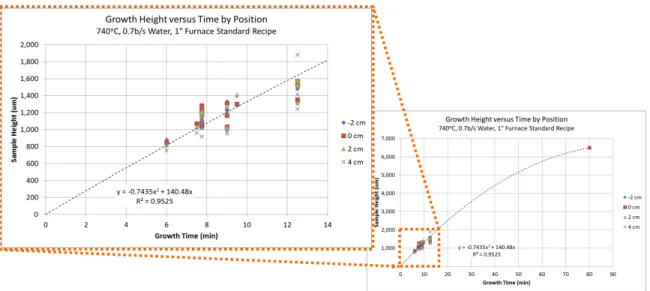
b/s) H2O used in the final growth recipe creates a similar CNT quality to the prior dry growth methods, as measured by Raman spectroscopy. Also, this shows that high water content, even for short durations, can negatively impact the growth quality and carbon composition. . . 60 4.7 Height control of CNT forest, showing almost linear dependency and no
stagnation up to over 6 mm heights. . . 61 4.8 Thermal profile of 1” furnace with ceramic insulator caps installed, no gas
flow, and forward end cap removed, using internal tube thermocouple. This shows a parabolic variation in temperature versus axial position from the center of the furnace. . . 62 4.9 Aluminum A-PNC infusion cage drawing, sized for 20% Vf and to fit
in-side 20 mL vials. . . 65 4.10 A-PNC infusion cage with A-CNT and silver epoxy, ready for second mesh
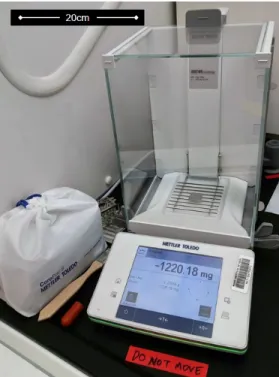
layer. . . 65 4.11 High accuracy Mettler Toledo scale used for A-CNT and Nafion mass
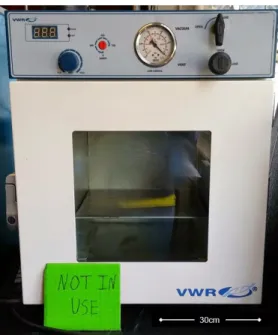
mea-surements, accurate to ∼0.02 mg. . . 66 4.12 VWR vacuum oven used in DMF evaporation. . . 67 4.13 Nafion batch infusion into A-CNT process, showing 16 caged CNT
sys-tems in 20 mL glass vials inside vacuum oven. Vials are filled with Nafion in DMF solution, with the high vapor pressure of DMF allowing for a slow and high quality infusion. . . 67
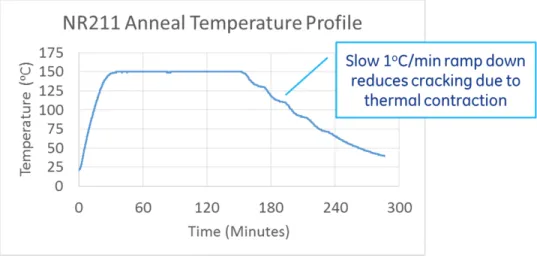
4.14 A-PNC anneal thermal profile at 150◦Cfor higher force to strain devices, with slow 1◦C/minute ramp down for reduced cracking. . . 68 4.15 Secador vertical drybox cabinet used for storage of moisture sensitive
ma-terials, including A-PNCs, Nafion, IL and silica gel (51.8 H x 34.1 W x 41.4 D cm). . . 68 4.16 Measured Nafion uptake into the A-CNT versus the goal of 40% across
various batches, showing the achieved batch average 40% uptake in the A-PNCs and increase in batch quality through reduced variation over time. In addition, studies have shown the current infusion level is near the single infusion limit. . . 69 4.17 A-CNT volume change during Nafion infusion, in Vf%, from original
pre-infusion A-CNT size. Low Vf samples show increase in Vf, suggesting capillary densification. Large Vfs show small variation from original pre-infusion Vf, showing cage successfully keeps A-PNC at similar sizes dur-ing infusion. . . 70 4.18 Airbrush setup used for speckling A-PNC devices inside fume hood for use
with DIC. Five dry A-PNC samples are shown at top of figure on an orange Post-It in order to not fly away during airbrushing. The airbrush tool is connected to a lab compressed air line through a regulator to set the correct pressure, and acetone is used to clean the airbrush to keep it from clogging. 71 4.19 Speckled A-PNC sample showing small high density speckling for high
resolution optical DIC. Image is taken facing down parallel with the CNT axis, x. . . 72 4.20 Ionic liquid two probe potentiostat testing setup, with positive (red)
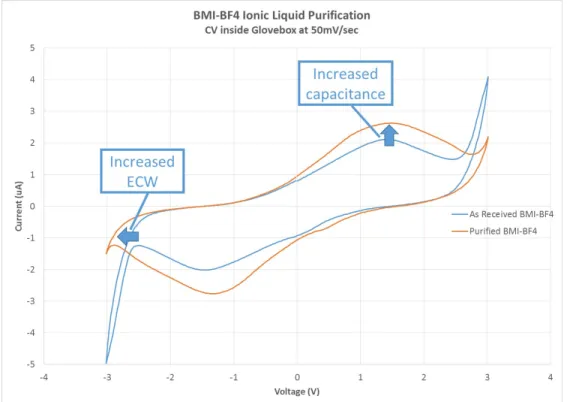
elec-trode and negative (black) elecelec-trode 3 cm apart in IL. Three axis microstages are used to accurately position the electrodes. . . 73 4.21 BMI-BF4 cyclic voltammogram, as received inside glove box versus after
one week of purification under strong vacuum. There is both an increase in the ECW and the capacitance after purification. . . 74
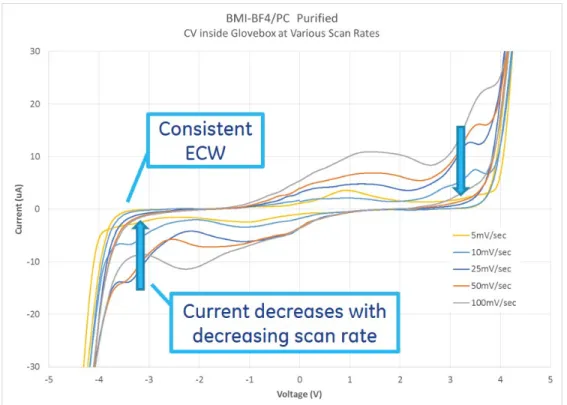
4.22 BMI-BF4/PC after purification and then 30 minutes in ambient, showing a small amount of exposure to moisture can modify the properties and reduce the ECW. . . 74 4.23 Cyclic voltammetry scan rate comparison, in BMI-BF4/PC after
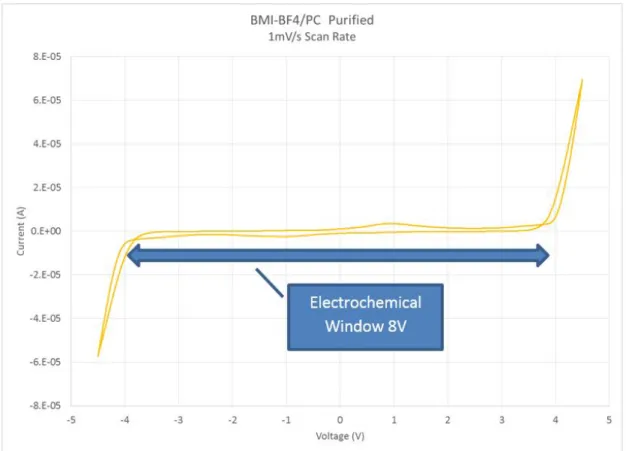
purifica-tion. Current varies with scan rate at constant capacitance, and ECW stays constant versus scan rate. . . 75 4.24 BMI-BF4/PC ionic liquid solution after purification measured at slowest
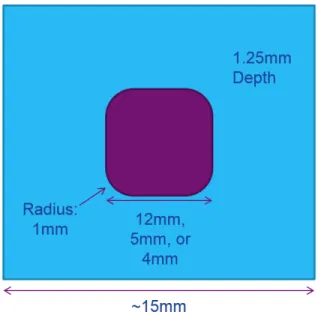
scan rate of 1 mV /second. A large 8 V ECW is shown. . . 77 4.25 Ionic liquid infusion mold drawing, for 12 mm, 5 mm and 4 mm wide trays
(purple area is recessed area for holing IL at A-PNC). . . 78 4.26 Ionic liquid batch infusion inside vacuum oven at 100◦Cand 10 millibar.
A-PNC samples situated in IL on teflon trays, placed inside glass petri dishes filled with silica gel. . . 78
5.1 A-CNT and A-PNC local material axes, with x axis parallel to A-CNT aligned direction. This is repeated from and identical to Figure 1.1. . . 79 5.2 A-CNT growth height variation versus ripening time difference from
orig-inal dry process to thermal profile controlled wet process, showing sta-bilized process in both time and height (note different time axes). Red squares are averages of each four sample growth batch, with blue diamonds showing the single samples. . . 81 5.3 Raman integrated intensity ratios of A-CNT samples positioned across the
inside of the furnace tube during a single growth, showing no significant difference in carbon composition and quality, with all ratios ∼1.0. Standard deviations shown are based on the five measurements across each sample. . 81 5.4 Height variation of A-CNT samples positioned across the inside of the
fur-nace tube, showing parabolic dependance on furfur-nace positioning. This data is based on growth batches of four to five samples at a time at various po-sitions. . . 82
5.5 SEM images of as-grown A-CNT sample’s side wall showing vertical align-ment and 1.18 mm height, acquired using 2 keV and courtesy of Dr. Noa Lachman (MIT). A-CNT waviness is also visible in the right image. Sam-ple 2014062711 grown in NW-14 using new wet growth procedure. . . 83 5.6 TEM of single CNT showing 4.5 nm inner diameter, 7.4 nm outer diameter
and 3 walls, acquired using JEOL 2100 at 200 keV , courtesy of Dr. Noa Lachman. . . 84 5.7 TGA of Nafion/A-CNT A-PNC and baseline samples of neat A-CNT and
pure NR211 Nafion. Sample 2014082212 shows around a 70% Nafion composition, compared to the estimation by weight of 61% (1.68 mg NR211, 2.17 mg A-CNT, 3.85 mg A-PNC). . . 86 5.8 Cross sections of 20% Vf A-PNC (sample ID2014070209) from the second
A-PNC batch, showing fairly uniform coating of Nafion on the A-CNT sur-face in the majority of the forest (∼96%). Areas closer to the edges and top, as shown on the left side of the top left figure, show higher excess Nafion in particle form. Also, since there is only a conformal coating around the densified CNTs, this agrees with the large void percentage predicted for the A-PNC. SEM images courtesy of Dr. Bharath Natarajan (NIST). . . 87 5.9 Edges of 20% Vf A-PNC (sample ID2014070209), showing Nafion crust
on the top surface of the A-CNT but with fairly uniform coating of Nafion in the majority of forest (∼96%). Images courtesy of Dr. Bharath Natarajan (NIST). . . 88 5.10 3 kV 5,000 times zoom SEM image of the center of a 19% Vf A-PNC
(sample ID2014101701), by cross section, courtesy of Dr. Estelle Cohen (MIT). The image shows the uniformity of the conformal Nafion coating, with excess Nafion particulate throughout the entire thickness of the forest. This agrees with the Nafion uptake measurements of batch 5 shown in Fig-ure 4.16, showing the increased and more consistent Nafion infiltration of these later batches. . . 89
5.11 SEM images of 19% A-PNC sample’s (sample ID2014101701) cross sec-tion with vertical alignment, with measured thicknesses shown in Table 5.2. Images courtesy of Dr. Estelle Cohen (MIT). . . 90 5.12 SEM images of 19% A-PNC sample’s (sample ID2014101701) cross
sec-tion with vertical alignment, showing uniform coating in interior of the A-PNC and crust of Nafion on the top, less aligned, growth initiation region. Images courtesy of Dr. Estelle Cohen (MIT). . . 90 5.13 SEM images of Penn State University A-PNC sample’s cross section with
vertical alignment, showing uniform coating in interior of the A-PNC and similar but thicker crust of Nafion on the top surface than seen with MIT samples above. Images courtesy of Dr. Estelle Cohen (MIT). . . 92 5.14 SEM of flawed A-PNC cross section courtesy of PSU showing non uniform
morphology and voids, courtesy of Dr. Estelle Cohen (MIT). . . 92 5.15 SEM of original high quality PSU A-PNC device cross section, with
uni-form Nafion coating and aligned CNTs. . . 93 5.16 SEM of new hexagonal crystalline Nafion structure seen around a single
CNT in the middle of the sample ID2014101701. These type of structures seem prevalent throughout the interior of the A-PNC, and likely formed during the Nafion infusion and annealing process. Image courtesy of Dr. Estelle Cohen (MIT). . . 94 5.17 TEM prepared by FIB method from 20% Vf PNC sample (ID2014070209)
showing high packing density of high volume fraction A-PNC and low contrast, courtesy of Dr. Bharath Natarajan (NIST). . . 95 5.18 TEM of 20% Vf A-PNC sample showing single CNT walls with conformal
Nafion coating, courtesy of Dr. Estelle Cohen (MIT). The CNT outer di-ameter is measured to be 9 nm, and the Nafion outer didi-ameter is measured as 14 nm, very similar to the SEM Nafion measurements and CNT TEM measurements. . . 96
5.19 Two electrode i-EAP setup with two new devices prior to electrical test-ing through the DIC camera (discussed subsequently). Camera images of device’s y-z plane. . . 98 5.20 Voltage application waveforms, showing -3 V to 3 V ramped waves at 5
mV/second scan rates. . . 99 5.21 Cyclic voltammetry measurement of i-EAP devices using the standard
tung-sten probe versus devices silver epoxied to copper tape. Samples ID2014082202 (positive) and ID2014082205 (negative) devices tested at 5 mV/s from -4 V to 4 V . . . 99 5.22 Cyclic voltammetry measurement of i-EAP devices using solvent only,
with the asymptotic DC response showing it takes ∼100 minutes to fully stabilize. Samples ID2014062702 (positive) and ID2014080801 (nagative) have tested under multiple DC voltages, as well as repeated AC cyclic tests. 100 5.23 Cyclic voltammetry measurement of i-EAP devices using only the PC
sol-vent under 30 cycles of ±4 V AC applied voltage. The average of the middle curves 15-17 is shown in the thicker blue line, with its calculated accumulated charge in the dotted orange line. The ripples seen in the single curves are attributed to the movement of the CNTs and the varying resis-tance to each other and the probe. . . 101 5.24 Cyclic voltammetry plot of i-EAP devices under a ± 3 V waveform at 5
mV/second, including calculated charge accumulation in the devices. . . . 102 5.25 Cyclic voltammetry plot of i-EAP device under a ± 3 V waveforms and
varying scan rates, showing specific capacitance of 115.3 F/g or 76.4 F/cm3, similar to prior non-coated CNT based supercapacitors. . . 103 5.26 Resolution of the digital image correlation (DIC) system, with each
cal-culation point (every 9th from the original image pixels) shown as white dots, overlayed on to the sample under test. The green area is the visual-ized strain from these calculated points. The 75 by 75 correlation window is shown in red. Strains shown that overlap the electrode are ignored. . . 105
5.27 Zwick compression platens used for compressive modulus testing with i-EAP device inside. A smaller top platen is sometimes used instead with DIC to allow for additional light on the sample. . . 107 5.28 Modulus calculation and toe correction method as specified in ASTMD695,
applied to linear portion of force versus applied strain curve. Strain in this figure is measured using the displacement measurement of the Zwick, on 19% Vf sample 2014082206 without IL (therefore the sample is an A-PNC with 19% A-CNTs Vf, 12% Nafion, and 69% voids by volume). . . 107 5.29 Strain measurement image on sample ID2015011701 using 2D DIC
sys-tem with f11 aperture and 10.5 µsecond acquisition speed during Zwick compression test, near 10% compression. White lines with boxes at each end are virtual strain gauges used in strain calculation. Taper in sample due to non-uniformity in densification and Vf causing uneven Poisson response during compression. . . 108 5.30 Compressive modulus versus volume fraction for various A-CNT samples
using both nano-indentation as well as full scale compression testing. . . . 109 5.31 Compressive modulus versus volume fraction for A-PNC systems, in
mul-tiple non-isotropic dimensions and mulmul-tiple A-PNC anneal temperatures (tested dry without IL). . . 111 5.32 Compressive modulus versus volume fraction for EAP samples in both the
x and y directions from batches 3-6. . . 111 5.33 Compressive modulus non-isotropy ratio versus volume fraction for the
same EAP systems as Figure 5.32, showing an increase in non-isotropy with higher Vfs. . . 113 5.34 Electroactive testing setup inside controlled glove box environment,
includ-ing DIC system, potentiostat and i-EAP samples. The glove box has special feed throughs for both the DIC camera’s Firewire and the electrical connec-tions for the electrodes to the potentiostat. . . 114
5.35 22% Vf i-EAP device (ID2014060801) using PC solvent electroactive strain, current, charge, power and voltage versus time for one average cycle, tested with 21% Vf positive electrode ID2014062702. . . 115 5.36 Electroactive strain versus applied voltage and accumulated charge for
i-EAP devices using only the solvent propylene carbonate. The dark orange, blue and green lines are a three cycle average from the middle of the cyclic test, and the strain starts the test at zero and increases over time. This negative electrode (ID2014060801) was tested with the positive electrode ID2014062702. . . 116 5.37 Electroactive strain versus power for i-EAP devices using only the solvent
propylene carbonate. This negative electrode was tested with the positive electrode ID2014062702. . . 116 5.38 i-EAP tested under ± 3 V waveform at 5 mV /second, showing 30 cycles
of applied voltage, measured current, calculated charge, calculated power and DIC calculated strains over time on samples ID2015073103 (19% Vf positive electrode) and ID2014102204 (27% Vf negative electrode). The stability in charge across the 30 cycles shows that the i-EAP devices are fully stabilized. . . 118 5.39 Electroactive strain versus applied voltage, current, accumulated charge
and power for i-EAP device ID2014102204 (27% Vf) using IL BMI-BF4/PC.118 5.40 Electroactive strain conditioning with 30 applied voltage cycles, showing
large and non-reversible strain greater than 120% on samples ID2015021303 (left positive electrode) and ID2015073102 (right negative electrode). . . . 119 5.41 Strain versus applied voltage, current, accumulated charge and power for
positive and negative electrode i-EAP devices using IL BMI-BF4/PC. The strain in the y and z axes are identical with a much smaller x axis strain, expected due to device symmetry. . . 119
5.42 Final conditioned positive i-EAP device strain in three axes versus voltage applied. Notice seemingly irregular response to voltage, but expected re-sponse to accumulated charge. This suggests the ionic distribution is in fact generating positive strain in both the positive and negative applied voltages. 120 5.43 Final conditioned negative i-EAP device strain in three axes versus voltage
applied. The positive applied voltage creates a larger strain on this negative electrode than with the same negative applied voltage, the opposite effect to that of the positive electrode (Figure 5.42), showing the impact of the larger cation than anion. This also suggests the ionic distribution is in fact generating strain, in both the positive and negative applied voltages. . . 120 B.1 Full list of devices used in this thesis, first through third batches. . . 138 B.2 Full list of devices used in this thesis, fourth through sixth batches. . . 139
List of Tables
5.1 Ion dimensions in popular ionic liquids. In this work, the BMI cation and BF4 anion are chosen since they have both very large and very small vol-umes respectively. This generates maximum strain with reduced strain re-laxation after applied voltages are removed. . . 45 5.1 As grown A-CNT diameters. . . 85 5.2 Measured Nafion coated CNT diameters. . . 91 5.3 i-EAP device composition for 40%Vf sample, ID 2015021302, with a total
volume of 4.49 mm3. *Calculated based on the other known data . . . 97 5.4 i-EAP device composition for 20%Vf sample, ID 2014101704, with a total
volume of 8.66 mm3. . . 97 5.5 20% i-EAP device constitutive model coefficients. . . 125 B.1 Definition of sample data list columns. . . 137
Abbreviations and Symbols
A-CNT Aligned Carbon Nanotube
A-PNC Aligned Polymer Nanocomposite
BMI-BF4 1-Butyl-3-Methylimidazolium Tetrafluoroborate
CNT Carbon Nanotube
CV Cyclic Voltammetry
CVD Chemical Vapor Deposition DIC Digital Image Correlation
DMF Dimethylformamide
DVB Divinylbenzene
EAP Electroactive Polymer
ECW Electrochemical Window
FIB Focused Ion Beam
i-EAP ionic-Electroactive Polymer
iCVD initiated Chemical Vapor Deposition
Ig/Id Integrated Raman Intensities Ratio of G and D Peaks
IL Ionic Liquid
IPMC Ionic Polymer Metal Composite MWCNT Multi-walled Carbon Nanotubes oCVD oxidative Chemical Vapor Deposition
PC Propylene Carbonate
PEM Proton Exchange Membrane
PNC Polymer Nanocomposites
RTIL Room Temperature Ionic Liquid SEM Scanning Electron Microscopy TEM Transmission Electron Microscopy TGA Thermogravimetric Analysis
ToF-SIMS Time-of-Flight Secondary Ion Mass Spectrometry
Vf Volume Fraction
∆V Voltage Range, V
εo Permittivity of Free Space, F/m
εr Relative Dielectric Permittivity
εik Electric Displacement Tensor, F/m
dV
dt Voltage Scan Rate, V /second
κ−1 Debye Length, m
τ Growth Time, minutes
A Effective PNC Area, m2
dikl Electroactive Tensor, m/V = C/N Di Electric Displacement, C/m2
e Elementary Charge, C
Ek Electric Field, V /m
Id Discharge Current, A
IM Ionic Liquid Molarity, mole/m3
kB Boltzmann’s Constant, J/K NA Avogadro’s Number, M−1
si jkl Elastic Compliance Tensor, m2/N
Si j Strain, m/m
TK Absolute Temperature, K
Tkl Stress, N/m2
x Cartesian frame for the local PNC material axes along the CNT axis y Cartesian frame for the local PNC material axes normal to the CNT axis z Cartesian frame for the local PNC material axes normal to the CNT axis
Chapter 1
Introduction
Today’s reliance on electrical automation is pushing the need for increased connections from the electrical to mechanical domains, utilizing transduction methods to complete tasks in a more powerful and efficient manner than ever previously imagined. Robotics, as well as biomimetic and prosthetic devices, require high energy density and low voltage sensors and actuators to effectively move and interact with the outside world[1–3]. In addition, scal-ability is key to forming devices such as synthetic muscles[4]. Similarly, energy harvesting materials are required for efficient distributed sensor concepts, which are envisioned every-where from roads and bridges to jet engines.
Ionic electroactive polymer (i-EAP) materials have shown promise to deliver on this front, but have yet to be fully characterized and proven in a controllable and consistent manner. These materials are polymer based and include free ions or electrolyte solutions that, by transport such as migration and diffusion in response to an applied electric field, physically strain[2]. These devices are generally made up of two electrically isolated elec-trodes filled with an ionic, electrolytic solution[2]. The term “device” is used in the litera-ture to usually describe an actuator or sensor configuration, but in this thesis the simplest i-EAP device is considered, which is comprised of the A-PNC soaked in an ionic liquid and connected to a counter electrode (usually another i-EAP “device”).
The recent investigation into i-EAP materials is due to their relatively high strain ca-pability, light weight, low voltage demands and damage tolerance[5]. Just a few volts of electricity have been shown to create large strains, showing the promise for safe, simple and
efficient device materials. Earlier versions of i-EAPs have used neat polymers which are conductive to ions, sometimes including conductive metal nanoparticles to increase con-duction efficiency. These early ionic polymer metal composites (IPMC) materials showed around 23-26 microstrain[6]. More recent studies have focused on alternate materials and tailored structural properties. For example, devices based on activated graphene oxide can generate strains as high as 560,000 microstrain (56%) with energy densities of 1.5 J/cc using only 4 V of electricity[1]. These devices still have limitations, however, such as low efficiencies, slow response times, moisture sensitivity, electrolytic requirements and a lack of constitutive model based understanding of the device materials[3,7,8].
1.1
Aligned Carbon Nanotube Nafion Nanocomposite Ionic
Electroactive Polymer Actuators
In order to advance the capabilities of i-EAP devices, research has focused on functionally integrating the polymeric devices with different conducting materials, such as metal elec-trodes or nanoparticles[2,6,9], graphene[1], and aligned carbon nanotubes (A-CNT)[3,10,11]. A-CNT materials have been utilized for their high conductivity, large surface areas, high non-isotropy, and low density, and have shown much promise to improving the energy density and speed of i-EAP devices[10,11].
Research in general is progressing rapidly on composite nano-structured materials, es-pecially on aligned carbon nanotube (A-CNT) polymer nanocomposites (PNC), and de-vice construction utilizing these novel materials[3,10,12–17]. These efforts are driven by the need to be able to tailor the multifunctional properties of materials to best optimize their weight and performance, for industries such as transportation and aerospace[17,18]. Lever-aging these advances in morphological processing, many new types of PNCs have been demonstrated with nano-structured characteristics and interfaces. Of particular interest is the non-isotropic conductivity and stiffness, as well as the large surface areas of A-CNTs utilized in PNCs, which can lead to larger strains, capacitance, or customizable resistances for applications such as heaters, supercapacitors, or i-EAP actuators[19]. In addition, due
to the multifunctional properties of A-CNT materials, these devices could one day provide a multitude of additional benefits such as heat shielding, structural support, and capacitive energy storage. For this thesis, the axes are defined based on the A-CNT orientation as shown in Figure 1.1.
Figure 1.1: A-CNT and PNC local material axes, with x axis parallel to A-CNT aligned direction.
1.2
Thesis Outline
This thesis thoroughly discusses the background, processing, morphologies, characteriza-tion methods, and constitutive relacharacteriza-tions of the novel i-EAP actuator electrode materials based on nano-structured A-CNT and Nafion materials. Moving beyond prior isotropic in-vestigations, the valued non-isotropy of the A-PNC materials will be considered, with mul-tiple stages of device processing characterized. The second chapter discusses the need for these materials with proposed applications, prior EAP materials, and A-CNT composites, as well as research gaps and challenges of the current EAP materials. The third chapter pro-vides the research goals and thesis objectives, and the approach for device manufacturing and characterization. Chapter 4 goes through the full device processing, from neat materials to final multi-material and nano-structured devices with dimensions that span many orders of magnitude. A large portion of this section is dedicated to the enhancement and control of processing, to maximize quality and repeatability. The 1 centimeter square A-CNT
ma-terial synthesis, including growth and densification from 1% up to 40% volume fraction (Vf), has been improved to provide almost 100% yield from the prior lower yield synthesis (i.e. A-CNT growth and densification), and has been characterized for morphology, quality, and consistency. A-PNC and EAP creation is also discussed with Nafion and ionic liquid infusion, respectively. Chapter 5 delves into device operation through visual, mechanical, electrical and electroactive characterization, showing the structure, morphology, stiffness, capacitance, permittivity, and electroactive properties. The last chapter, 6, summarizes this work and discusses what conclusions can be drawn, as well as recommends future work in the areas of A-CNT and i-EAP actuator research.
Chapter 2
Background
The electroactive polymer (EAP) material’s actuation and sensing capability is a phe-nomenon that has been studied in depth for over 20 years, due to its low density, mechanical flexibility, and high strain capability with low required voltages[5–7]. The materials have the additional benefit in that they are simple to process, however they still lack a fundamen-tal understanding of their actuation mechanisms, limiting their design and usage[2,6,20]. The potential applications for this technology range from actuators and sensors to energy harvesting technology, and simple devices have already been manufactured. In parallel, A-CNT materials and PNCs are an active area of research, promising non-isotropic mate-rial properties with both high mechanical strength and electrical conductivity[16]. Given the benefits of A-CNTs in polymer nanocomposites and hierarchical nano-engineered compos-ites, their introduction into EAP electrodes promises additional performance enhancement which has been demonstrated in initial work[10].
2.1
Electroactive Polymer Materials and Applications
Rapid progress has been made on EAP material and device designs in the past two decades, moving from only 23 microstrain[6]to over 500,000 microstrain[1], over a 4 order of mag-nitude increase. EAP materials were originally discovered in 1880 by Roentgen when in-vestigating a rubber band subjected to an electric field[7]. Their large strain response with low applied voltages makes EAP devices similar to natural biological muscles[7,21]. This
has created a wide field of biomimicry devices based on EAP materials, including poten-tial for artificial muscles, prosthetics, implants and biological inspired robots[7,21]. Other potential EAP actuators include active clothing[7], control and positioning actuators for conformal structures[5], smart material systems, and microelectromechanical systems[22]. Demonstrated EAP products include micro-actuator catheters[23], audio speakers, focus control for cameras in cellular telephones, miniature manipulators and grippers, active di-aphragms for pumps, dust wipers for space rovers, robotic fish and even blimp fins[7].
Many EAP materials can also be used as sensors or energy harvesting devices, gener-ating voltage when strained. Initially, it was assumed an EAP device might not strain since there shouldn’t be differential forcing of anions and cations, but testing has shown that a voltage is in fact produced across the device when bent[22]. It can be orders of magnitude less than the voltage required to create the same amount of strain in the material, since the method of generating the electric potential is due to a secondary effect of the geometrical displacement of internal ions creating effective dipoles[22].
Parker currently produces a full line of dielectric EAP sensors and actuators, using technology acquired from Artificial Muscles Incorporated in June of 2014 (example prod-ucts shown in Figure 2.1). Another company, Environmental Robots Inc. produces i-EAP based sensors and actuators for research and instructional purposes, and has demonstrated jellyfish free swimming motion, morphing antennas, flapping wings and artificial muscle fibers[24].
EAP devices can be divided into two categories, field-activated EAPs and ionic EAPs, which both have their advantages and disadvantages[7]. Field-activated EAP materials are soft polymers that have high dielectric breakdown voltages, which actuate when under high voltages from induced deformation at a molecular scale[7]. The i-EAP devices have the benefit of only requiring a few volts for actuation due to ion displacement, but do require electrolyte solutions or solvents to allow for this ionic mobility[7]. Also, since they rely on the diffusion or drift of ions, they can be slower than other types of electroactive materials[2]. The maximum strain of these devices correlates to the device capacitance, which shows that the strain is caused by the ionic mobility[20]. This relationship has been shown to be between 10 to 15 microstrain/C/m2, independent of material, across various
Figure 2.1: Parker’s flexible electroactive polymer sensor and actuator products, derived from technology developed at Artificial Muscles, Inc.[25].
i-EAPs[20]. This also suggests that the deformation is due to the charge build up at the two electrode interfaces, and is the reason for increasing both the capacitance and electrode surface area of i-EAP devices in order to increase their maximum strain.
The i-EAP devices are generally made up of a polymer backbone, positive and negative electrodes, a solvent for hydrating the device, and mobile ions that can migrate through the solvent. Early devices used neat polymers, gold or platinum electrodes and water, and had issues with short lifetimes due to the solvent evaporation[20].
The i-EAP strain is accomplished by drift and diffusion of relatively large ions in the solvent towards the electrodes, causing those regions to swell from the excess ions. In larger devices (over 20 µm thick) the ion movement can be dominated by diffusion based on relative ion concentrations, not the drift due to voltages[26]. This also means that thicker devices with have much slower strain rates, as the diffusion time constant is proportional to the square of the ion transport distance. Liu et al. was able to measure ion concentrations in an i-EAP sample using the time-of-flight secondary ion mass spectrometry (ToF-SIMS) method, showing both electrodes strain with excess ions[26]. The cathode however has a higher concentration of excess ions than the anode, and this differential causes the device to strain[26]. This strain mechanism is shown in Figure 2.2. If allowed to diffuse after a voltage is no longer applied, depending on the ion sizes, the device strain can relax to a lower strain magnitude, and sometimes even moves beyond the initial dimensions to create
a negative strain.
Figure 2.2: Electroactive polymer bending actuator, with (a) no voltage applied in the ini-tial condition with no strain and (b) in a strained state with voltage applied. This shows the method of strain based on excess ion concentrations towards the positive cathode and neg-ative anode electrodes, as well as towards the positively and negneg-atively charged electronic fillers[27].
The strain achieved in specific i-EAP devices has steadily increased over the years. In 2001, Bar-Cohen et al. used gold-electroded Flemion with tetra-nbutylammonium ions in water to achieve only 23 microstrain[6]. Akle et al. in 2005 was able to generate strains as large as 24,380 microstrain, with consistent strain response for over 250,000 cycles by
switching to ionic liquids (IL) and implanting ruthenium(IV) oxide (RuO2) powder
be-tween the Nafion and the gold foil electrodes[5]. Even rechargeable lithium battery cells have been tested as i-EAP actuators due to their similarity in structure, and Chin et al. achieved 30,000 microstrain when unloaded[28]. Newer materials such as Poly[(vinylidene difluoride)-co-(chlorotrifluoroethylene)](P(VDFCTFE)) and P(VDFCTFE) / poly (methyl-methacrylate) (PMMA) cross-linked blends have recently been tested, showing higher strains than Nafion with lower currents, and more efficient i-EAP materials[29]. Similarly, 265,000 microstrain can be generated using TFSI-doped polyprrole actuators[30].
2.2
Aligned Carbon Nanotube Composites
2.2.1
Carbon Nanotubes
Carbon nanotubes (CNT) are a recently discovered material, but are already being devel-oped into real world applications. Even though the quality and process control of most CNTs are still improving, the commercial capacity is already estimated to be as large as 5,500 tons per year in 2011[31]. An individual CNT has a very high elastic modulus of 1 T Pa, which ranks above steel and even silicon carbide[32].
Of interest to this research is one type of these known as aligned carbon nanotubes (A-CNT), with a specific collimated tube morphology that can be exploited to make highly non-isotropic structures and devices. The A-CNTs in this work are based on a standard rapid growth method developed in 2006 that creates 1 mm tall A-CNTs in about 15 min-utes[33]. These grow on an electron beam deposited catalyst of 1/10 nm Fe/Al2O3on (100)
150 mm silicon wafers (p-type, 1-10 Ohm/cm), and uses ethylene, hydrogen and argon at 750◦C[33]. The growth consists of six stages: system evacuation, catalyst ripening, growth initiation, high yield growth, delamination and cooling down. These stages of A-CNT growth are shown in Figure 2.3. This A-CNT growth process has been determined to pro-duce multi-walled carbon nanotubes (MWCNT) with outer diameters of around 8 nm, CNT to CNT spacing of 80 nm, and an average of 1010 CNT per cm2 [34,35]. This works out to a volume fraction (Vf) of ∼1% of A-CNTs by volume[34]. In addition, there are on average
between 3 to 7 walls, yielding a 5 nm inner diameter[33].
Figure 2.3: A-CNT growth process, showing ripening, initiation and self aligned vertical growth stages[33]. Includes SEMs of growth morphology of up to 5 mm tall CNTs, 2-3 walls thick grown at atmospheric pressure.
Studies on this process have investigated gas flow rates and the flow field[33], thermal profiles[33,34,36], humidity or moisture levels[37,38], and working pressures[34]. Water is a key variable, as Hata et al. shows a small controlled amount of water during growth of single walled CNT can create easy to delaminate 2.5 mm tall dense forests[37]. The water acts as a weak oxidizer removing amorphous carbon from the catalyst and both increasing the activity and lifetimes. Nessim at al. has generated in situ water vapor by injecting oxygen into the CVD process, consistently growing over 5 mm tall A-CNT forests[38].
Multiple methods have been attempted to investigate the detailed multi-scale properties from single carbon nanotubes to mm size A-CNT samples at various Vfs, including trans-mission electron microscopy (TEM), scanning electron microscopy (SEM), Raman spectra and nano-indentation. Cebeci at al. has used the Oliver and Pharr nano-indentation method with a spherical indenter tip to characterize average micro scale A-CNT moduli of various
Vfs, showing 8.9 MPa (1% Vf), 71.5 MPa (10% Vf) and 816 MPa (20% Vf)[39]. Also, the CNT to CNT spacing is measured using SEMs of 78 nm (1% Vf), 18.5 nm (10% Vf) and 10.3 nm (20% Vf)[39]. This predicts a highly non-linear increase in modulus at higher Vf of up to 600 times, moving from the nominal 1% Vf to 20%[39]. Raman shift spectra can show the defect concentration, and thus quality, of the A-CNT samples. Samples from the original necstlab 1 inch furnace setup at MIT in building 37 have shown an integrated Ra-man intensities ratio of the G and D peaks (Ig/Id) of ∼<1[40], on 1 mm tall A-CNT forests similar to what is used in this work. In the temporary necstlab 2 inch furnace setup at MIT in building NW-14, similar Raman intensity ratios are measured as ∼0.7, and shown to be similar across varying A-CNT heights up to 300 µm tall[41].
Figure 2.4: A-CNT nano-indentation curves showing loading and unloading curves of force and displacement, for both the spherical and Berkovich tips on 10% Vf and 20% Vf sam-ples[39]. The modulus is calculated from the unloading curve, which is generally more consistent but also larger than the compressive loading modulus.
The Oliver and Pharr method utilizes the unloading curve of the compression test shown in Figure 2.4, unlike the linear loading curves used in larger scale compression testing. In Figure 2.4 the loading curve can be seen as a lower modulus than the unloading curve, which is a closer comparison to large scale compression tests. It has been theorized that this measurement might be influenced by the stored energy in inter-tube forces and waviness, as well as the generated strain. In addition, the measured samples have been prepared
using a laser ablation method to create a flat surface for measurement, which on A-CNT materials could create a layer of amorphous carbon, which could then potentially stiffen the measured modulus. Bradford et al. shows that heat treating A-CNT foams does increase the modulus[42]. This shows that there could be a predicted difference versus full device scale compression testing completed in this work.
2.2.2
Aligned Carbon Nanotube Polymer Nanocomposites
The A-CNT material can be combined with epoxies and polymers to create similar struc-tures to fiber-reinforced plastics such as carbon fiber composites, but at a much smaller scale. These aligned polymer nanocomposite (A-PNC) materials show the promise of highly non-isotropic material properties with both high mechanical strength and electrical conductivity[16]. Integrating A-CNTs into aerospace grade structural epoxies has created materials with an 8.8 GPa modulus for a 20% A-CNT Vf composite, as measured using nano-indentation[16]. Also, the A-CNT waviness has been measured based on 75 high-resolution SEM images as a wavelength ratio of 0.185 ±0.10. The conductivity of the A-PNC is also shown for a 1% Vf A-PNC to be 23 and 8.2 S/m for the axial and transverse directions, respectively[16].
A-CNT based PNC materials have been characterized in detail by both Sepulveda et al. and Handlin et al., to generate full three dimensional mechanical constitutive models[12,43]. A-CNT and PDMS materials have shown highly non-isotropic properties, with an assumed transverse isotropic stress strain relation. In the symmetry planes, a Young’s modulus of 1.70 ±0.25 MPa was measured, with a Poisson ratio of 0.26 ±0.03, versus 8.1 ±1.2 MPa, 0.05 ±0.01, 0.24 ±0.04, and 0.24 ±0.07 MPa for the modulus, both Poisson ratios and shear modulus in the CNT direction, respectively[43]. The non-isotropic three dimensional constitutive tensor of Epoxy and A-CNT PNC materials of various Vfs was completed in 2013, with the derived constants shown in Figure 2.5. This testing used tensile specimens and digital image correlation (DIC) to measure the three dimensional parameters. There was a doubling of the modulus in the parallel direction to the CNT plane, x, when moving to 18% Vf, but not much change in modulus in the transverse (y) or shear direction[12].
Handlin’s work uses the same reference axes as defined in Figure 1.1 as well as used in this work.
Figure 2.5: Plots of full non-isotropic constitutive model of A-CNT epoxy PNC samples across various A-CNT Vfs[12]. The transverse (y) modulus, shear modulus and Poisson ratios do not vary significantly with A-CNT Vf, but the modulus in the direction of the A-CNT varies linearly with Vf.
The tensile testing has shown a much lower modulus than predicted by the rule of mix-tures, or as shown using nano-indentation, attributed to the waviness ratio of the CNTs[12]. The waviness does have a strong influence on the properties of the nano-composites, as well as the Vf of the A-CNTs has been shown to affect the waviness[39,44,45]. In particular, the effective elastic modulus can be reduced by as much as three orders of magnitude by ac-counting for waviness[45]. In addition, simulations have shown the polymer in the A-PNC can influence the waviness of the CNTs[45]. Other reasonings for the lower tensile modulus could be similar to the above discussions about the Oliver-Pharr method[16], as well as that
the compressive modulus is shown to be higher in A-CNT PNCs than the tensile modulus, likely due to the higher load transfer in compression[46].
A fully detailed three dimensional characterization of morphology has also been com-pleted on similar epoxy A-PNCs with various Vfs, using a focused ion beam (FIB) TEM method developed at the National Institute of Standards and Technology (NIST)[8]. Fig-ure 2.6 shows the measFig-ured volume fraction and three dimensional alignment of four sam-ples with varying amounts of mechanical densification and Vfs.
Figure 2.6: Four A-PNC samples characterized using 3D quantitative electron tomogra-phy from FIB-TEM imaging. Left series shows CNT direction by color for calculation of alignment, and the right series shows the measured Vf[8].
Additionally, coatings on A-CNTs have also been demonstrated, such as conformal coatings by oxidative chemical vapor deposition (oCVD) to create three phase A-PNCs[47]. Similarly to the structural A-PNC efforts, multi-phase device construction has been shown to create very high energy and power density supercapacitors using coated A-CNTs. Hybrid supercapacitors fabricated by Ghaffari et al. using PEDOT conformally coated A-CNTs densified to 5% Vf have shown a specific volumetric capacitance of 84.0 F/cm3, compared to only 3.9 F/cm3 for non-coated and undensified A-CNT samples, for specific energy and power densities of 11.8 W h/L and 34.0 kW /L respectively[48]. Further optimizing
these electrodes in an asymmetric manner has pushed the devices to specific energy and power densities of 82.8 W h/L and 130.6 kW /L[19]. Other coatings such as manganese dioxide coated on CNT has generated a specific capacitance of 517 F/g at a scan rate of 5 mV/second for an energy density of 3.88 W h/kg at a power density of 7,000 W /kg[49].
The recent advances in A-CNT based PNCs and supercapacitors parallels with the i-EAP research, as higher specific capacitances generate larger strains, and faster capacitive charging equates to faster i-EAP actuation. These efforts will influence the planning and discussions of the A-CNT i-EAP materials in this work, as well as the known variables to the A-CNT growth will be investigated to allow specific tailoring of growth.
2.3
Nano-structured Ionic Electroactive Polymer
Materi-als
Combining the recent advances in A-PNCs and supercapacitors with the i-EAP technology, nano-materials can be used to increase the strain and capacitance by having larger surface areas for constructing the i-EAP electrodes. The lower device capacitance than the super-capacitors shows the theoretical margin for advancement in i-EAP actuation of over 10 times[21]. Early attempts included placing randomly oriented CNTs into the electrodes of an i-EAP[50], or infusing nano-particles into the polymer layers. In 2010, Liu et al. infused RuO2nanoparticles into the bulk of the Nafion to make a more conductive nanocomposite,
which when used with BMI-BF4 ionic liquid generated ∼20,000 microstrain[10].
Recently, Liu et al. has incorporated A-CNTs into the i-EAP devices, not only increas-ing the capacitance and conductance but also providincreas-ing a non-isotropic framework to pref-erentially strain in the desired direction[10]. This also allows for direct ion paths, increasing the actuation speed by removing the prior circuitous paths ions had to travel through[10]. These devices strained as high as 121,000 microstrain perpendicular to the A-CNT axis, and 70,000 microstrain in the thickness direction parallel to the A-CNT axis[10]. These de-vices were tested for over 300 cycles at 0.5 Hz, with no observed degradation. These high strains were achieved using A-CNT materials at higher volume fractions (Vf) of around
10%, which provides a larger specific electrode surface area for storing the excess ions[10]. This work has been continued by Michalenko et al. moving to higher Vf A-CNT based i-EAPs. In 2013, 40% Vf devices generated 132,000 microstrain in the perpendicular to A-CNT axis, using BMI-BF4 IL and a 3 V potential[11]. Figure 2.7 shows an overview of this i-EAP device architecture, and this is the basis for the devices that will be further discussed throughout this thesis.
Figure 2.7: Thickness actuator setup, including positive and negative A-CNT and Nafion electrode based i-EAP devices in a pool of ionic liquid. Potentiostat setup provides actu-ation potential, and small yellow anions and large red cactu-ations are shown reacting to this voltage. The axes are defined such that the direction of the CNTs is the x direction with the y and z directions isotropic[11].
Graphene has also been used as a conductive additive to Nafion based i-EAP devices. Adding only 0.1% by weight of graphene to a Nafion based actuator has improved both the energy density and actuator displacement by over double[51]. Exfoliated graphite oxide based actuators have most recently been tested as one of the highest straining i-EAP mate-rials. These graphitic i-EAP actuators have strained as much as 566,000 microstrain using BMI-BF4 and acetonitrile mixed solution under a 4 V potential and a 50 mV /second scan rate[1]. The strains perpendicular to that direction were only 30,000 microstrain and in the negative direction, showing the high non-isotropy[1]. The devices were even tested up to 500 mV /second rates. The IL has been mixed with the acetonitrile solvent in order to in-crease the ionic mobility by creating a lower viscosity. These devices also have a very high
energy density of 1.5 J/cc using only 4 Volts of electricity, much higher energy density than alternate types of active materials[1]. Further optimization to these devices, such as adding ion transport channels, can increase the strain to as much as 775,000 microstrain[52].
This work carries on from these nano-structured i-EAP materials that have already been shown to generate very large strains, to generate a better understanding of the strain gener-ating mechanism. Understanding the physics of the strain generation will assist in showing the real benefits and limitations of these materials. A-CNT based i-EAP materials are cho-sen as the basis of this thesis as they have already had much of the basic characterization completed, and their manufacturing is better understood than some of the most recently attempted materials.
2.4
Materials
This section focuses on the multitude of critical materials that are part of this work in creating A-PNC based i-EAP devices, including the Nafion polymer, ionic liquids, solvents and other associated equipment.
2.4.1
Nafion Polymer
Nafion is a sulfonated tetrafluoroethylene based fluoropolymer-copolymer created by DuPont in the 1960’s, with the structural formula shown in Figure 2.8[53]. This is a popular selec-tion for proton exchange membrane (PEM) fuel cells and i-EAP devices due to the ther-mally and mechanically stable teflon backbone, chemical resistance, and that it is highly conductive to cations. It is also a strong dielectric, and does not conduct anions or electrons. Nafion is purchased from the Nafionstore in 0.3 x 1 m copolymer sheet form called NR211, by DuPont[53]. The elastic modulus of the Nafion film with 40 wt% ionic liquid was measured as 50 MPa[10], versus the specified modulus of 288 MPa[53]when dry. Since Nafion is insoluble and not possible to melt process, these films have to be carefully recast to take on new forms or coat structures, which is the method leveraged for this work[4].
Figure 2.8: Structural formula for DuPont Nafion, showing teflon backbone and acidic sulfonic group side chains.
2.4.2
Ionic Liquids and Solvents
Ionic liquids (IL) have been used in recent i-EAP devices as the solvent for the polymer layer, both providing the ions for actuation and the method of transport. They have helped to improve both the stability of i-EAPs over time, as well as the electrochemical window (ECW). In addition, they are nonvolatile, nonflammable and have high ionic conductiv-ity[54]. The toxicity of these ILs is not known, but is estimated to be low[55]. Sheng Liu studied multiple ILs for the impact to actuator speed and efficiency, based on the varia-tions in ion sizes of four different imidazolium ionic liquids[54]. ILs have been used for organic synthesis, catalysis, electrochemical devices and solvent extraction of a variety of compounds[56]. Akle et al. has demonstrated highly stable i-EAP actuators based on these room temperature ionic liquid (RTIL)[20]. A RTIL is a salt that contains only ionic molecules that are liquid at room temperature, usually below 100◦C, has a negligible va-por pressure and is stable up to 400 ◦C[20]. The available i-EAP actuation voltage using IL is also larger than when using water, increasing the maximum energy density and actu-ation capacity[20]. There is vast supplemental information on ILs in the IL focus review by Barrosse-Antle et al.[57]. Some example ionic liquid cation and anion sizes are shown in Figure 5.1.
In this work, 1-Butyl-3-methylimidazolium tetrafluoroborate (BMI-BF4) is utilized as the IL, in a two molar mixture in propylene carbonate (PC). The BMI-BF4 is purchased in 99% high purity form from Iolitech (item number 174501-65-6, 100 gm). High purity PC purchased from VWR (item number AAA15552-0B, 99%, 1 kg), is an organic compound
Table 5.1: Ion dimensions in popular ionic liquids[27]. In this work, the BMI cation and BF4 anion are chosen since they have both very large and very small volumes respectively. This generates maximum strain with reduced strain relaxation after applied voltages are removed.
Ion Molecular dimension ( ˚A) Molecular Volume ( ˚A3) EMI+ 7.8 x 5.8 x 3.3 149
BMI+ 9.7 x 7.0 x 3.3 224 BF−4 3.1 x 3.1 x 3.1 30 Tf− 4.4 x 4.4 x 3.3 64
and has the properties of being a polar, apriotic solvent. BMI-BF4 is chosen for these i-EAP devices as it has been shown to provide large strains compared to other ILs, with more limited strain relaxation[26]. The large strain device capability is due to the large electrochemical window of near 4 V and the large cation and anion size difference, which Ghaffari et al. used to create i-EAP devices with a max strain of 566,000 microstrain (56.6%) at a 50 mV /second scan rate[1]. The viscosities and densities of these IL solvent mixtures are shown to be linear functions of the fraction of the ionic liquid in the mixtures and the separate species properties[58]. Diluting the IL into the less viscous solvent allows for a faster actuator response. The relative dielectric permittivity of BMI-BF4 has also been measured at room temperature (25 ◦C) as 13.9 ± 0.4, showing its non-conductance to electrons[59]. The relative dielectric permittivity of PC is also known to be 64.4 at 25
◦C, being even a stronger dielectric[60]. The disadvantage of using this IL, due to the
large cation size, is that i-EAPs using BMI-BF4 have showed slower response times even with a diluted IL in solvent[27]. The atomic structure of BMI-BF4 is shown in Figure 2.9. Another limitation to these ILs is that they are very sensitive to moisture, as it can reduce the ECW[61]. Many studies of i-EAPs have focused on water content, as it can play a major role in device performance[62]. In addition, impurities in the IL can cause additional reactions at larger potentials, and generate dark residue that can limit DIC imaging and the operation of the i-EAP devices. Figure 2.10 shows the impact to BMI-BF4 of various moisture levels.
Figure 2.9: Structural formula of BMI-BF4 ionic liquid.
Figure 2.10: BMI-BF4 cyclic voltammogram across moisture levels showing impact to ECW[61]. Largest ECW is vacuum dried, followed by atmospheric, and then wet at 298
◦K, 318◦K and 338◦K.
2.4.3
Dimethylformamide
The chemical used for infusing the Nafion into the A-CNT matrix is chosen to be dimethyl-formamide (DMF). It is used due to its boiling point of 153◦C, high enough to slowly evap-orate over a long period of time[63]. The DMF is purchased from VWR in 99.9% minimum purity anhydrous form with no more than 50 ppm water content (item number BJAS076-1, 1 L).
2.5
Electroactive Polymer Challenges and Literature Gaps
EAP devices have been vastly improved since their invention, but much is still unknown about the actuation mechanisms and device properties. The core method of actuation has been speculated based on the characteristics of the devices, but the actual mechanism that causes strain is still largely unknown[2,6,20].
In order to effectively use these materials for actuator, sensor or energy harvesting devices, properties must be well understood. A properties database with scaling laws is needed to allow for accurately determining the response at various operation conditions[2], and this understanding of engineering foundations is needed to mature the technology[7]. Figure 2.11 shows the recommended properties of interest and the reason for knowing each for EAP devices, including mechanical, electrical, electroactive, environmental and microstructure analysis.
Figure 2.11: Suggested characterization properties of significance for EAP materials from Bar-Cohen et al. 2001[6]. Some of these have been investigated, but many assume full isotropy or remain unknown.
In addition to the multitude of required characterizations to complete, there are many complicating factors of i-EAP devices making this a greater challenge. Since these devices have such large strains, there are generally mismatches with the metal electrodes, nonlinear properties, and hysteresis. Also, difficult processing has created nonhomogeneity issues in the devices, making accurate characterization nearly impossible. Many studies treat the
i-EAP devices as isotropic due to these complications, which is not accurate for these highly non-isotropic materials. Liu et al. has assumed full isotropy for calculating the material modulus[10], which has been shown as an incorrect assumption based on the strain of these devices being very different in the different axes.
Advances on the i-EAP materials themselves are also ongoing, to meet the demanding requirements of small, lightweight, low power and high strain devices needed for artificial muscles and similar actuators. Early devices using water as solvents had short lifetimes and required constant hydration, where as newer devices with ILs require a dry environment free from impurities. The usage of IL met the demands forecast by Bar-Cohen et al. in 2008, looking for new materials that can be operated in dry environments but not requiring any protective coating layers, by working with solvents of low vapor pressure to increase both the response rate and lifetimes[7]. This research continues on this path of both creating tailored i-EAP devices with higher processing consistency, as well as further characterizing many of the parameters from Figure 2.11.
Chapter 3
Objectives and Approach
Ionic-Electroactive Polymer devices and materials have been widely studied for their high strain capabilities, but key morphological, mechanical and processing qualities remain un-known. The A-CNT based i-EAP materials have never had a defined constitutive relation, and even a method of connecting the mechanical to electroactive relationships are not dis-cussed, where as they are well known in piezoelectric devices. In order to utilize these devices, further insight into the detailed processing requirements and constitutive relations are required.
In this work, A-CNT and Nafion PNC electrodes, the key active portion in ionic-electroactive polymer (i-EAP) actuators, are manufactured and investigated. i-EAP ac-tuators create large strains with low input voltages, and could therefore be used for future high strain sensing and actuation mechanisms such as synthetic muscles, microfluidic drug delivery, or low frequency energy harvesting. Experimental data is acquired and reduced to form structure-property relations for these materials, with some process-structure investi-gation, the latter focused on quality and repeatability. Stiffness measurements, strain under applied electric field, and morphological information (via SEM, TEM, optical microscopy, and other techniques) is captured.
A-CNT based i-EAP devices are a current focus based on their recently shown and use-ful non-isotropic strains, high speed actuation, and potential for commercialization. Nafion is selected due to its stability and high ionic conductivity, along with flexible side chains that allow for ionic mobility. The A-PNC improvement is accomplished by process
con-trol and moving to higher volume fraction A-CNTs in the PNCs, in order to increase both the rate of strain and the magnitude of strain consistently through increased non-isotropy and ionic transfer efficiency. These process variabilities seen in prior work result from a lack of tight control over the thermal profile, environmental variations and user process variations, which will all be discussed in this work. For high yield device processing, the current low yield CNT growth will not suffice, so a new process is required. The goal of this new A-CNT growth process will be to keep similar dimensional and morphological properties, without degrading the quality, and while dramatically increasing the processing yield. Lastly, the non-isotropic linear mechanical, electrical and electroactive constitutive law is discussed and measured for different morphologies of the electrode devices, and compared to prior work.
Chapter 4
Experimental
4.1
Aligned Carbon Nanotube Synthesis
The novel portion of ionic electroactive polymer (i-EAP) actuators being studied herein is the electrode material, an aligned carbon nanotube (A-CNT) polymer nanocomposite (PNC) device. The PNC device is manufactured in three main subsections, the A-CNT (with or without densification), the Nafion infusion for creating the A-PNC, and the ionic liquid infusion to create the active i-EAP electrode. Each stage has associated design con-siderations which have been studied, and will be discussed in the following sections.
4.1.1
Chemical Vapor Deposition Processing
The first process is to grow the A-CNT using a modified chemical vapor deposition (CVD) recipe of hydrogen, helium, ethylene[33]and water. This CVD process to grow the A-CNT forests is run at atmospheric pressure, and normally yields multiple 1 cm square samples of self aligned 1,000 micrometer tall A-CNTs. This is a rapid growth process that regularly yields around 2.4 micrometers of height per second, using the same stages of growth as de-fined in Chapter 2. Water is added in this work as a process control for stabilizing humidity during growth independent of the ambient humidity around the furnace. This also assists with delamination[38], and increases forest heights[37], as discussed later in this section. In addition, the thermal ramp during catalyst ripening is now controlled to limit thermal