HAL Id: hal-02644155
https://hal.inrae.fr/hal-02644155
Submitted on 28 May 2020
HAL is a multi-disciplinary open access
archive for the deposit and dissemination of
sci-entific research documents, whether they are
pub-lished or not. The documents may come from
teaching and research institutions in France or
abroad, or from public or private research centers.
L’archive ouverte pluridisciplinaire HAL, est
destinée au dépôt et à la diffusion de documents
scientifiques de niveau recherche, publiés ou non,
émanant des établissements d’enseignement et de
recherche français ou étrangers, des laboratoires
publics ou privés.
Structural and functional development of small intestine
in intrauterine growth retarded porcine offspring born
to gilts fed diets with differing protein ratios throughout
pregnancy
Michal Mickiewicz, Romuald Zabielski, Bertrand Grenier, Laurence Le
Normand, Gérard Savary, Jens Juul Holst, Isabelle P. Oswald, Cornelia C.
Metges, Paul Guilloteau
To cite this version:
Michal Mickiewicz, Romuald Zabielski, Bertrand Grenier, Laurence Le Normand, Gérard Savary, et
al.. Structural and functional development of small intestine in intrauterine growth retarded porcine
offspring born to gilts fed diets with differing protein ratios throughout pregnancy. Journal of
Physiol-ogy and PharmacolPhysiol-ogy, Krakow Polish Physiological Society, 2012, 63 (3), pp.225-239. �hal-02644155�
INTRODUCTION
Dietary protein supply to pregnant females alters their metabolic characteristics (1) and plays an important role in the postnatal development and performance of their offspring. A limited protein intake during pregnancy in sows results in increased perinatal mortality and reduced birth weight in the offspring (2, 3). In pregnant rat dams, a high protein diet results in the low birth weight of their pups (4). Furthermore, gestational protein deficiency affects the development of the small intestine (SI), as evidenced by the decrease in the number and height of intestinal villi, accompanied by a reduction in the absorption surface, shortening of intestinal length, decrease in DNA content and migration of the enterocytes along the intestinal villi (5-7).
Excess or limited protein intake by the pregnant mother also results in an increased percentage of intrauterine growth retarded (IUGR) neonates characterized by low birth weight in pigs (birth weight 1.1 kg or less in piglets) (3), as well as in rodents (4, 8). Although IUGR neonate piglets may undergo a catch-up growth
postnatally, they show increased adipose tissue deposition, hypercholesterolemia, reduced locomotor activity and high mortality (8-10). Statistical data from the USA indicate that approximately 30% piglets each year are classified as IUGR and exhibit increased perinatal mortality, altered body composition, growth performance, metabolism, and reduced meat quality (a more fatty carcass) (11). Mouse and rat models of IUGR suggest that a maternal protein-deficient diet leads to disturbances in amino acids balance in both the mother and the fetus, while a protein-enriched diet decreases fetal plasma IGF-1, leptin and insulin which in turn can reduce the activity of amino acids transport across the placenta and restrict their fetal levels (12, 13). Thus, the maternal dietary protein level during pregnancy, if not well monitored, affects fetal nutrition and results in an increase in the percentage of IUGR neonates. Furthermore, it was demonstrated that IUGR status increased the risk of metabolic disorders in humans and other mammalian species (14). According to Wu et al. (11), 80% of dead newborn IUGR piglets manifested digestive disorders and Thornbury et al. (15) observed a decline in the health status of IUGR piglets M. MICKIEWICZ1,2, R. ZABIELSKI2, B. GRENIER3, L. LE NORMAND2, G. SAVARY2,
J.J. HOLST4, I.P. OSWALD3, C.C. METGES5, P. GUILLOTEAU1
STRUCTURAL AND FUNCTIONAL DEVELOPMENT OF SMALL INTESTINE
IN INTRAUTERINE GROWTH RETARDED PORCINE OFFSPRING BORN TO GILTS
FED DIETS WITH DIFFERING PROTEIN RATIOS THROUGHOUT PREGNANCY
1UR 1341, Alimentation Adaptations Digestives, Nerveuses et Comportementales (ADNC), Institut National de la Recherche
Agronomique (INRA), Saint Gilles, France, 2Department of Physiological Sciences, Faculty of Veterinary Medicine,
Warsaw University of Life Sciences, Warsaw, Poland, 3UMR 1331 Toxicologie Alimentaire (ToxAlim), Institut National de la
Recherche Agronomique (INRA), Toulouse, France, 4Department of Medical Physiology, University of Copenhagen, Copenhagen,
Denmark, 5Research Unit Nutritional Physiology, Leibniz Institute for Farm Animal Biology (FBN), Dummerstorf, Germany
Protein level in the maternal diet plays a crucial role in fetal programming during pregnancy. Low or high protein level increases the risk of intrauterine growth retardation (IUGR). The aim of this study was to investigate the structural and functional development of the small intestine in piglets from sows fed a control (C, 12.1% protein), a high protein (HP, 30% protein), or a low protein (LP, 6.5% protein) diet during pregnancy. Newborns were classified as IUGR (birth weight ≤1.18 kg) and non-IUGR (birth weight >1.18 kg). The piglets were euthanized on postnatal day (PD)1, PD28 and PD188. The LP diet in non-IUGR neonates resulted in decreased body weight on PD1. The LP and HP diets resulted in both decreased body weight and delayed catch-up growth in the IUGR piglets. The HP and LP-diets increased the length of villi on PD1 in non-IUGRs but not in IUGRs. At birth, the expressions of Ki67 and active caspase 3 in mid-jejunum epithelium of HP and LP non-IUGR neonates were significantly lower as compared to C non-IUGRs whilst in IUGRs the respective expressions were as high as in C non-IUGRs. The postnatal dynamics of brush border enzyme activities and vacuolated enterocytes disappearance showed significant drop in enterocyte maturation in IUGR as compared to non-IUGR neonates. In conclusion, both HP and LP diets led to retarded development of non-IUGR piglets. In IUGR piglets both HP and LP diets resulted in delayed catch-up growth, without adaptive changes in brush border digestive enzymes.
presumably based on digestive problems. Jeffrey et al. (16) reported low SI weight, numerous focal lesions in intestinal brush border and reduced intestinal absorptive area in IUGR neonates. Sangild et al. (17) reported less developed SI structure and function which was manifested by a reduction in SI weight, increased SI length and lack of response to glucagon-like peptide-1 and -2 (GLP-1 and -2). Mucosal thickness was reduced and villus/crypts ratio was lower in IUGR newborn pigs as compared to non-IUGR littermates, which might affect SI digestive and absorptive functions. Recently, D’Inca et al. (18) reported reduced activity of SI brush border enzymes, sucrase and dipeptidyl peptidase IV, in newborn IUGR piglets.
The aim of our study was to investigate the development of SI mucosal structure and function in porcine offspring prenatally exposed to three different protein levels in the maternal diet during pregnancy: a control diet (C, 12% protein/moderate carbohydrate), a high protein diet (HP, 30% protein/low carbohydrate), or a low protein diet (LP, 6.5% protein/high carbohydrate). Three key time-points were selected for collecting offspring samples, postnatal day (PD)1, PD28 and PD188. The first two time points reflect immediate and early postnatal effects of abnormal prenatal dietary protein; the third time point is indicative of long-term effects of abnormal protein exposure during prenatal life as suggested by Guilloteau et al., (19). Furthermore, we hypothesized that IUGR piglets may show a developmental pattern distinct from non-IUGR littermates, and therefore the data from piglets displaying low birth weight and catch-up growth were considered separately from non-IUGR piglets.
MATERIAL AND METHODS
Animals and experimental design
All procedures in this study were performed in accordance with German animal protection laws and approved by the relevant authorities (Landesamt fur Landwirtschaft, Lebensmittelsicherheit und Fischerei, Mecklenburg-Vorpommern, Germany). For details on animals, reproductive management animal numbers and treatments see Rehfeldt et al. (3). Briefly, 66 German Landrace gilts bred at the Leibniz Institute for Farm Animals Biology (FBN) were estrus synchronized after the third estrus. Gilts were inseminated twice by sperm derived from German Landrace boars. One day before the first insemination, gilts were randomly allocated to three dietary groups. Experimental diets were formulated to be isoenergetic (~13.7 MJ ME/kg) and contained either adequate protein level used as control diet (C, 12.1% protein; n=20) with moderate carbohydrate levels (protein:carbohydrate ratio 1:5), a high protein level (HP, 30% protein; n=21) with low carbohydrate levels (protein:carbohydrate ratio 1:1.3), and a low protein level (LP, 6.5% protein; n=20) with high carbohydrate levels (protein:carbohydrate ratio 1:10.4). For more details see: Rehfeldt et al. (3) and Table 1. Between early and late pregnancy food intake was between 2.3 and 2.9 kg/day to achieve an average target intake of ~34 MJ ME/day during gestation according to recommendations for the primiparous sows (20). Labor was induced on day 114 of pregnancy to standardize pregnancy length. Birth weight was recorded, and 4 piglets were selected from each litter (the heaviest, two of medium weight based on the median within the litter, and the lightest with >800 g body weight - BW); individual piglets euthanized within 36 h were considered to be of the same age (PD1). Piglets were euthanized by an i.v. injection of T61 (200 mg embutramide, 50 mg mebezonium iodide, 5 mg tetracaine hydrochloride) (C, non-IUGR=19, IUGR=7; HP, non-IUGR=13, IUGR=16; LP, non-IUGR=16,
IUGR=12; with an approximately equal number of males and females per group). The remaining piglets were cross-fostered within 48 h after birth by 2-4 parity sows fed a standard (adequate) diet during pregnancy (11 piglets per sow). The standard pregnancy diet (Provital RF F.324.0; Tred & Pein, Dammfleth, Germany) fed to foster sows at 2.4 and 3.0 kg/day during early and late gestation contained 11.4 MJ ME/kg, and 12.6 crude protein. After birth, foster sows were fed a single standard lactation diet (Provital LAC R.325.0; Tred & Pein) with 15.5% crude protein, ~13.0 MJ ME/kg at an increasing level of 3-5 kg/day within the first postnatal week. Male piglets were castrated on PD4. On PD28, 2 weanling piglets were selected from each litter and euthanized (T61 i.v.) for further analysis (non-IUGR C piglets n=22, IUGR C piglets n=3; non-IUGR HP piglets n=14, IUGR HP piglets n=16; non-IUGR LP piglets n=9, IUGR LP piglets n=13; with an approximately equal number of males and females per group). After weaning, the piglets were fed a standard commercial diet as follows: PD27–PD76 - post-weaning diet (Turbostart, Porcistart and Porcibig; Trede & Pein), PD76–PD105 - growing diet (Vormast Trafo TOP; Trede & v.Pein), and PD105–188 - finishing diet (Vital-Mast MM; Trede & v.Pein). On PD188, two remaining piglets per each litter were euthanized by electro-stunning followed by exsanguination. Further experimental details were described previously by Rehfeldt et al. (10, 21). Moreover, at each stage (PD1, PD28 and PD188), pigs were allocated into two groups according to 25% percentile of birth weight: IUGR with birth weight ≤1.18 kg, and non-IUGR with birth weight >1.18 kg.
Tissue collection and analyses
All animals were euthanized 16-17 h after the last meal. SI was dissected and measured for weight and length. Small intestine tissue derived from IUGR piglets was more fragile than in non-IUGR piglets, which made the collecting and processing of samples particularly difficult for microscopic analyses. The reason for choosing mid-jejunum (50% of jejunum length) samples of SI for analysis was based on our previous histometry and immunofluorescence analyses that indicated little animal to animal variation in the mid-jejunum as compared to the proximal or distal jejunum (respectively, 25% and 75% of jejunum length), duodenum or ileum (22, 23).
Histometry and cytometry analyses
Whole-thickness SI segments (1.5 cm) were fixed in 4% buffered formaldehyde and then stored in ethanol. Subsequently, the samples were embedded in paraffin, and serial histological 5 µm sections were stained with hematoxylin and eosin for morphometric analysis under the light microscope. Morphometric analysis included measurements of the length of villi, crypt depth, mucosal thickness, and muscle layer thickness, as well as the presence of large vacuoles, as markers of enterocyte maturation (22). Five to ten slides for each tissue sample were prepared and 30 measurements were performed using an optical binocular microscope (Olympus BX60; Olympus, Warszawa, Poland) coupled via a digital camera to a personal computer equipped with a cell^P (Olympus) software.
Whole-thickness mid-jejunum preparations were labeled with a specific set of antibodies Ki-67 (FITC-conjugated, BD Pharmingen, California, USA) and caspase-3 (FITC-conjugated, BD Pharmingen) as markers of cell proliferation (mitosis) and cell apoptosis respectively. Cell nuclei were stained with 7-amino-actinomycin D (Sigma-Aldrich Corporation, Missouri, USA), and sequence scanning was used to omit cross-talk between fluorescent dyes. Confocal microscopy (Olympus FV500) and Microimage v. 4.0 software (Olympus) were
employed for in-tissue-cytometry analysis of apoptotic indexes in the small intestinal epithelium (23).
Enzyme analyses
Mucosa from the same intestinal site (mid-jejunum) was scraped by smooth ground edge microscope slide, snap frozen in liquid nitrogen for approx. 30 min, and then stored in -80°C for future analyses. Total protein content and activity of brush border enzymes were determined in mucosal homogenate. After thawing, 1 g of mucosal scrapings was homogenized with 5 ml of distilled water and centrifuged for 5 min at 1000 g at 4°C. Total protein content was determined (24), using BSA as the standard. Lactase, maltase and saccharase activities were determined according to Dahlquist (25), and aminopeptidase N according to Maroux et al. (26). Enzymatic activity was presented as enzymatic international unit (IU).
Detection of pro-inflammatory cytokine mRNA
For RNA extraction, 200 mg of mid-jejunum intestinal samples were quickly collected in a tube containing 1 ml of RNA-later solution (Applied Biosystems France, Courtaboeuf, France), incubated at room temperature for 24 h and then frozen and stored at -20°C until the analysis.
Ten piglets were randomly chosen at each age (days PD1, PD28 and PD188) from each of the 3 groups (C, LP and HP). RNA was extracted as previously described (27). RNA concentration, was determined spectrophotometrically (O.D.260)
using a Nanodrop ND1000 (Labtech International, Paris, France) with the integrity of RNA analyzed by gel electrophoresis. The steps and conditions of reverse transcription and real-time PCR were performed as previously described (28, 29). RNA non-reverse transcripted was used as the non-template control for verification of a non-genomic DNA amplification signal. The specificity of PCR products was evaluated at the end of the reaction by analyzing the curve of dissociation. In addition, the size of amplicons was verified by gel electrophoresis. The sequences of the primers used in PCR are detailed in Table 2. Primers were purchased from Invitrogen (Cergy Pontoise, France). Amplification efficiency and initial fluorescence were determined by DART-PCR method (30); values were then normalized by two housekeeping genes, β2-µglobulin and ribosomal protein L32 (RPL32); gene expression was expressed relative to the control group (Table 2).
Blood sample collection and plasma glucagon-like peptide-2 and cholecystokinin analyses
Blood samples were collected from the jugular vein just prior to euthanasia on PD28 (one sample in fasted animals) or on PD188 (samples in fasted animals and at 0.5 and 1.0 h after the morning meal). Tubes containing EDTA (VT-100 STK; 0.1 mL of EDTA, 0.47 mL/L; CMK, Nemours France) and aprotinin (10,000 IU/ml, Trasylol, Bayer Pharma SAS, Puteaux, France) were used for plasma separation. Blood was centrifuged at 2,300 g for 10 min and 4°C, and plasma was frozen and stored at -20°C until further analysis.
The plasma concentration of GLP-2 was measured in ethanol-extracted plasma (70% ethanol v/v, final concentration), by radioimmunoassay (RIA) as previously reported by Hartmann et al. (31). The antiserum is directed against the common N-terminus of human and porcine GLP-2 and therefore measures only fully processed GLP-2 of intestinal origin. Plasma concentration of cholecystokinin (CCK) was measured in ethanol-extracted plasma by means of a commercially available RIA kit (reference RB 302; Euro-Diagnostica AB,
Malmo, Sweden). Synthetic cholecystokinin 26-33 was used as a standard.
Statistical analyses
Statistical analyses were performed using GraphPad Prism 5.04 software (GraphPad Software Inc., USA). Two-way ANOVA with Bonferroni multiple comparisons post-test was used. For the results obtained with cytokine expression, following the Fisher test on equality of variances, one way ANOVA was used to analyze the differences between the different groups of animals at each time point. Statistical significance was considered at 0.1≤P >0.05 as a tendency and marked as an upper apostrophe symbol: T
–, and P≤0.05 as significant. Values are expressed as means±SD. Capital letters indicate differences between C, HP, and LP group; small letters indicate differences between non-IUGR and IUGR and time effects.
RESULTS
Body weight and organometry
Protein level, and consequently, imbalanced protein:carbohydrate ratio in maternal diets was associated with an increased percentage of neonates classified as IUGR. In sows fed the C diet the percentage of IUGR offspring was only 6.6%, whereas in sows fed either the HP or LP diets it was 16.6 and 14.9% (P<0.05), respectively.
In non-IUGRs, body weight (BW) at birth was reduced in both HP and LP piglets as compared to C piglets (P<0.05), but the difference disappeared at weaning (PD28). In non-IUGR HP neonates BW at birth was 25–33% lower than non-IUGR C neonates (P<0.05) and this effect was observed at PD188 (–10%, P<0.05) (Table 3). In IUGRs the difference in BW could be observed between C, HP and LP piglets at weaning (P<0.05; Table 3). However, IUGR piglets in the C group underwent a catch-up growth so that the BW of non-IUGR and IUGR piglets was similar at weaning and no differences could be observed between the two groups on PD188. Interestingly, IUGR HP piglets did not catch-up in BW by PD188 (Table 3).
To compare the development of the gastrointestinal tract (GIT), the data concerning the organ measurements were expressed as relative to BW. In non-IUGR piglets, no effect of the mother diet ingested during pregnancy on relative weight of SI in offspring was observed, except on PD28 with HP diet (–13%, P<0.05; Table 3) but this difference disappeared on PD188. By contrast, in IUGR piglets, the evolution of the relative weight of SI was more important with HP diet as compared with C diet on PD1 (P<0.05; Table 3) and with the same diet, the relative weight of SI was lower in IUGR group than non-IUGR group on PD188 (P<0.05). The relative length of SI was higher with HP diet (as compared with the C diet) in IUGR group on PD1 but opposite effect was noticed in non-IUGR group on PD188 (P<0.05). Moreover, with HP diet, the relative length of SI was higher in IUGR group than non-IUGR group from PD1 to PD188 (P<0.05; Table 3).
Small intestine histometry
In non-IUGR HP and LP neonates on PD1 the villi length was longer as compared to the C neonates group (P<0.05). In contrast, no differences were found in IUGR littermates, but their villi lengths were lower than that of non-IUGR (P<0.05). On PD28, the villi length in non-IUGR piglets was reduced as compared to PD1, with greater reduction (3.4-fold, P<0.05) in HP than in LP piglets. No long-term effect (PD188) on villi
length was observed in non-IUGR pigs and no effect of maternal diet on SI crypt depth was observed. Modifications observed in SI mucosa thickness followed the changes found in villi length, with greater effect in HP piglets than in LP piglets. SI muscularis thickness showed only a long-term effect (reduction of 21%) in LP as compared to C piglets group (P<0.05; Table 4).
The percentage of vacuolated (fetal-type) enterocytes in SI epithelium of non-IUGR piglets was high just after birth
(higher in HP and LP piglets as compared to C piglets, P<0.05), and it was reduced to zero within 4 weeks (at weaning). However, in IUGR piglets the vacuolated enterocytes did not disappear until post weaning and there were still a few vacuolated enterocytes remaining on the top of villi on PD28 (Table 4). Data presented in (Table 4) indicate slower maturation of SI epithelium in IUGR piglets as compared to their non-IUGR littermates.
Item Low (LP) Adequate (C) High (HP)
Ingredient,1 g/kg
Corn 107.7 270.0 10.6
Barley 140.0 415.0 208.5
Soybean meal2 — 75.0 590.0
Soybean hulls 200.0 135.0 72.0
Sugar beet pellets, dried 62.0 55.0 53.0
Corn starch 427.2 — 4.5
Linseed, broken 7.5 4.5 16.5
Beet sucrose 7.5 0.5 10.0
Soybean oil 22.0 20.0 9.0
Mineral and vitamin mix3 25.0 25.0 25.0
l-Ile 0.057 — — l-Leu 0.392 — 0.419 dl-Met 0.063 — 0.487 l-Phe 0.306 — — l-Trp 0.286 — — l-Val 0.050 — — Analyzed, g/kg DM 88.6 88.4 88.5 Crude ash 38.8 42.3 62.0 CP 65.0 120.7 300.0 Crude fat 29.0 37.0 37.0 N-free extracts 675.4 604.2 392.6 Starch 501.3 412.0 205.2 Sugar 33.7 66.9 73.0 Crude fiber 88.9 73.7 102.7 Analyzed, g/16 g of N Cys 1.63 1.79 1.43 Ile 3.01 3.39 3.72 Leu 6.24 6.90 6.19 Lys 4.04 4.29 5.25 Met 1.00 1.19 1.04 Phe 3.68 4.24 4.35 Thr 3.32 3.55 3.66 Trp 0.95 1.04 1.12 Tyr 1.81 2.23 2.65 Val 4.12 4.40 4.10 Calculated Prot:carb4 1:10.4 1:5 1:1.3 Energy, MJ of ME/kg 13.5 13.3 13.9 Lys,5% 0.26 0.58 1.50 Met + Cys, % 0.18 0.39 0.74 Trp, % 0.07 0.13 0.34 Thr, % 0.22 0.44 1.10 Val, % 0.27 0.53 1.23
1As-fed basis, if not given otherwise. 2Soybean meal, 50% CP. 3Mineral and vitamin mixture: ADB15 Pramix, Deutsche Vilomix
Tierernahrung GmbH, Neuenkirchen-Vorden, Germany. Supplied the following amounts of vitamins and minerals per kilogram of complete diet: 12,500 IU of vitamin A, 1,250 IU of vitamin D3, 37.5 mg of vitamin E, 1.875 mg of vitamin K3, 2.5 mg of vitamin B1, 6.25 mg of vitamin B2, 3.75 mg of vitamin B6, 25 µg of vitamin B12, 31.25 mg of niacin, 75 µg of biotin, 0.312 mg of folic acid, 15.625 mg of pantothenic acid, 125 mg of choline, 5,869 mg of calcium, 1,625 mg of phosphorus, 1,250 mg of sodium, 250 mg of magnesium, 125 mg of iron, 125 mg of copper, 178.75 mg of zinc, 75 mg of manganese, 0.5 mg of cobalt, 0.75 mg of iodine, and 0.25 mg of selenium. 4Protein-to-carbohydrate ratio based on N-free extracts/CP. 5In complete air-dried diet.
Table 1. Ingredients and nutrient composition of 3 experimental diets with low (6.5%), adequate (12.1%), and high (30%) protein fed to gilts throughout gestation (3).
Mitotic index and apoptotic index
The in-tissue cytometrical analysis of SI mucosa showed markedly reduced expression of Ki-67 in non-IUGR HP and LP neonatal piglets (PD1) as compared to C neonates (Table 5).
In IUGRs C neonates, Ki-67 expression was reduced as compared to respective non-IUGR C neonates, while the expression in HP and LP neonates was greatly elevated as compared to respective non-IUGR HP and LP neonates. No significant differences were found between the 3 IUGR
GENE PRIMER SEQUENCE GENBANK NO. REFERENCES
RPL32 F (300 nM) TGCTCTCAGACCCCTTGTGAAG R (300 nM) TTTCCGCCAGTTCCGCTTA NM_001001636 (Pinton et al. 2010) (46) Ǻ2-µglobulin F (900 nM) TTCTACCTTCTGGTCCACACTGA R (300 nM) TCATCCAACCCAGATGCA NM_213978 (Devriendt et al. 2009) (47) IL-8 F (300 nM) GCTCTCTGTGAGGCTGCAGTTC R (900 nM) AAGGTGTGGAATGCGTATTTATGC NM_213867 (Grenier et al. 2011) (28) IL-1β F (300 nM) GAGCTGAAGGCTCTCCACCTC R (300 nM) ATCGCTGTCATCTCCTTGCAC NM_001005149 (Devriendt al et. 2009) (47) IL-6 TNF-α F (300 nM) GGCAAAAGGGAAAGAATCCAG R (300 nM) CGTTCTGTGACTGCAGCTTATCC F (300 nM) ACTGCACTTCGAGGTTATCGG R (300 nM) GGCGACGGGCTTATCTGA NM_214399 NM_214022 (Grenier et al. 2011) (28) (Meissonnier et al. 2008) (27) Table 2. Sequences of the primers used in PCR analysis for detection of pro-inflammatory cytokine mRNA.
PD1 PD28 PD188
non-IUGR IUGR non-IUGR IUGR non-IUGR IUGR
C 1.50±0.19a,G,k 1.01±0.12a,l 7.50±2.31k 8.54±0.23H,I,l 130±11k 133±8J,l
HP 1.39±0.11b,m 1.00±0.12b,n 8.01±0.96d,m 6.19±1.22d,H,n 132±5e,m 120±7e,J,n
Body weight
[kg] LP 1.36±0.16c,G,p 1.02±0.13c,r 7.83±1.69f,p 6.60±0.92f,I,r 127±10p 123±4r
Statistics: P value - f: P<0.1; G,H,I,J: P<0.05; a,d: P<0.01; b,c,e,k,l,m,n,p,r,:
P<0.001; N value=311 animals C 41.2±3.3e 39.0±7.3B,k 42.8±1.4C,f 39.6±3.9D,l 14.0±2.1e,f 14.4±3.4k,l HP 43.4±5.5g 47.8±10.7B,m 37.1±5.2C,h 39.2±2.2D,n 15.0±2.0a,g,h 13.1±1.0a,m,n SI relative weight [g/kg b.wt.] LP 39.9±4.3 i 40.3±5.2p 40.2±3.0j 42.2±1.8r 13.7±2.0i,j 15.6±3.2p,r
Statistics: P value - a,D: P<0.1; B,C,k,l,e,f,g,h,i,j,m,n,p,r: P<0.01; N value =262 animals C 272±31a,g 316±39a,E,k 144±16g 120±67k 16.4±1.9F,g 16.2±1.1k HP 276±25b,h 359±32b,E,l 135±12h 163±30l 14.4±1.4d,F,h 16.8±1.3d,l SI relative length [cm/kg b.wt.] LP 273±29 c,j 327±68c,m 135±19j 140±17m 16.1±1.5j 15.3±2.4m
Statistics: P value - d, F: P<0.05; E,g,h,j,l,m,k: P<0.01; a,b,c: P<0.001; N value = 262 animals.
Table 3. Body weight and small intestine (SI) relative weight and length of piglets on postnatal day (PD)1, PD28 and PD188 exposed to diets ingested by mother during pregnancy: control diet (C, 12.1%), high protein diet (HP, 30% protein) and low protein diet (LP, 6,5%). Piglets were classified in two groups according to their birth body weight (Mean ±standard deviation). IUGR: intrauterine growth retarded (n=119) and non-IUGR (n=192). Data was subjected to a two-way ANOVA, with Bonferroni multiple comparisons post-test. P value: B,e,F,G,h,I: P<0.05, a: P<0.01, and c,d: P<0.001 (values with the same letter were different at the statistical level).
neonatal groups (Table 5). Furthermore, there was no difference in Ki-67 expression between PD28 and PD188 in non-IUGR piglets suggesting no changes in the mitotic activity following weaning and thereafter (Table 5, Fig. 2).
The distribution of active caspase-3 expression differed between neonates and older piglets (Fig. 3). In the neonates the cells expressing caspase-3 were located in upper two/thirds of the villi, while in the older piglets it was found in the upper one-third. In general, active caspase-3 expression in neonates followed the Ki-67 expression pattern (Table 5). Namely, in non-IUGR neonates caspase-3 expression was markedly reduced in HP and LP neonates as compared to C neonates (P<0.05), and no differences were observed between the three IUGR groups. On PD28, however, piglets prenatally exposed to HP diet showed higher apoptosis as compared to those exposed to the LP and C diets (P<0.05). On PD188 no differences in the expression of apoptosis markers were observed (Table 5, Fig. 3).
The ratio of mitotic index (MI) to apoptotic index (AI) is an important parameter describing changes in the maturation of SI mucosa. On PD1 in non-IUGR C neonates the ratio of MI/AI was within the range reported earlier in pig neonates (22). On the other hand, MI/AI was increased in the LP neonates (P<0.001) and showed a tendency towards an increase (P<0.1) in HP neonates as compared to the C neonates (Table 5). In IUGR neonates there were no differences in MI/AI between the 3 groups. There were also no differences in MI/AI between IUGR and non-IUGR C piglets; MI/AI was, however, lower in IUGR LP than in non-IUGR LP neonates
(P<0.05). On PD28 and PD188 the lowest MI/AI was found in IUGR HP piglets (Table 5).
Total protein content and enzyme activity
On PD1, the highest total protein content was observed in mid-jejunum mucosa of C non-IUGR neonates (Table 6). In IUGR neonates, the protein content showed a peculiar pattern: in the IUGR C piglets it was low (half of non-IUGR value) and in IUGR HP and LP piglets the protein level was twice that in the IUGR C piglets (P<0.01). However, this effect was short-lasting, and no difference was observed in samples taken on PD28 or PD188 (Table 6).
The activity of brush border lactase, as expected, decreased dramatically between PD1 and PD188 in all 3 diet groups in both non-IUGR and IUGR piglets (P<0.05). The highest activities were found in the non-IUGR C piglets as well as in all IUGR neonates (Table 6). On PD28 differences were observed only in non-IUGR HP and LP piglets whereas in IUGR piglets there were no differences between the groups.
By contrast, brush border maltase and saccharase activities increased with age, and showed major differences only on PD1 in HP piglets (Table 6). On PD1, the highest maltase and saccharase activities were observed in non-IUGR C-piglets and in IUGR HP piglets. Moreover, the activities of maltase and saccharase in IUGR C piglets was less than half that of the non-IUGR C group (P<0.05). No difference was observed in older piglets except on PD188, when saccharase activity was lower in
PD1 PD28 PD188
non-IUGR IUGR non-IUGR IUGR non-IUGR C 690±128 a,B,C,h 515±92.3 a,i 365±58.7 F,G,h 422±28.1i 529±60.3
HP 848±33.8 B,d,j 501±110 d 250±49.2 F,j no data 470±53.5
Villi
LP 845±69.6 C,e,k 578±58.9 e 497±64.9 G,k no data 516±56.7
Statistical level: a,B,C,F,i: P<0.05; G: P<0.01; d,e,h,j,k: P<0.001
C 92.0±15.3 71.3±19.8 102±11.2 90.1±11.0 150±26.0 HP 124±65.3 78.3±23.1 178±46.7 no data 167±118 Crypts LP 109±67.0 75.7±15.6 144±19.4 no data 142±38.6 Statistical level: a: P<0.05; b: P<0.001 C 886±38.7 A,b,e 602±27.9 b,f 637±108e 662±107f 746±91.3 HP 1072±103 A,c,g 778±69.0 c 552±90.7g no data 684±54.7 Mucosa LP 973±90.7 d,h 640±152 d 678±58.2h no data 743±66.5
Statistical level: A,d,e,g,h: P<0.01; b,c: P<0.05; f: P<0.1
C 78.3±24.3b 74.5±8.61c 194±27.8 217±25.6c 533±73.4 A,b
HP 59.7±11.7d 67.1±14.4 212±46.1 no data 541±45.2d
Muscularis
LP 88.5±29.0e 89.1±20.4 180±40.0 no data 422±91.1 A,e
Statistical level: A: P<0.1; c: P<0.01; b,d,e: P<0.001
C 40.7±6.27 A,B 41.1±9.0 C,D 0 5.10±1.13
HP 61.6±10.2 A 58.9±10.0 C 0 4.12±1.41
% Vacuoles
LP 67.9±13.9 B 58.1±10.5 D 0 4.45±0.95
Statistical level: B: P<0.01; A,C,D: P<0.05; N value = 73 animals
Table 4. Results of histometry analysis (Mean ±standard deviation) in the mid-jejunum of piglets at 1 (PD1), 28 (PD28) and 188 (PD188) days of age produced by gilds fed either control (C), or high protein (HP) or low protein (LP) diets during pregnancy. Piglets were classified in two groups according to their birth body weight: intrauterine growth retardation (IUGR) and non-intrauterine growth retardation (non-IUGR). Statistical studies were made using two-way ANOVA analysis of variances with Bonferroni multiple comparisons post-test. Results are indicated for each parameter. Values with same letters were different at the statistical level mentioned.
PD1 PD28 PD188 non-IUGR IUGR non-IUGR non-IUGR
C 9.04±1.93 A,B,c,f 7.98±1.53 c 9.69±0.72 10.7±0.41 f
HP 3.15±0.88 A,d,g,i 8.57±0.87 d 9.88±0.39 g 10.2±0.41 i
Ki-67
LP 3.07±0.68 B,e,h,j 8.87±1.38 e 9.92±1.63 h 11.3±0.82 j
Statistical level: A,B,d,e,f,g,h,i j: P<0.001, c: P<0.05; value = 78 animals
C 21.2±13.1 A,B 20.9±11.2 35.2±9.2 D 36.5±5.5
HP 5.65±2.6 A 18.3±10.5 49.5±4.7 D,E 38.0±9.2
Caspase-3
LP 4.22±3.3 B,c 25.0±3.7 c 33.3±9.1E 37.3±13.6
Statistical level: D, E<: P 0.05; A,B,c: P <0.01; N value = 78 animals
C 0.401±0.181 A,B 0.345±0.129 0.351±0.014 D 0.298±0.048
HP 0.612±0.179 A,f 0.426±0.121 0.201±0.028 D,E,f 0.274±0.065 f
KI-67/ Caspase-3
Ratio LP 1.013±0.312 B,c,g,h 0.353±0.037 c 0.395±0.069 E,g 0.347±0.130 h
Statistical level: ALJ: P<0.1; B,c,D: P<0.05; E,g,h: P<0.01; f: P<0.001; N value = 78 animals
Table 5. Levels of Ki-67 expression used as mitosis marker [%], and active caspase-3 expression used as apoptosis marker [%] in the mid-jejunum of piglets at 1 (PD1), 28 (PD28) and 188 (PD188) days of age produced by gilds fed either control (C), or high protein (HP) or low protein (LP) diets during pregnancy. Apoptosis/mitosis ratio expresses the intensity of SI epithelium rebuilding. (Mean ±standard deviation). Piglets were classified in two groups according to their birth body weight: intrauterine growth retardation (IUGR) and non-intrauterine growth retardation (non-IUGR). Statistical studies were made using two-way ANOVA analysis of variances with Bonferroni multiple comparisons post-test. Results are indicated for each parameter. Values with same letters were different at the statistical level mentioned.
No data are reported for IUGR groups on PD28 and PD188 since no sufficient amount of samples was obtained to perform full matrix of analyses.
Fig. 1. Mitosis index, based on Ki-67 expression, in IUGR and non-IUGR, C, HP and LP piglets. KI-67 was expressed in percent of positive cells per unit area. Cells were stained with Ki-67 anti-rabbit conjugated with FITC antibody and are shown in green; red color shows nuclei of cells stained with 7-AAD. All photos were taken using a confocal microscope (Olympus IX 70) - objective ×20 with the exception of samples derived from non-IUGR HP and LP piglets which were captured with objective ×40.
HP compared to C piglets and maltase activity was lower in LP as compared to HP piglets.
The activity of the brush border peptide aminopeptidase N peaked on PD28, except in LP piglets (Table 6). On PD1 in non-IUGR neonates the lowest activity was found in C piglets and the highest in LP piglets (P<0.05), and the same trend was observed in their IUGR littermates (NS). However, on PD28 the highest activity was observed in non-IUGRs HP piglets, whereas in IUGR piglets there were no differences between groups. On PD188 in HP group, the activity was lower in IUGR than non-IUGR piglets (P<0.05; Table 6).
Concentration of glucagon-like peptide-2 and cholecystokinin in blood plasma
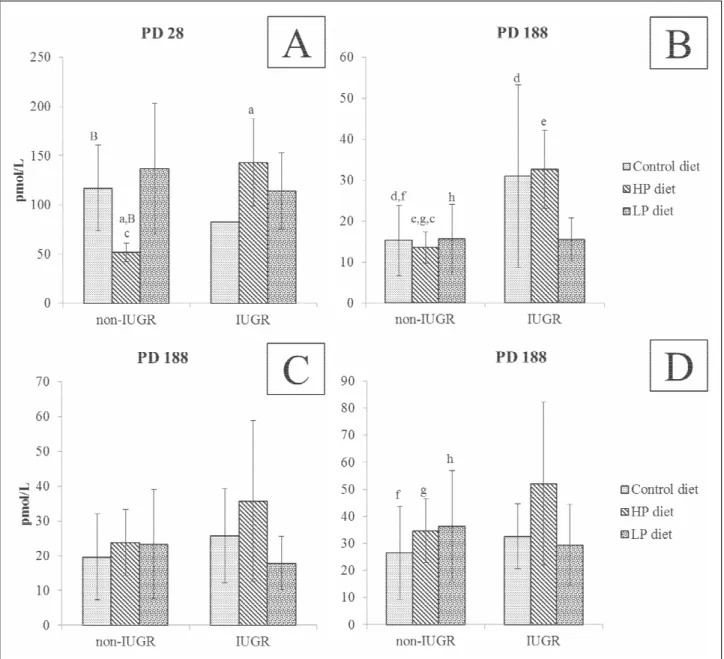
Basal plasma GLP-2 concentration (before meal ingestion) was higher on PD28 as compared to PD188 (P<0.001; Fig. 4) in both non-IUGR and IUGR piglets. On PD28 the lowest concentration was found in non-IUGR HP piglets (P<0.01). In IUGR HP and LP piglets, plasma GLP-2 was not different from either non-IUGR or IUGR piglets (Fig. 4). On PD188, no difference in plasma pre- and post-prandial GLP-2 was observed in non-IUGR or IUGR piglets. However, within IUGRs, the preprandial plasma GLP-2 was significantly higher as compared to other groups whatever the stage (non-IUGR or IUGR) and the time of blood collection (Fig. 4). Kinetics of prandial plasma
GLP-2 level showed a distinct pattern for non-IUGR and IUGR pigs. Namely, in all non-IUGR piglets there was increased plasma GLP-2 postprandially, whereas in IUGR piglets there were no differences between the preprandial and postprandial plasma GLP-2 levels (Fig. 4).
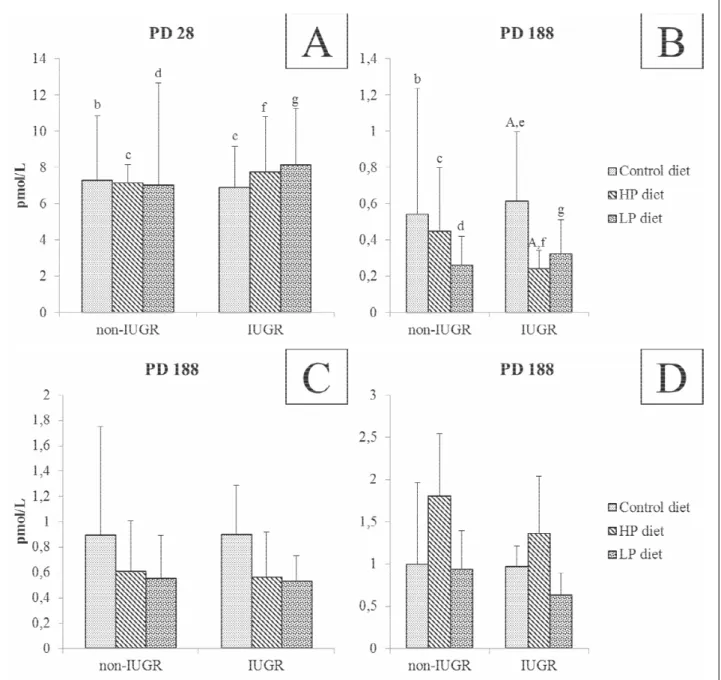
Plasma concentrations of CCK were significantly higher on PD28 as compared to PD188 (Fig. 5). On PD28 there were no differences in pre-prandial CCK level between the non-IUGR and IUGR groups. On PD188 there was a difference between pre-prandial CCK between IUGR C- and HP piglets (P<0.05). On PD188, at 30 min after the meal ingestion, the CCK concentration in HP and LP piglets was higher than in C piglets, (P<0.05); at 60 min after the meal, there was a difference between HP and LP piglets (Fig. 5).
Detection of pro-inflammatory cytokine mRNA in small intestinal mucosa
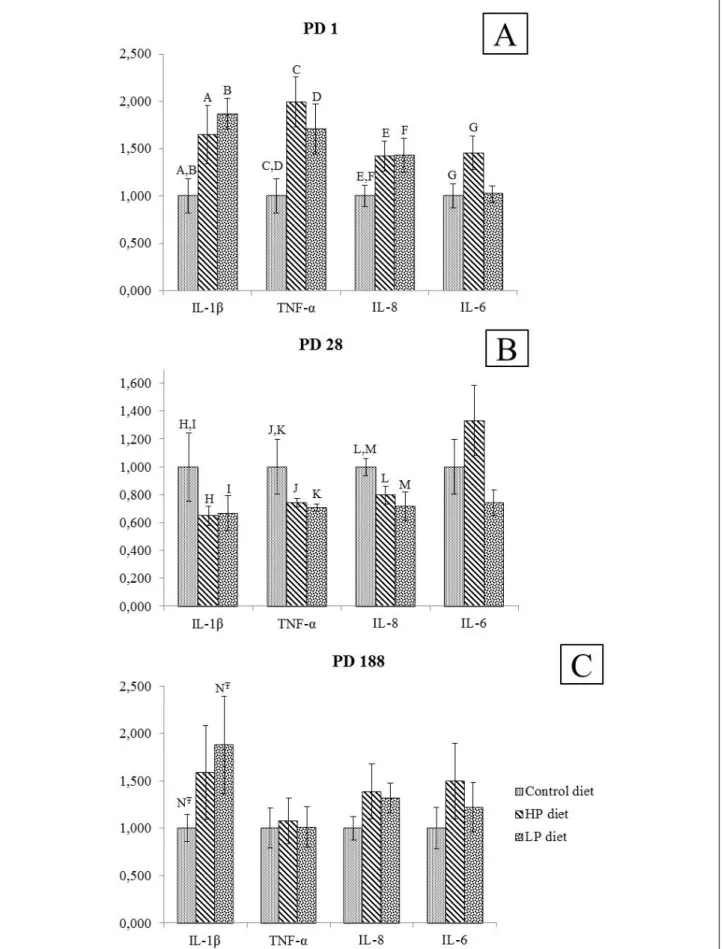
Pro-inflammatory cytokine mRNA in small intestinal mucosa was measured in non-IUGR piglets only. On PD1, mRNA of 4 cytokines measured (IL-1β, TNF-α, IL-8, IL-6) showed significantly elevated tissue levels in HP and LP neonates as compared to C neonates. On PD28, a reverse pattern was observed, except for IL-6 (Fig. 6). On PD188, there were no significant differences in interleukin mRNA tissue level between C, HP and LP piglets, except for the elevated IL-1β level in LP piglets. Fig. 2. Apoptosis index based on caspase-3 expression in IUGR and non-IUGR C, HP and LP piglets on PD1, PD28 and PD188. Caspase-3 staining is expressed as % positive cells per total length of villi. Cells were stained with caspase-3 anti-rabbit conjugated with FITC antibody and are shown in green; red color shows nuclei of cells stained with 7-AAD. All photos were taken using a confocal microscope (Olympus IX 70) - objective ×20 with the exception samples derived from non-IUGR HP and LP piglets which were captured with objective ×20.
DISCUSSION
The present study indicates that the protein level and perhaps protein/carbohydrate level, of maternal diet during pregnancy affects the pregnancy outcome, and specifically increases the number of offspring with IUGR symptoms.
Furthermore, our data indicate that the low body weight observed in IUGRs at birth persisted until PD188 in piglets exposed to low and high protein diets during gestation. In contrast, in IUGRs exposed to standard protein diets during gestation, a catch up growth occurred within 28 days (PD28). Additionally, IUGR piglets showed a number of abnormalities of the GIT at birth, which disappeared with age.
In non-IUGR piglets, changes induced by high or low maternal protein diet, were found mostly at the level of intestinal mucosal structure and function, whereas no significant changes were found at the GI level. The effects on GI size were hardly, if ever seen. In general, the changes were observed only at birth whilst in IUGR pigs, a number of long-term effects were found. Moreover, changes induced by high protein diet were in some instances distinct from those caused by a low protein diet implying the presence of distinct mechanisms. Our results suggest that plasma GLP-2 might play a role in gut development under a high protein diet, but not under a low protein diet, and that CCK mechanism may not be affected by changes in maternal protein level. Interestingly, in IUGRs
pro-inflammatory interleukins showed similar pattern in piglets developing under both the high- and low protein diet that was distinct from one observed in non-IUGR piglets developing under a standard diet of 12% protein.
Effect of level maternal protein diet on the postnatal development of SI in non-intrauterine growth retarded offspring
Both high and low protein maternal diet affected the body weight of piglets at birth. A number of changes were observed in intestinal mucosal structure and function in piglets derived from mothers fed a high or low protein diet. The proportion of vacuolated enterocytes remaining on the top of the villi and the mitosis to apoptosis ratio are two important parameters describing changes of the small intestine maturation. Mucosal histometry data suggest enhanced capacity to take up colostral macromolecules in non-IUGR neonates. Namely, the length of intestinal villi and the number of fetal enterocytes with large lysosomal vacuoles was increased in HP and LP piglets. It is possible that HP and LP piglets are able to absorb more colostrum providing them with extra energy, proteins and biologically active substances (growth factors, hormones, etc) crucial for the stimulation of gut development (32, 33). On the other hand, the physiological process of rebuilding the intestinal epithelium (replacement of fetal-type enterocytes with adult-type enterocytes lacking large lysosomal vacuoles) was markedly inhibited as
PD1 PD28 PD188
non-IUGR IUGR non-IUGR IUGR non-IUGR IUGR
C 2629±494a,B,f 1360±156a,C,D,g 1838±411 1709±83 526±149f 536±50g
HP 1761±487B,h 2632±689C,i 1861±436 1799±296 494±95.0e,h 605±93e,i
TPC
LP 2194±527j 2591±841D,k 1861±222 2076±343 543±119j 504±82k
Statistical level: f,g,h,i,j,k: P<0.05; a,B,C,D: P<0.01; eLJ
: P <0.1 N value = 144 animals C 392±115A,d 324±271e 93.3±41.7 B,C 144±91.6 5.62±4.27d 3.97±0.30e HP 274±102f 334±168g 78.8±18.6B 58.8±24.8 3.28±0.75f 5.45±2.93g LA LP 237±79.4A,h 313±130i 26.4±16.0 C 86.6±78.6 3.64±1.28h 4.10±0.83i
Statistical level: A,d,e,f,g,h,i: P<0.05; BLJ,CLJ
: P<0.1; N value = 133 animals
C 32.4±10.4A,c,e 14.8±3.06B,c,f 117±77.1 181±133 246±54.6e 312±160f
HP 21.5±7.53A,g 33.2±9.00B,h 83.7±28.7 71.5±26.1 299±56.8D,g 219±79.7h
MA
LP 23.5±6.17i 27.7±11.8j 82.0±68.5 120±103 220±71.4D,i 281±71.2j
Statistical level: A,B,c: P<0.05; D,e,f,g,h,i,j: P <0.01; N value = 135 animals
C 3.38±2.82A,c,f 1.37±1.06B,c,g 39.6±24.9 53.5±54.4 163±109D,f 135±72.1g
HP 1.03±0.70A,h 3.44±1.08B,i 34.4±14.3 27.5±12.1 71.4±33.0D,E,h 173±56.5i
SC
LP 1.50±0.40j 1.28±0.45k 28.2±17.2 56.4±39.4 154±75.4E,j 104±35.0k
Statistical level: ALJ,cLJ,f,g,h,i,j,k: P<0.1; B,D,E: P<0.05; N value = 131 animals
C 194±119A,e 116±3.06f 203±49.1C 204±152 76.1±23.2e 84.8±47.5f
HP 210±110B,g 184±80.4h 316±80.7C 191±69.0 91.5±14.2d,g 58.2±15.7d,h
AN
LP 332±150A,B,i 388±276j 256±21.7 292±153 77.5±19.1i 89.0±24.3j
Statistical level: A,B,d: P<0.05; C,e,f,g,h,i,j: P<0.01; N value = 129 animals
Table 6. Total protein content [TPC - mg/kg BW], lactase activity [LA - IU/kg BW], maltase activity [MA - IU/kg BW], saccharase activity [SC - IU/kg BW] and aminopeptidase N activity [AN - 1000 IU/kg BW] relative to body weight (BW) in the mid-jejunum of piglets at 1 (PD1), 28 (PD28) and 188 (PD188) days of age produced by gilds fed either control (C), or high protein (HP) or low protein (LP) diets during pregnancy (mean ±standard deviation). Piglets were classified in two groups according to their birth body weight: intrauterine growth retardation (IUGR) and non-intrauterine growth retardation (non-IUGR). Statistical studies were made using two-way ANOVA analysis of variances with Bonferroni multiple comparisons post-test. Results are indicated for each parameter. Values with same letters were different at the statistical level mentioned.
indicated by a dramatic drop in crypt mitotic activity as well as the reduction of apoptosis. These results are in agreement with previous data derived from rat studies (6). Interestingly, the total protein content in SI mucosal homogenates was lower in LP and HP piglets than in C piglets (Table 6). Within the first 2 days after birth, the protein content reflects not only native cell protein but also colostral proteins (mostly immunoglobulins) taken up by enterocytes. Considering the high contribution of colostral protein to total SI mucosal content (indicated by a high percentage of lysolomal vacuoles), the enterocyte protein synthesis seems to be markedly reduced which corroborates with the delay in rebuilding the intestinal epithelium.
Supporting the above observations, brush border lactase, maltase and saccharidase activities, but not aminopeptidase were reduced in LP and HP piglets as compared to C piglets. One can speculate that this strategy, associated with substantial delay in mucosa rebuilding/maturation, may keep the neonatal gut barrier
open for a longer time thereby enabling greater supply of colostral and milk macromolecules. More studies are necessary to test this hypothesis, since the present study lacked frequent sampling of the gut tissues in the early postnatal period. Nevertheless, non-IUGR HP and LP piglets showed a catch-up growth and normalization of most morphological and functional parameters (such as mucosa thickness, % lysosomal vacuoles, mitotic index, total protein content, maltase activity), within a month after birth except for saccharase activity with HP diet. Reduction in brush border saccharase and lower relative length of SI at birth were the only persistent effects of dietary protein that might affect the piglet’s performance as indicated by the lower body weight at birth. At this point, the consequences of changes in SI relative length are not clear as the body weight is not affected (Table 3). Interestingly, the saccharase activity and the relative length of SI were altered at a later time, which is not consistent with the results obtained in rats.
Fig. 3. GLP2 concentration (pmol/L) in blood plasma on PD28 and PD188 in non-IUGR and IUGR, C, HP and LP piglets. Graph A, B – samples were obtained 30 min before meal, graph C – 30 min after meal, graph D – 1 hour after meal. Data was presented as mean ± standard deviation and subjected to a two-way ANOVA with Bonferroni multiple comparisons post-test. P value: c,d,f,g: P<0.05, a,B,e,h: P<0.01 (values with the same letter were different at the statistical level).
Data derived from the LP piglets concerning body weight and organometry parameters as well as expression of markers of intestinal mucosa (percentage of lysosomal vacuoles, Ki-67 and active caspase-3) suggest that the effects of an LP diet are similar to that observed in HP piglets. However, the effect of an LP diet on luminal digestion during the postnatal period is apparently different from that in a high protein diet, since the lactase activity was decreased and the aminopeptidase N activity was increased, and these effects were maintained at PD28 (NS for aminopeptidase N activity). The decrease in lactase activity could result in a lower digestion of lactose contained in colostrum and milk during the early postnatal period as well as absorption of other macromolecules, in agreement with the data indicating that the maturation of the small intestine was slowed down. The high activity of aminopeptidase N might be explained as an adaptive response to a low amino acid supply via the
placenta. Like in HP-diet piglets, most of the effects of LP diet in non-IUGR piglets are transient, and are not observed in 6 month old pigs (at long term, PD188).
Extended opening of the gut may have negative consequences such as an increased chance for absorption of harmful molecules. Significant, though mild, elevation of mRNA of proinflamatory cytokines found in the gut mucosa of HP and LP compared with C piglets may support this hypothesis. The increase of these mediators as soon as birth could result in exaggerated inflammatory responses with tissue damage and perturbations in intestinal permeability. The decrease in pro-inflamatory cytokines on PD28 suggests a lower intestinal immunity and thus, an increased sensitivity of the piglets towards several pathogenic agents before weaning. Interestingly, significantly elevated Il-1β was also found in 6 month old piglets.
Fig. 4. Concentration of CCK (pmol/L) in blood plasma 30 min before, 30 min after and 1 h after feeding in non-IUGR and IUGR, C, HP and LP piglets. Graph A, B – samples were obtained 30 min before meal, graph C – 30 min after meal, graph D – 1 hour after meal. Data was presented as mean ±standard deviation. Two-way ANOVA analyses of variances with Bonferroni multiple comparisons post-test were used. P value: b,c,d,e,f,g: P<0.05, A: P<0.01 (values with the same letter were different at the statistical level).
Fig. 5. Level of interleukins (IL-1β, TNF-α, IL-8, IL-6) mRNA isolated from mid-jejunum mucosa of non-IUGR, C, HP and LP piglets on PD1, PD28, and PD188. Values are expressed as a relative mRNA copy number. Following the Fisher test on equality of variances, one way ANOVA was used to analyze the differences between the different groups of animals at each time. Values with same letters were different at the statistical level: NT–: P<0.1, A,B,C,D,E,F,G,H,I,J,K,L,M: P<0.05 (values with the same letter were different at the
Concerning regulatory mechanisms, our data suggest minimal or no involvement of plasma CCK in the regulation of enzyme activity, since plasma CCK levels in the piglets were not affected by the maternal diet before meal ingestion and during the postprandial period for each diet, on PD28 and PD188. CCK is a hormone stimulating pancreatic enzyme secretion, and rather not involved directly in SI enzyme secretion (34). Compared with the control group, reduced plasma GLP-2 in HP piglets could affect postnatal development of intestinal mucosa since mitotic and apoptotic indexes, as well as enzyme activities were decreased in these piglets. However, GLP2 does not seem to be implicated in the long-term effect of maternal dietary protein. GLP-2 may be involved in the regulation of SI in non-IUGR piglets, since increase in GLP-2 coincides with changes in SI length.
Development of small intestine mucosa in intrauterine growth retarded (IUGR) piglets
A comparison of data obtained in IUGR and non-IUGR piglets prenatally exposed to the control diet revealed a number of differences in gut development in IUGR piglets. At birth, the relative organ weight, histochemical data including enterocyte mitosis, apoptosis, vacuolization, and the enzymatic activities, were not significantly altered except for the SI length that was decreased. These data are in agreement with a lower growth and maturation of the GIT before birth and probably also to a less satisfactory adaptation to postnatal life. Wu et al. (11) suggested that the major reason for deaths in IUGR piglets after birth is starvation and digestive problems. The differences between IUGR and non-IUGR piglets were transient and disappeared with age. These results are in accordance with findings recently reported by Rehfeldt et al. (21) who have shown no long-term effects of HP diet, and specifically, no changes in internal organ weight on PD188 in HP piglets. This is also in agreement with the body weight which became similar in the both groups. These results can be explained, at least in part, by the catch-up-growth observed in IUGR piglets prenatally exposed to low protein diet. When the mother’s diet is taken into account, new situations appeared. In contrast to Jeffrey et al. (16), we have found that in IUGR piglets there is apparent “sparing” of gut tissue as compared to the non-IUGR group. Both high and low protein content of maternal diet impacted gastrointestinal development in IUGR offspring, but the effect of low protein was short-lasting while the effect of the high protein diet was long term and found on PD188. In contrast to Jeffrey et al. (16) who reported numerous focal lesions in intestinal brush border, we found normal uninterrupted epithelium in IUGR gut, although the tissue was more fragile and thus more difficult to process. The most important finding in IUGR neonates, and to a certain degree explaining difficulties in tissue processing, is significant slowing of gut mucosa maturation as evidenced by vacuolated enterocytes still present on the top of the villi in 4 week old piglets (at weaning). Normally, in the mid jejunum of suckling piglets, large lysosomal vacuoles should not be found after 2 weeks of postnatal life (35, 36). This indicates that the altered uptake of macromolecules by enterocyte lysosomal vacuoles and intracellular digestion affect digestive processes in IUGR’s SI (37-39). Our findings provide an explanation as to how the catch-up-growth is possible in IUGRs suffering from reduced intestinal absorptive area observed in our study as well as by others (16, 17, 40). Interestingly, the vacuolated enterocytes were still present in one month piglets despite high enterocyte turnover evidenced by high mitosis and apoptosis in intestinal mucosa at birth as well as high plasma GLP-2, an important stimulator of mucosa maturation (17). In contrast to D’Inca et al. (18) who reported reduced activity of sucrase and dipeptidyl peptidase IV in IUGR newborn piglets, the picture was
somehow more complicated in our study (Fig. 4) but in most instances the effect of diet on brush border enzyme activities was short-lasting.
Another noteworthy feature of IUGR’s small intestine is the lack of adaptation to the maternal dietary protein intake as compared to the non-IUGR offspring. Furthermore, in IUGRs the long-term (PD188) effect of HP diet at the digestive level is more pronounced than the effect of the LP diet. Thus, SI length and total SI protein content were decreased, while aminopeptidase N activity was increased in IUGR HP piglets on PD188. But this effect remains very small and in many instances the results in histometry, mitosis, apoptosis and enzyme activity in IUGRs did not differ from non-IUGR controls. According to our results, non-IUGR animals are adaptive to dietary protein changes (41). Furthermore, our study indicates changes in caspase-3 expression in response to maternal dietary protein level. Caspase-3 is a marker of cell apoptosis and plays a major role in intestine epithelial cell exchange (42, 43). The expression of caspase-3 corroborated with the length of villi and the lack of adaptation to maternal diet. Moreover, we have observed that maternal HP-diet in non-IUGRs had an effect until PD28 suggesting a strong delay in the development of SI villi. Globally, it seems that SI in IUGR piglets is “blind”, and may not properly respond to the diet and/or dietary needs of the organism. The mechanisms involved in the response of the developing SI to dietary protein level during gestation as well as well as its possible long-term effect contributing to metabolic syndrome in adults, in IUGRs require further studies. These mechanisms could involve another part of the GIT (pancreas, liver, etc.) as suggested by the hepatic gene expression of energy sensing pathways (44) and at the metabolic level as demonstrated by body composition (3, 10, 45).
In conclusion, our data indicate that the protein level of the maternal diet during pregnancy affects the percentage of IUGR offspring as well as the development of the small intestine in both IUGR and the non-IUGR littermates. In offspring prenatally exposed to a diet deficient in proteins, the luminal digestion during the postnatal period appears to be different from that of the offspring prenatally exposed to a diet containing excess protein. Our data indicate that the maturation of the small intestine is delayed, and the enterocyte barrier opened for a longer time in IUGRs as compared to non-IUGRs. The changes associated with the delayed maturation of small intestine may contribute to the catch-up growth observed in these piglets, but may also have negative consequences in regard to the absorption of harmful macromolecules. Moreover, the intestinal mucosa of IUGRs lacks adaptation to changes in feeding programming, with some modifications of the gastrointestinal tract persisting until adolescence. Maternal dietary protein level also affects the pro-inflammatory cytokine profiles in the offspring. It is suggested that the GLP2, but not CCK could be implicated in these modifications. More studies are needed to clarify both the relationships between early nutritional environment and gastrointestinal tract development in the pig as well as the possible regulatory mechanisms. It is likely that data derived from our porcine studies can contribute to a better understanding of nutritional programming during human development (19, 48).
Acknowledgements: Research financed by: German Academic Exchange Service (PROCOPE) - Deutsche Forschungsgemeinschaft (DFG) ME 1420/8-1(PAK24); INRA SENAH, Saint Gilles, France & INRA Departments PhASE and AlimH, and Polish Ministry of Science and Higher Education (grant nr.: 5934/B/P01/2010/38). M.M. was awarded a scholarship “Potencial naukowy wsparciem dla gospodarki Mazowsza – stypendia dla doktorantow” realized in frame of “Regionalne kadry
gospodarki” VIII Priority, Operation 8.2 “Transfer of knowledge” Sub-Operation 8.2.2. “Regionalne Strategie Innowacji Programu Operacyjnego Kapitalu Ludzkiego 2007 – 2013”, co-financed by European Union and Polish National Budget.
Authors thank to E. Sajdel-Sulkowska, D.Sc., (Harvard Medical School) for reading manuscript and valuable discussion and to H. Sievert, Dr. B. Stabenow, Dr. O. Bellmann and colleagues (all Leibniz Institute for Farm Animal Biology) for animal feeding and care, and medical attention. Dr. U. Hennig, Dr. C. Rehfeldt, and Dr. W. Otten are acknowledged for formulating the diets, and designing their support-in the animal study, respectively.
Conflict of interests: None declared.
REFERENCES
1. Metges CC, Lang IS, Hennig U, et al. Intrauterine growth retarded progeny of pregnant sows fed high protein: low carbohydrate diet is related to metabolic energy deficit. PLoS One 2012; 7: e31390,
2. Mahan DC. Effect of feeding various gestation and lactation dietary protein sequences on long-term reproductive performance in swine. J Anim Sci 1977; 45: 1061-1072. 3. Rehfeldt C, Lefaucheur L, Block J, et al. Limited and excess
protein intake of pregnant gilts differently affects body composition and cellularity of skeletal muscle and subcutaneous adipose tissue of newborn and weanling piglets. Eur J Nutr 2012; 51: 151-165.
4. Daenzer M, Ortmann S, Klaus S, Metges CC. Prenatal high protein exposure decreases energy expenditure and increases adiposity in young rats. J Nutr 2002; 132: 142-144. 5. Gutierrez JM, Alvarez-Ordas I, Fernandez S, Marin B,
Menendez-Patterson A. Effects of malnutrition in utero and during lactation on various parameters of the small intestine in rats. Rev Esp Fisiol 1988; 44: 413-421.
6. Baserga M, Bertolotto C, Maclennan NK, et al. Uteroplacental insufficiency decreases small intestine growth and alters apoptotic homeostasis in term intrauterine growth retarded rats. Early Hum Dev 2004; 79: 93-105. 7. Qiu S, Tan SS, Zhang JA, et al. Apoptosis induced by
curcumin and its effect on c-myc and caspase-3 expressions in human melanoma A375 cell line. Di Yi Jun Yi Da Xue Xue Bao. 2005; 25: 1517-1521.
8. Kucia M, Langhammer M, Gors S, et al. High protein diet during gestation and lactation affects mammary gland mRNA abundance, milk composition and pre-weaning litter growth in mice. Animal 2011; 5: 268-277.
9. Du M, Yan X, Tong JF, Zhao J, Zhu MJ. Maternal obesity, inflammation, and fetal skeletal muscle development. Biol Reprod 2010; 82: 4-12.
10. Rehfeldt C, Lang IS, Gors S, et al. Limited and excess dietary protein during gestation affects growth and compositional traits in gilts and impairs offspring fetal growth. J Anim Sci 2011; 89: 329-341.
11. Wu G, Bazer FW, Wallace JM, Spencer C. Intrauterine growth retardation: Implications for the animal sciences. J Anim Sci 2006; 84: 2316-2337.
12. Dicke JM, Henderson GI. Placental amino acid uptake in normal and complicated pregnancies. Am J Med Sci 1988; 295: 223-227.
13. Glazier JD, Cetin I, Perugino G, et al. Association between the activity of the system A amino acid transporter in the microvillous plasma membrane of the human placenta and severity of fetal compromise in intrauterine growth restriction. Pediatr Res 1997; 42: 514-519.
14. Hales CN, Barker DJ. Type 2 (non-insulin-dependent) diabetes mellitus: the thrifty phenotype hypothesis. Diabetologia 1992; 35: 595-601.
15. Thornbury JC, Sibbons PD, van Velzen D, Trickey R, Spitz L. Histological investigations into the relationship between low birth weight and spontaneous bowel damage in the neonatal piglet. Pediatr Pathol 1993; 13: 59-69.
16. Jeffrey GP, Basclain KA, Allen TL Molecular regulation of transferrin receptor and ferritin expression in the rat gastrointestinal tract. Gastroenterology 1996; 110: 790-800.
17. Sangild PT, Malo C, Schmidt M, et al. Glucagon-like peptide 2 has limited efficacy to increase nutrient absorption in fetal and preterm pigs. Am J Physiol Regul Integr Comp Physiol 2007; 293: R2179-R2184.
18. D’Inca R, Gras-Le Guen C, Che L, Sangild PT, Le Huerou-Luron I. Intrauterine growth restriction delays feeding-induced gut adaptation in term newborn pigs. Neonatology 2011; 99: 208-216.
19. Guilloteau P, Zabielski R, Hammon HM, Metges CC. Nutritional programming of gastrointestinal tract development. Is the pig a good model for man? Nutr Res Rev 2010; 23: 4-22.
20. Gesellschaft fur Ernahrungsphysiologie (GfE) Empfehlungen zur Energie- und Nahrstoffversorgung von Schweinen (Recommendations of energy and nutrient intake in pigs). Frankfurt am Main, Germany, DLG-Verlags-GmbH, 2006.
21. Rehfeldt C, Stabenow B, Pfuhl R, et al. Effects of limited and excess protein intakes of pregnant gilts on carcass quality and cellular properties of skeletal muscle and subcutaneous adipose tissue in fattening pigs. J Anim Sci 2012; 90: 184-196.
22. Godlewski MM, Slupecka M, Wolinski J, et al. Into the unknown-the death pathways in the neonatal gut epithelium. J Physiol Pharmacol 2005; 3: 7-24.
23. Godlewski MM, Bierla JB, Strzalkowski A, et al. A novel cytometric approach to study intestinal mucosa rebuilding in weaned pigs fed with dietary nucleotides. Livest Sci 2009; 123: 215-220.
24. Hartree EF Determination of protein: a modification of the Lowry method that gives a linear photometric response. Anal Biochem 1972; 48: 422-427.
25. Dahlquist A. Assay of intestinal disaccharidases. Scand J Lab Invest 1964; 44: 169-172.
26. Maroux S, Louvard D, Baratti J. The aminopeptidase from hog intestinal brush border. Biochim Biophys Acta 1973; 321: 282-295.
27. Meissonnier GM, Pinton P, Laffitte J, et al. Immunotoxicity of aflatoxin B1: Impairment of the cell-mediated response to vaccine antigen and modulation of cytokine expression. Toxicol Appl Pharmacol 2008; 231: 142-149.
28. Grenier B, Loureiro-Bracarense AP, Lucioli J, et al. Individual and combined effects of subclinical doses of deoxynivalenol and fumonisins in piglets. Mol Nutr Food Res 2011; 55: 761-771.
29. Bracarense APFL, Lucioli J, Grenier B, et al. Chronic ingestion of deoxynivalenol and fumonisin, alone or in interaction, induces morphological and immunological changes in the intestine of piglets. Br J Nutr 2011; Sep 22: 1-11.
30. Peirson SN, Butler JN, Foster RG. Experimental validation of novel and conventional approaches to quantitative real-time PCR data analysis. Nucl Acids Res 2003; 31: e73. 31. Hartmann B, Johnsen AH, Orskov C, Adelhorst K, Thim L,
Holst JJ. Structure, measurement and secretion of human glucagon-like peptide-2. Peptides 2000; 21: 73-80.
32. Trahair JF, Robinson PM. Enterocyte ultrastructure and uptake of immunoglobulins in the small intestine of the neonatal lamb. J Anat 1989; 166: 103-111.
33. Kelly D, King TP, McFadyen M, Travis AJ. Effect of lactation on the decline of brush border lactase activity in neonatal pigs. Gut 1991; 32: 386-392.
34. Jaworek J, Nawrot-Porabka K, Leja-Szpak A, Konturek SJ. Brain-gut axis in the modulation of pancreatic enzyme secretion. J Physiol Pharmacol 2010; 61: 523-531. 35. Baintner K. Transmission of antibodies from mother to
young: evolutionary strategies in a proteolytic environment. Vet Immunol Immunopathol 2007; 117: 153-161.
36. Skrzypek T, Valverde Piedra JL, Skrzypek H, et al. Intestinal villi structure during the development of pig and wild boar crossbreed neonates. Livest Sci 2007; 109: 38-41.
37. Markowska-Daniel I, Pomorska-Mol M, Pejsak Z. Dynamic changes of immunoglobulin concentration in pig colostrum and serum around parturition. Pol J Vet Sci 2010; 13: 21-27. 38. Rehfeldt C, Renne U, Sawitzky M, Binder G, Hoeflich A. Increased fat mass, decreased myofiber size, and a shift to glycolytic muscle metabolism in adolescent male transgenic mice overexpressing IGFBP-2. Am J Physiol Endocrinol Metab 2010; 299: E287-E298.
39. Oste M, De Vos M, Van Haver E, et al. Parenteral and enteral feeding in preterm piglets differently affects extracellular matrix proteins, enterocyte proliferation and apoptosis in the small intestine. Br J Nutr 2010; 104: 989-997.
40. Zhong X, Wang T, Zhang X, Li W. Heat shock protein 70 is up-regulated in the intestine of intrauterine growth retardation piglets. Cell Stress Chaperones 2010: 15: 335-342.
41. Nichols BL, Dudley MA, Nichols VN, et al. Effects of malnutrition on expression and activity of lactase in children. Gastroenterology 1997; 112: 742-751.
42. Kumar S. Mechanisms mediating caspase activation in cell death. Cell Death Differ 1999; 6: 1060-1066.
43. Grossman J, Walther K, Artinger M, et al. Induction of apoptosis before shedding of human intestinal epithelial cells. Am J Gastroenterol 2002; 97: 1421-1428.
44. Oster M, Murani E, Metges CC, Ponsuksili S, Wimmers K. A high protein diet during pregnancy affects hepatic gene expression of energy sensing pathways along ontogenesis in a porcine model. PLoS One 2011; 6: e21691.
45. Rehfeldt C, Kuhn G. Consequences of birth weight for postnatal growth performance and carcass quality in pigs as related to myogenesis. J Anim Sci 2006; 84: E113-E123. 46. Pinton P, Braicu C, Nougayrede JP, Laffitte J, Taranu I,
Oswald IP. Deoxynivalenol impairs porcine intestinal barrier function and decreases the protein expression of claudin-4 through a mitogen-acitivated protein kinase-dependent mechanism. J Nutr 2010; 140: 1956-1962. 47. Devriendt B, Gallois M, Verdonck F, et al. The food
contaminant fumonisin B(1) reduces the maturation of porcine CD11R1(+) intestinal antigen presenting cells and antigen-specific immune responses, leading to a prolonged intestinal ETEC infection. Vet Res 2009; 40: 40-44. 48. Szczepanska-Sadowska E, Cudnoch-Jedrzejewska A,
Ufnal M, Zera T. Brain and cardiovascular diseases: common neurogenic background of cardiovascular, metabolic and inflammatory diseases. J Physiol Pharmacol 2010; 61: 509-521.
R e c e i v e d : February 29, 2012 A c c e p t e d : May 28, 2012
Author’s address: Prof. Romuald Zabielski, Warsaw University of Life Sciences, 159 Nowoursynowska Street, 02-776 Warsaw, Poland; E-mail: rzabielski@plusnet.pl


![Table 6. Total protein content [TPC - mg/kg BW], lactase activity [LA - IU/kg BW], maltase activity [MA - IU/kg BW], saccharase activity [SC - IU/kg BW] and aminopeptidase N activity [AN - 1000 IU/kg BW] relative to body weight (BW) in the mid-jejunum of p](https://thumb-eu.123doks.com/thumbv2/123doknet/14405130.510649/10.892.167.734.218.704/protein-activity-activity-saccharase-activity-aminopeptidase-activity-relative.webp)