Compressive sensing with local geometric features
The MIT Faculty has made this article openly available.
Please share
how this access benefits you. Your story matters.
Citation
Rishi Gupta, Piotr Indyk, Eric Price, and Yaron Rachlin. 2011.
Compressive sensing with local geometric features. In Proceedings
of the 27th annual ACM symposium on Computational geometry
(SoCG '11). ACM, New York, NY, USA, 87-96.
As Published
http://dx.doi.org/10.1145/1998196.1998211
Publisher
Association for Computing Machinery (ACM)
Version
Author's final manuscript
Citable link
http://hdl.handle.net/1721.1/73013
Terms of Use
Creative Commons Attribution-Noncommercial-Share Alike 3.0
Compressive Sensing with Local Geometric Features
Rishi Gupta MIT Piotr Indyk MIT Eric Price MIT Yaron Rachlin Draper Laboratory 23 March 2011 AbstractWe propose a framework for compressive sensing of images with local geometric features.
Specifically, let x ∈ RN be an N -pixel image, where each pixel p has value x
p. The image is
acquired by computing the measurement vector Ax, where A is an m × N measurement matrix for some m N . The goal is then to design the matrix A and recovery algorithm which, given Ax, returns an approximation to x.
In this paper we investigate this problem for the case where x consists of a small number (k) of “local geometric objects” (e.g., stars in an image of a sky), plus noise. We construct a matrix A and recovery algorithm with the following features: (i) the number of measurements m
is O(k logkN ), which undercuts currently known schemes that achieve m = O(k log(N/k)) (ii)
the matrix A is ultra-sparse, which is important for hardware considerations (iii) the recovery algorithm is fast and runs in time sub-linear in N . We also present a comprehensive study of an application of our algorithm to a problem in satellite navigation.
1
Introduction
In recent years, a new “linear” approach for acquiring digital images has been discovered [CRT06, Don06]. Traditional approaches to image acquisition first capture an entire N -pixel image and then process it for compression, transmission, or storage. In contrast, the new approach obtains a com-pressed representation directly, by acquiring a small number of nonadaptive linear measurements of the signal in hardware. Formally, for an image represented by a vector x, the representation is equal to Ax, where A is an m × N matrix. The advantage of this architecture is that it can use fewer sensors, and therefore can be cheaper and use less energy than a conventional cam-era [DDT+08, FTF06, Rom09].
In order to reconstruct the image x from a lower-dimensional measurement vector (or sketch) Ax, one needs to assume that the image x is k-sparse for some k (i.e., it has at most k non-zero coordinates) or at least be “well-approximated” by a k-sparse vector. Then, given Ax one finds (an approximation to) x by performing sparse recovery. The latter problem is typically defined as follows: construct a matrix A such that, for any signal x, we can recover a vector ˆx from Ax satisfying
kx − ˆxk1 ≤ C · Err1k(x) (1) where Err1k(x) = mink-sparse x0kx − x0k
1 and C is the approximation factor. Note that if x is
k-sparse, then Err1k(x) = 0, and therefore ˆx = x. Although the main focus of this paper is signal acqusition, sparse recovery has applications to other areas such as data stream computing [Mut05, Ind07].
The problem of designing matrices A and corresponding recovery algorithms has been a subject of extensive study over the last few years, with the goal of designing schemes that enjoy good com-pression rate (i.e., low values of m) as well as good algorithmic properties (i.e., low encoding and recovery times). It is known by now that there exist binary matrices A and associated recovery algo-rithms that produce approximations ˆx satisfying Equation (1) with constant approximation factor C and sketch length m = O(k log(N/k)). In particular, a random Bernoulli matrix [CRT06] or a
ran-dom binary matrix with column sparsity O(log(N/k))
[BGI+08] has this property with overwhelming probability. It is also known that this sketch length is asymptotically optimal [DIPW10, FPRU10]. See [GI10] for an overview.
In this paper we focus on sparse recovery with ultra-low encoding complexity, i.e., constant or “almost-constant” column sparsity. In addition, the matrices we construct are binary: all entries are either 0 or 1. Apart from general interest, our research is motivated by certain architectures for compressive imaging hardware that acquire all the compressive measurements concurrently by implementing the matrix multiply Ax. In particular, our “folding” measurements described in section 4 are readily implementable on systems that use optically multiplexed imaging [UGN+09, TAN10]. For optical measurement architectures, due to the Poisson distributed shot noise affecting photon counting devices [HL07], splitting the signal in components of x can decrease the signal to noise ratio by as much as the square root of the column sparsity. Other potential advantages of ultra-low encoding complexity in electronic compressive imagers include reduced interconnect complexity [Mei03], low memory requirements for storing the measurement matrix, and gain in image acquisition speed due to reduced operations.
Unfortunately, it is known [Nac10] that any deterministic scheme with guarantee as in Equa-tion 1 requires column sparsity of Ω(log(N/k)). In the randomized case, where A is a random variable, and Equation 1 is required to hold only with constant probability over the choice of A, the same paper shows that any binary matrix A must have column sparsity as stated.
First, we consider a class of images that possesses additional geometric structure (see next para-graph). Second, we relax the recovery guarantee, by requiring that only a constant fraction of the non-zero entries of the vector x are recovered correctly.
Model description
Our model for sparse images is motivated by astronomical imaging, where an image contains a small number of distinguishable objects (e.g., stars) plus some noise. We model each object as an image contained in a small w × w bounding box, for some constant w. The image is constructed by placing k objects in the image in an arbitrary fashion, subject to a minimum separation constraint. The image is then modified by adding noise. We formalize the notions of minimum separation constraint, distinguishability, and noise in the rest of this section.
Let x be an N -dimensional real vector, and assume N = n2 for an integer n. We will treat x both as a vector and as an n × n matrix, with entries x[i, j] for i, j ∈ [n]. An object o is a w × w real matrix. Let O = {o1. . . ok} be a sequence of k objects, and let T = {t1. . . tk} be a
sequence of translations in x, i.e., elements from [n − w]2. We say that T is valid if for any i 6= j the translations ti and tj do not collide, i.e., we have kti− tjk∞ ≥ w0 for some separation parameter
w0 = Ω(w). For o ∈ O and t = (tx, ty) ∈ T , we define t(o) to be a w × w matrix indexed by
{tx. . . tx+ w − 1} × {ty. . . ty+ w − 1}. The ground truth image is then defined as x =Pit(oi).
During our algorithm, we impose a grid G on the image with cells of size w0× w0. Let x c be
the image (i.e., an w02-dimensional vector) corresponding to cell c. We then use a projection F that maps each sub-image xc into a feature vector F (xc). If y ∈ xc for some cell c, we use F (y) to
denote F (xc) after the entries of xc\ y are set to 0. If y is not a cell and not contained in a cell,
we leave F (y) undefined.
The distinguishability property we assume is that for any two distinct o, o0 from the objects O ∪ {∅}, and for any two translations t and t0, we have kF (t(o)) − F (t0(o0))kΓ > T (when it is
defined) for some threshold T > 0 and some norm k · kΓ. In other words, different objects need
to look different under F . For concreteness, the features we exploit in the experimental section are the magnitude (the sum of all pixels in the cell) and centroid (the sum of all pixels in the cell, weighted by pixel coordinates), since the magnitudes of stars follow a power law, and the centroid of a star can be resolved to .15 times the width of a pixel in each dimension. The distinguishability constraint is what ultimately allows us to undercut the usual lower bound by a factor of log k.
The observed image x0 is equal to x + µ, where µ is a noise vector. The threshold T determines the total amount of noise that the algorithm tolerates. Specifically, let kµkF =PckF (µc)kΓ, where
µc is the noise corresponding to cell c. We assume that kµkF < γkT for some constant γ > 0, and
make no other assumptions about the noise. Theoretical result
Our results assume sparsity parameter k ≥ C log N for some constant C. We construct a distribution over random binary m × N matrices A, such that given Ax0 for x0 described above, we recover (with constant probability) a set D of k cells, such that at least k/2 of the cells fully containing an object are included in D1. The matrix has column sparsity O(logkN ). Note that if (say) k = N1/2, then the column sparsity is constant. Moreover, the matrix A has only m = O(k logkN ) rows.
1A simple extension of the algorithm can then recover an approximation to x
Empirical results
Our theoretical model is motivated by a task in satellite navigation formally known as attitude (i.e., orientation) determination. Many satellites compute their attitude by acquiring a picture of the night sky, extracting stars from the picture, and matching patterns of stars to an onboard database. We implement a standard attitude determination routine, with the picture aquisition and star extraction steps replaced with a simplified version of the algorithm presented in this paper. Our algorithm performs better recovery on small numbers of measurements and is orders of magnitude faster than comparable compressive sensing methods.
Our techniques
Our construction of the measurement matrix resembles those of other algorithms for sparse matrices, such as Count-Sketch [CCF02] or Count-Min [CM04]: we “hash” each cell c s = O(logkN ) times into s arrays of q = O(k) “buckets”, and sum all cells hashed to the same bucket. Each bucket defines one measurement of w02 pixels, which gives m = O(k logkN ). Hashing is done by using either the Chinese Reminder Theorem codes (i.e., “modulo prime” hashing) or Reed-Solomon codes. Both hash functions are standard in the literatue. It should be noted though that unlike in other scenarios, our use of CRT codes does not incur any additional polylogarithmic factors that typically lead to sub-optimal results.
The recovery process is based on the following novel approach. For simplicity, assume for now that the image contains no noise, and ignore the effect of two different objects being hashed to the same bucket. In this case, all buckets containing distinct objects are distinguishable from each other. Therefore, we can group non-empty buckets into k clusters of size s, with each cluster containing buckets with a single value. Since qs> N , each cluster of buckets uniquely determines the cell in x containing the object in those buckets.
In order to make this approach practical, however, we need to make it robust to errors. The errors are due to distinct objects being hashed to the same bucket, the noise vector µ, and the grid cutting objects into pieces. Because of these issues, the clustering procedure aims to find clusters containing elements that are close to each other, rather than equal, and the procedure allows for some small fraction of outliers. For this purpose, we use the approximation algorithm for the k-center problem with outliers [CKMN01], which correctly clusters “most” of the buckets. To handle the (small fraction of the) buckets that are grouped incorrectly, we construct our hash function using a constant rate error-correcting code.
2
Hashing
Our scheme works by “hashing” each cell c into s different arrays of size O(k). We can think of this as a mapping f from [N ] to [O(k)]s. As long as each character of the mapping is (approximately) pairwise independent, then in expectation most of the k objects will be alone in most of the array locations they map to. Our reconstruction algorithm will cluster the values in the cells, giving us a noisy version y0 of the true codeword y = f (c) with a constant fraction of errors. We then need to efficiently decode from y0 to c.
Hence, we need an efficient error correcting code that is also approximately pairwise independent in each character. This section gives precise definitions of our requirements, then gives two codes achieving them.
2.1 Definitions
Definition 2.1. A hash family H of functions h : A → B is pairwise-independent if, for any x1, x2 ∈ A and y1, y2 ∈ B with x16= x2, we have Prh∈H[h(x1) = y1∩ h(x2) = y2] = |B|12.
In many of our applications the range B is the product of s “symbols” B1× · · · × Bs. For a
function f : A → B and i ∈ [s], we use fi(x) to denote the ith coordinate of f .
When B is a product space, we will sometimes settle for a weaker notion of pairwise indepen-dence. Rather than requiring pairwise independence for the whole range, we only require pairwise independence in each coordinate:
Definition 2.2. Let B = B1× · · · × Bs. A hash family H of functions h : A → B is
coordinate-wise C-paircoordinate-wise-independent if, for all i ∈ [s], any x1 6= x2 ∈ A, and all y1, y2 ∈ Bi, we have
Prh∈H[hi(x1) = y1∩ hi(x2) = y2] ≤ |BC i|2.
Definition 2.3. Let B = B1× · · · × Bs. A function f : A → B is C-uniform if, for all i ∈ [s] and
all y ∈ Bi, Prx∈A[fi(x) = y] ≤ |BCi|.
Definition 2.4. For any function f : B → D and family H of functions h : A → B, f ◦ H denotes the family of A → D functions {g(x) = f (h(x)) | h ∈ H}.
Claim 2.5. If H is pairwise-independent and f is C-uniform, then f ◦ H is coordinatewise C2 -pairwise-independent.
Proof. Let H be A → B and f be B → D = D1× · · · × Ds. Then for any i ∈ [s], any x16= x2 ∈ A,
and all y1, y2 ∈ Di we have:
Pr h∈H[fi(h(x1)) = y1∩ fi(h(x2)) = y2] = X z1,z2∈B Pr h∈H[h(x1) = z1∩ h(x2) = z2∩ fi(z1) = y1∩ fi(z2) = y2] = X z1,z2∈B 1 |B|2Pr [fi(z1) = y1∩ fi(z2) = y2] = Pr z1,z2∈B [fi(z1) = y1∩ fi(z2) = y2] = Pr z1∈B [fi(z1) = y1] Pr z2∈B [fi(z2) = y2] ≤ C 2 |Bi|2 as desired.
Definition 2.6. We say that a function f : A → B for B = B1×· · ·×Bsis an error-correcting code
of distance d if, for any two distinct x1, x2 ∈ A, f (x1) and f (x2) differ in at least d coordinates.
We say that f is efficiently decodable if we have an algorithm f−1 running in logO(1)|B| time with f−1(y) = x for any x ∈ A and y ∈ B such that f (x) and y differ in fewer than d/2 coordinates. For any prime P ≥ N , the function family HP : ax + b (mod P ) for a, b ∈ [P ] is pairwise
independent when viewed as a set of functions from [N ] to [P ].
Lemma 2.7. If f is an efficiently decodable error-correcting code with distance d, then so is f ◦ h for every h ∈ HP with a 6= P .
Proof. Since a 6= P , there exists an a−1 modulo P , and we can efficiently compute it. Hence h is injective, so f ◦ h is an error-correcting code of distance d. Furthermore, (f ◦ h)−1(x) = a−1(f−1(x) − b) (mod P ) is efficiently computable.
Definition 2.8. We say that a family G of functions
g : A → B1 × · · · × Bs is a (C, N, s, d)q-independent-code if G is coordinatewise C-pairwise
in-dependent, q ≤ |Bi| < 2q for all i ∈ [s], |A| ≥ N , and with probability at least 1 − 1/N over g ∈ G
we have that g is efficiently decodable with distance d.
If f : A0 → B1× · · · × Bs is C-uniform and efficiently decodable with distance d and |Bi| ≥ q
for all i, then f ◦ HP is a (C2, N, s, d)q-independent code.
2.2 Two code constructions
We explicitly give two (4, N, s, s − r)q-independent codes. Both are achievable for any parameters
with 2N < qr and s < q/ log q (and the first code allows any s < q). We let P be a prime in {1
2q
r, . . . , qr}.
Reed-Solomon code
Let q ≥ s. The Reed-Solomon code fRS: [qr] → [q]s is defined for f (x) by (i) interpreting x as an
element of Frq, (ii) defining χx∈ Fq[ξ] to be the rth degree polynomial with coefficients corresponding
to x, and (iii) outputting f (x) = (χx(1), . . . , χx(s)). It is well known to have distance s − r and to
be efficiently decodable [Jus76].
Claim 2.9. Let f : [P ] → [q]s be the restriction of fRS to [P ]. Then f is 2-uniform.
Proof. We know that fRS is 1-uniform. Since P ≥ qr/2, f is 2-uniform.
Hence GRS = f ◦ HP is a (4, N, s, s − r)q-independent code.
Chinese Remainder Theorem (CRT) code
Let p1, . . . , ps ∈ [q, 2q] be distinct primes; note that the asymptotic distribution of prime numbers
implies q/ log q = Ω(s). Hence for any x ∈ [N ], any r of the residues mod p1, . . . , ps uniquely
identify x. The CRT code fCRT: [P ] → [p1] × . . . × [ps] is defined by taking the residues modulo
each prime. It has distance s − r and is efficiently decodable [GRS99]. Claim 2.10. The CRT code fCRT is 2-uniform.
Proof. Let i ∈ [s]. The projection of fCRT onto its ith coordinate is one-to-one over a domain
that is any consecutive sequence of pi integers. Hence over the domain [P ], the ratio between the
likelihood of the most common and the least common values in the range is dP/pie bP/pic ≤ 2.
2.3 Collisions
Lemma 2.11. Suppose g : A → B1× . . . × Bs is drawn from a (4, N, s, s − r)q-independent code.
Let S, S0⊂ A. Define the set of “colliding” symbols
C = {(a, i) | a ∈ S, i ∈ [s], ∃a0 ∈ S0 s.t. gi(a) = gi(a0), a 6= a0}
With probability at least 7/8, |C| ≤ 32 |S| |S0| s/q. Proof. We observe that
E[|C|] = X i∈[s] X a∈S Pr[(a, i) ∈ C] ≤ X i∈[s] X a∈S X a0∈S0 a06=a Pr[gi(a) = gi(a0)] = X i∈[s] X a∈S X a0∈S0 a06=a X z∈Bi Pr[gi(a) = z ∩ gi(a0) = z] ≤ X i∈[s] X a∈S X a0∈S0 a06=a X z∈Bi 4 |Bi|2 ≤ s |S| S0 4/q
Hence, by Markov’s inequality, |C| ≤ 32 |S| |S0| s/q with probability at least 7/8.
3
Recovery
In this section we present the measurement matrix A and the recovery algorithm. A graphical representation of the algorithm is presented in Appendix B. Let O = {o1. . . ok} be a sequence of k
features, and let T = {t1. . . tk} be a sequence of (non-colliding) translations in x. Also, let µ be the
noise vector, and let x0 be the noisy image. Finally, we introduce (small) constants α, β, γ, δ, η > 0, whose values will be determined in the course of the analysis.
At the beginning, we impose a square grid G with w0 × w0 cells on the image x0, such that
w0 = w/α. The grid is shifted by a vector v chosen uniformly at random from [w0]2. Let S0 be
the set of cells that intersect or contain some object ti(oi), and S ⊂ S0 be the set of cells that
fully contain some object ti(oi). Observe that a fixed object is fully contained in some cell with
probability (1 − w/w0)2 > 1 − 2α, since each axis of the grid intersects the object with probability
w/w0. This implies that the expected number of cells in S0− S is at most 2αk, which implies by Markov that |S0− S| ≤ 16αk with probability 7/8. From now on, we will assume the latter event holds. Let k0= |S0|. We choose α > 0 such that k0 ≤ 2k.
Measurements
Our measurement matrix A is defined by the following linear mapping. Let G denote the set of cells. Let g : G → B = B1 × · · · × Bs be drawn from a (4, N, s, 4(3δ + β)s)q-independent code
(such as either GRS or GCRT). Moreover, we require that k/q ≤ η; such a code is achievable
q(1−3(3δ+β))s > ks/2 > 2N and s < log N/ log k ≤ q/ log q). For each i = 1 . . . s, we define a |Bi|-dimensional vector zi whose entries are elements in Rw02, such that for any j
zij = X
gi(c)=j
x0c
That is, we “hash” all cells into |Bi| ≥ q buckets, and sum all cells hashed to the same bucket. The
measurement vector z = Ax0 is now equal to a concatenation of vectors z1. . . zs. Note that the dimension of z is equal to m = w02P |Bi| = O(qs) = O(k logkN ).
Recovery algorithm
The recovery algorithm starts by identifying the buckets that likely contain the cells from S, and labels them consistently (i.e., two buckets containing cells from S should receive the same label), allowing for a small fraction of errors. We then use the labels to identify the cells.
The algorithm is as follows. For a set of pairs X, let F (X) denote {F (zi
j) : (i, j) ∈ X}.
1. Identify R = {(i, j) : kF (zji)kΓ≥ T /2} (that is, Ri contains the “heavy cells” of the
measure-ment vector z).
2. Partition R into sets R0, R1, . . . , Rk such that |R0| ≤ δsk, and such that for each 1 ≤ l ≤ k
the diameter of F (Rl) is at most T /2.
3. For each label l = 1 . . . k, create a vector ul ∈ B such that for each i = 1 . . . s, ul
i = j if
(i, j) ∈ Rl (if there are many such j, ties are broken arbitrarily), or uli =⊥ (an arbitrary erasure symbol) if no such j exists.
4. For each label l = 1 . . . k apply the decoding algorithm2 for g to ul, obtaining a (possibly invalid) decoded cell dl.
We analyze the algorithm by keeping track of the errors at each step. Step 1 For any cell c ∈ S and i = 1 . . . s, we say that i preserves c if kF (zgi
i(c)) − F (xc)kΓ ≤ T /24
and gi(c0) 6= gi(c) for all other c0 ∈ S. That is, there is no collision from the hashing process, and
the total amount of distortion due to the noise µ is small. Let P = {(i, gi(c)) : i preserves c}. Note
that P ⊂ R. We show that P is large and that most of R is in P . Lemma 3.1. With probability at least 7/8,
|P | ≥ (1 − β)sk.
Proof. Consider any pair (c, i) ∈ S × {1 . . . s}, and let j = gi(c). If i does not preserve c, it must be
because either (i) there is another cell c0 ∈ S0, c0 6= c such that gi(c0) = j, or because (ii) the total
noise affecting zij, equal to F (µij) ≤P
gi(c)=jF (µc), has norm at least T /24.
By Lemma 2.11 with probability at least 7/8 the number of pairs affected by (i) is at most 32ks|S0|/q. The event (ii) is determined by the noise vector µ. However, for each i, there are at most kµkF
T /24 ≤ 24γk additional cells c ∈ S that are not preserved under i due to this reason.
Altogether, the total number of pairs (c, i) such that c is not preserved by i is at most 32sk S0 /q + 24γsk = [32η(1 + 16α) + 24γ]sk = βsk
as desired.
2Technically, we replace each ⊥ in ulwith an arbitrary j before running the decoding algorithm, since the decoding
Lemma 3.2. With probability at least 3/4,
|R \ P | ≤ δsk.
Proof. Any element (i, j) of R \ P (“heavy but not preserved”) must belong to one of the following three categories:
1. j = gi(c) for c ∈ S such that c is not preserved by i. By the previous lemma, there are at
most βsk such pairs (c, i) with probability at least 7/8.
2. j = gi(c) for some cell c ∈ S0\ S. There are at most 16αsk such pairs (c, i), with probability
at least 7/8.
3. The vector F (µij) =P
gi(c)=jF (µc) has norm at least T /2. There are at most 2γsk such pairs
(i, j).
This implies that with probability at least 3/4 the total number of pairs (i, j) ∈ R \ P is at most (β + 16α + 2γ)sk = δsk
as desired.
Step 2 Observe that the elements of F (P ) can be clustered into k clusters of diameter T /12. Thus, by the previous lemma, there is a k-clustering of all but δsk elements of F (R) such that the diameter of each cluster is at most T /12. We now apply a 6-approximation algorithm for this problem, finding a k-clustering of F (R) such that the diameter of each cluster is at most T /2. Such an approximation algorithm follows immediately from the 3-approximation algorithm for k-center with outliers given in [CKMN01].
Step 3 Consider cells c, c0 ∈ S such that c is preserved by i and c0 is preserved by i0. If F (zi gi(c))
and F (zig0
i(c0)) belong to the same cluster, then it must be the case that c = c
0, since otherwise the
distance between them would be at least T − 2T /24 > T /2. In other words, for each l, if ul⊂ P ∩Rl
contains at least one element of P , then all the elements of ul are “derived” from the same cell. Lemma 3.3. With probability at least 3/4, u1. . . uk contain a total of at most 2δsk errors and (δ + β)sk erasures (i, l such that uli=⊥).
Proof. Let R00= R \ R0 = R1∪ · · · ∪ Rk. Let P0 = P ∩ R0, and P00= P ∩ R00.
Note that |P0| ≤ |R0| ≤ δsk. Each error in u1. . . uk corresponds to a unique element of R00\ P00,
and we have
|R00\ P00| ≤ |R00\ P | + |P \ P00| ≤ |R \ P | + |P0| ≤ δsk + δsk = 2δsk.
Additionally, u1. . . uk contain at least P00 elements total, and so the number of erasures is at most sk − |P00| = sk − |P | + |P0| ≤ βsk + δsk, where we use |P | ≥ (1 − β)sk from Lemma 3.1.
Step 4 We can replace erasures by errors, and conclude that u1. . . uk have a total of at most (3δ + β)sk errors. It follows that at least k/2 of them have at most 2(3δ + β)s errors, and therefore can be decoded. Therefore, the set D = {d1. . . dk} contains at least k/2 elements of S.
Theorem 3.4. Assume k ≥ C log N for some constant C, a signal x with k objects, and a noise vector µ, all subject to the constraints delineated in the Model description of Section 1. There is a distribution over random binary m × N matrices A, m = O(k logkN ), and an associated recovery algorithm with the following property. Suppose that the algorithm is given Ax0 for x0 = x + µ. Then the algorithm recovers (with probability at least 3/4) a set D of k cells, such that at least k/2 of the cells fully containing an object are included in D. Moreover, the matrix has column sparsity O(logkN ).
4
Experimental Results
Our theoretical model is motivated by a task in satellite navigation formally known as attitude determination. An attitude is a triple (roll, pitch, yaw) that describes an orientation relative to the fixed night sky. Satellites compute their attitude by taking a picture of the night sky, extracting stars, and matching patterns of stars to an onboard database. We implement our algorithm3, referred to as Star Recovery with Geometric Features, or SRGF, to perform star extraction in very small space and time, conforming to the physical constraints of computing on a satellite.
One of the main energy costs in conventional imaging is incurred by analog to digital conversion. Several (non-satellite) compressive imagers have been built that use compressive sensing to reduce the number of measurements that need to be digitized [RGL+10, MJS+10]. However, these com-pressive imagers use dense matrices, which are impractical when the the signal is weak compared to the noise.
4.1 Star Cameras
In modern satellites, the entire task of attitude determination is encapsulated in a star tracker or star camera. [Lie02] has an excellent tutorial on star camera fundamentals. To acquire attitude, such cameras run the following sequence of steps:
1. Acquire the incoming light as an n-by-n pixel analog signal, which we call the preimage. 2. Digitize each of the n2 pixels, to obtain the digital image.
3. Locate a set S of star like objects in the digital image.
4. Match patterns formed by 3-5 element subsets of S to an onboard database. This step is commonly known as star identification.
5. Recover spacecraft attitude by using the database coordinates of the identified stars.
Step 2 consumes a significant amount of power due to the number of analog to digital conver-sions, and Step 3 requires significant processing and memory resources due to the large number of measurements that must be processed. Our compressive sensing solution fits in after Step 1, by compressing the n2 measurements of the preimage into m n2 measurements that then get digitized, reducing the cost of Steps 2 and 3.
4.2 Implementation Details
We fix n = 800 (N = 640000) for all experiments. We expose the camera to a .08 radian by .08 radian (4.6 by 4.6 degree) patch of the sky, which means that a typical image will have 3-10 objects (bright stars, 10%-ile to 90%-ile) and 50 to 150 stars that act as background noise. To generate test images, we use the Smithsonian Astrophysical Observatory (SAO) Star Catalog [Smi], randomly select patches from the sky (subject to the constraints of Appendix A), and convolve the stars with a gaussian of radius .5 pixels.4 These are typical values for modern star cameras.
Given the physical constraints of the proposed architecture, we set the column sparsity s to the smallest value our algorithm will tolerate: 2. We set the object size w to 3, as the vast majority of a star’s mass falls within a 3-by-3 box. The rest of this section follows the structure of Section 3.
3Source code for the experiments is available from http://web.mit.edu/rishig/papers/local-geo/ 4
Stars are point sources of light. Stars “cover” more than one pixel in the preimage only because the lens of the camera convolves the image with a function approximated by a gaussian. See [Lie02] for more details.
Measurements
We assume the stars are randomly (rather than adversarially) distributed within the image x0, and use that to simplify construction of the measurement vector z = Ax0. In particular, we no longer need to compose our error correcting code with a hash family such as that from Definition 2.1. If p1 and p2 are the primes used to construct the CRT code in Section 2.2, we find primes5 p0i such
that p0i≈√pi. Notating x0 as an n-by-n image, we define zi to be a p0i-by-p0i image with
zi[j1, j2] =
X
c1≡j1 (mod p0i) c2≡j2 (mod p0i)
x0[c1, c2].
Since the stars were assumed to be randomly distributed in x0, they are randomly distributed within each zi as well. We define the “measurement vector” z to be a 1-dimensional representation of the pair (z1, z2), and construct our measurement matrix A accordingly. However, from here on we will think of each zi as a 2-dimensional image.
Recovery Algorithm
We follow the presentation of the corresponding paragraph in Section 3. The recovery algorithm is:
1. In each zi, we identify ten 3-by-3 cells with high mass such that no two cells collide in more than 4 pixels. We allow the 3-by-3 cells to wrap around the edges of zi.
2. In place of the k-centering algorithm, we greedily choose up to 8 pairs of cells (c1, c2) from (z1, z2) such that the feature vectors F (c1) and F (c2) are close. In our case, F (c) is a triple of values: the mass of c, along with two coordinates for the centroid of c.
3. No longer needed. Each pair from Step 2 corresponds to one of the ul.
4. In place of the error correcting code, we simply apply the Chinese Remainder Theorem in each dimension to recover a 3-by-3 region of the original image for each pair from Step 2. Star Identification
We now have an image x00 with up to 8 decoded regions, or “star candidates”. We input x00 into a simplified version of the star identification algorithm presented in [MSBJ04]. The algorithm works as follows: We first extract a subset SAO0 of the Star Catalog SAO, by taking the 10 largest stars in every ball of radius 4.6 degrees. SAO0 has 17100 stars, compared to 259000 stars in SAO. We then build a data structure DS that can find a triangle of stars in SAO0 given three edge lengths and an error tolerance. We query DS with subsets of three stars from x00 until we find a match. This portion of the algorithm can be replaced by any regular star identification algorithm that has some tolerance for incorrect data, such as [MA08], or several in the survey [SM09].
4.3 Results and Observations
There are many sources of noise in real star cameras; we mimicked the major ones by having photons hit the camera in a random poisson process, and by adding gaussian noise to Ax0. We report our results as a function of the standard deviation of the added gaussian noise.
5
Note that we don’t literally need p0i and p02 to be prime, as long as they are relatively prime, since the Chinese
Remainder Theorem from Step 4 of the Recovery applies in this case as well. We will use the word prime to refer to p01 and p02even when they are just relatively prime.
0 100 200 300 400 500 0 .1 .2 .3 .4 .5 .6 .7 .8 .9 1
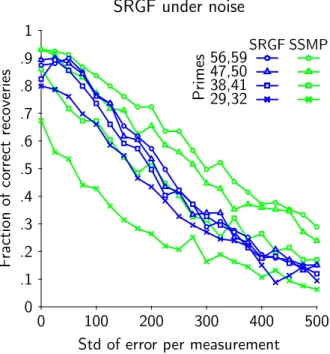
Std of error per measurement SRGF under noise F raction of co rrect re coveries Primes 56,59 47,50 38,41 29,32 SRGF SSMP
Figure 1: Experimental results. Each point on the figure is computed using the same 159 underlying images.
We ran SRGF as well as Sequential Sparse Matching Pursuit (SSMP) on 159 randomly generated images of the sky (subject to the discussion in Appendix A). SSMP is a near-linear (in N ) time procedure with recovery quality on par with other known methods [BI09]. We used the same measurement matrix A for both algorithms. Both SRGF and SSMP only attempt to recover portions of the signal x0; we then ran the same star identification algorithm of Section 4.2 on the outputs of both of them. We note that SSMP is not designed for this level of sparsity, and works better for d > 2. The results of the experiments are in Figure 1.
The first observation we make is that SRGF works very well down to an almost minimal number of measurements. The product p01p02 has to be greater than 800, and the minimal set of primes is 26 and 31. As the number of measurements increases, SSMP catches up and surpasses SRGF, but we note that running SSMP (implemented in C) takes 2.4 seconds per trial on a 2.3 GHz laptop, while SRGF (implemented in Octave/Matlab) takes .03 seconds per trial. Computation power on a satellite is substantially lower than that of a low end laptop, and given that the entire acquisition has to happen in .1 to 2 seconds, it seems unlikely that any algorithm linear or near linear in N is going to be practical. Finally, we note that all plot lines in the results could be improved by a more thorough implementation of a star identification algorithm.
Acknowledgements
The authors would like to thank Tye Brady and Ben Lane from Draper Lab for numerous conver-sations and help with the data, and the anonymous reviewers for helping clarify the presentation.
This research has been supported in part by a David and Lucille Packard Fellowship, MADALGO (Center for Massive Data Algorithmics, funded by the Danish National Research Association) and NSF grant CCF-0728645. R. Gupta has been supported in part by a Draper Laboratory Fellowship. E. Price has been supported in part by an NSF Graduate Research Fellowship.
References
[BGI+08] R. Berinde, A. Gilbert, P. Indyk, H. Karloff, and M. Strauss. Combining geometry and combinatorics: a unified approach to sparse signal recovery. Allerton, 2008.
[BI09] R. Berinde and P. Indyk. Sequential sparse matching pursuit. Allerton, 2009.
[CCF02] M. Charikar, K. Chen, and M. FarachColton. Finding frequent items in data streams. ICALP, 2002.
[CKMN01] M. Charikar, S. Khuller, D.M. Mount, and G. Narasimhan. Algorithms for facility location problems with outliers. SODA, 2001.
[CM04] G. Cormode and S. Muthukrishnan. Improved data stream summaries: The count-min sketch and its applications. Latin, 2004.
[CRT06] E. J. Cand`es, J. Romberg, and T. Tao. Stable signal recovery from incomplete and inaccurate measurements. Comm. Pure Appl. Math., 59(8):1208–1223, 2006.
[DDT+08] M. Duarte, M. Davenport, D. Takhar, J. Laska, T. Sun, K. Kelly, and R. Baraniuk. Single-pixel imaging via compressive sampling. IEEE Signal Processing Magazine, 2008. [DIPW10] K. Do Ba, P. Indyk, E. Price, and D. Woodruff. Lower bounds for sparse recovery.
SODA, 2010.
[Don06] D. L. Donoho. Compressed Sensing. IEEE Trans. Info. Theory, 52(4):1289–1306, 2006. [FPRU10] S. Foucart, A. Pajor, H. Rauhut, and T. Ullrich. The gelfand widths of lp-balls for
0 < p ≤ 1. preprint, 2010.
[FTF06] R. Fergus, A. Torralba, and W. T. Freeman. Random lens imaging. MIT CSAIL-TR-2006-058, 2006.
[GI10] A. Gilbert and P. Indyk. Sparse recovery using sparse matrices. Proceedings of IEEE, 2010.
[GRS99] O. Goldreich, D. Ron, and M. Sudan. Chinese remaindering with errors. STOC, pages 225–234, 1999.
[HL07] G. C. Holst and T. S. Lomheim. CMOS/CCD Sensors and Camera Systems. JCD Publishing and SPIE Press, 2007.
[Ind07] P. Indyk. Sketching, streaming and sublinear-space algorithms. Graduate course notes, available at http://stellar.mit.edu/S/course/6/fa07/6.895/, 2007.
[Jus76] J. Justesen. On the complexity of decoding Reed-Solomon codes (Corresp.). Informa-tion Theory, IEEE TransacInforma-tions on, 22(2):237–238, 1976.
[Lie02] C. C. Liebe. Accuracy performance of star trackers — a tutorial. IEEE Transactions On Aerospace and Electronic Systems, 38:587–599, 2002.
[MA08] W. Makowiecki and W. Alda. New sky pattern recognition algorithm. ICCS, Part 1, LNCS 5101:749–758, 2008.
[Mei03] James D. Meindl. Beyond moore’s law: The interconnect era. Computing in Science and Engineering, 5:20–24, 2003.
[MJS+10] V Majidzadeh, L Jacques, A Schmid, P Vandergheynst, and Y Leblebici. A (256x256) Pixel 76.7mW CMOS Imager/Compressor Based on Real-Time In-Pixel Compressive Sensing. In IEEE International Symposium on Circuits and Systems (ISCAS), 2010. [MSBJ04] D. Mortari, M. Samaan, C. Bruccoleri, and J. Junkins. The pyramid star identification
technique. Navigation, 51(3):171–183, 2004.
[Mut05] S. Muthukrishnan. Data streams: Algorithms and applications). Foundations and Trends in Theoretical Computer Science, 2005.
[Nac10] M. Nachin. Lower bounds on the column sparsity of sparse recovery matrices. 6.UAP: MIT Undergraduate Thesis, 2010.
[RGL+10] R. Robucci, J. Gray, L. K. Liu, J. Romberg, and P. Hasler. Compressive sensing on a cmos separable-transform image sensor. Proceedings of the IEEE, 2010.
[Rom09] J. Romberg. Compressive sampling by random convolution. SIAM Journal on Imaging Science, 2009.
[SM09] B. B. Spratling IV and D. Mortari. A survey on star identification algorithms. Algo-rithms, 2:93–107, 2009.
[Smi] Smithsonian astrophysical observatory star catalog. Available at http://heasarc.gsfc.nasa.gov/W3Browse/star-catalog/sao.html.
[TAN10] V. Treeaporn, A. Ashok, and M. A. Neifeld. Increased field of view through optical multiplexing. Optics Express, 18(21), 2010.
[UGN+09] S. Uttam, A. Goodman, M. A. Neifeld, C. Kim, R. John, J. Kim, and D. Brady. Optically multiplexed imaging with superposition space tracking. Optics Express, 17(3), 2009.
A
Celestial Intuitions
Spatial distribution of stars
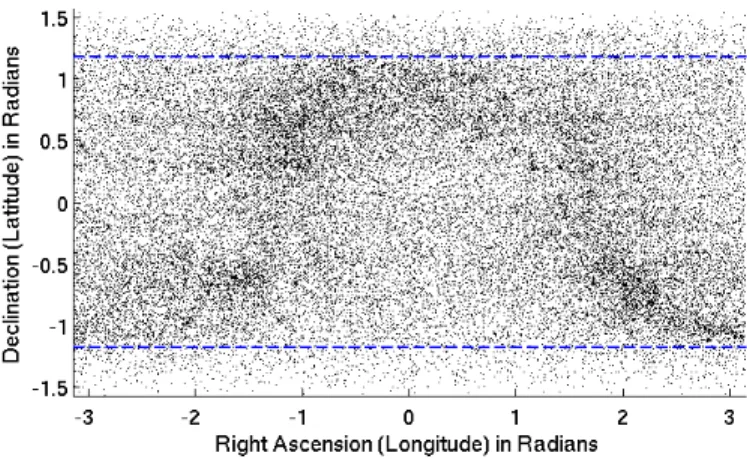
We assume everywhere that stars live on a rectangular interval, rather than a sphere. We index the rectangle by right ascension (longitude) α ∈ [−π, π] and declination (latitude) δ ∈ [−π/2, π/2]; in particular, δ = 0 is the equator, and δ = π/2 is the north pole. So that the approximation makes sense, we ignore the portion of the sky where |δ| > π/2 − π/8 (the dashed blue lines in Figure 2). We also assume without loss of generality that the camera is axis-aligned.
Figure 2: The night sky, as seen from Earth’s orbit. We test our algorithm on the areas between the dashed blue lines, where the Mercator projection does not skew the distribution of stars too much.
Figure 2 shows the distribution of stars across the night sky. The dense omega-shaped region is the central disk of our galaxy. In our pictures, if the median total star mass is 1, the 10%-ile mass is .6, and the 90%-ile mass is 2.25.
Mass distribution of stars
We define the mass of a star to be the number of photons from the star that hit our camera. The mass of the jth brightest star in the sky is Θ(j−1.17). Figure 3 gives some intuition for the mass of the biggest stars in our pictures relative to the amounts of noise. There are usually 50 to 150 total stars in a given preimage.
Sample Images
Figure 4 has a few pictures to help build intuition about star density and what stars look like. It is generally possible to see where the biggest stars are located, though some fraction of them get occluded by small stars or noise.
7 8 9 10 11 12
Mass of brightest stars in picture
Natural log of number of photons
1st brightest star 2nd brightest star 3rd brightest star 4th brightest star 5th brightest star 6th brightest star 7th brightest star 8th brightest star
Figure 3: The mass of the brightest stars in our pictures. The x-axis ranges from 100 to 0, and for instance if (x, y) falls on the green line, it means that in x% of the pictures, the ln(mass) of the 2nd biggest star is greater than y. The two dashed lines are the expected gaussian L1 noise over a given star when there is a standard deviation of 150
and 400 photons of noise per pixel.
200 400 600 800
200 400 600 800
(a) Underlying signal x (zoom in).
5 10 15 20 25 5 10 15 20 25 (b) p0= 29, No Noise. 5 10 15 20 25 5 10 15 20 25 0 2 4 6 8 (c) p0= 29, Noise = 150
Figure 4: log(mass) in sample images from one representative section of the sky. The legend on the right applies to all three images. All images have poisson noise applied, though (a) and (b) have no additional gaussian noise. We cut off pixels with values below 0 before taking the log in (c).
B
The Algorithm in Pictures
Measurements We first compute Ax0from the received signal x0. An element of the (4, N, s, s − r)q
-independent code GCRT = fCRT ◦ HP is depicted below.
Received signal x0 = x + µ
n pixels n
There are a total of N = n2 pixels.
The goal is to recover the k objects (colored polygons). Each object fits in a w × w pixel box.
w w
n/w0 cells n/w0
Impose a (randomly shifted) grid G of cells of width w0 = w/α. For clarity we no longer draw the pixel grid.
P > (n/w0)2 cells 1
Apply a pairwise independent hash function such as HP : x → ax + b (mod P ) to a numbering of the cells.
Measured signal z = Ax0
|Bi| ≥ q buckets in row zi
s
Apply an error correcting code f that maps each cell onto exactly one bucket in every row. Sum the cells mapping onto each bucket. The code shown to the left is fCRT, where each cell
is mapped to its index modulo various (rela-tively) prime numbers.
Recovery We now recover from the measurements Ax0.
Compute the feature vector F (zji) of each bucket. In our experiments, the feature vector contains infor-mation about mass and centroid.
F(z46) = (8, 15, 9.2)
F(z15) = (2, 3, 1.1) F(z26) = (8, 14, 9.5)
Set R = {(i, j) : kF (zi
j)kΓ is large}. Discard buckets
not in R.
R =
Cluster F (R) = {F (zji) : (i, j) ∈ R} into k clusters (with outliers). This induces a partition R0, R1. . . Rk of R, with F (Rl) equal to the l-th cluster.
R1= R2= R3 =
Decode each Rl to obtain a cell dl in the original image.
Though we don’t elaborate in the text, a simple min or median process can be used to obtain an approximation for the contents of each dl.