HAL Id: hal-02896294
https://hal.archives-ouvertes.fr/hal-02896294
Submitted on 10 Jul 2020HAL is a multi-disciplinary open access
archive for the deposit and dissemination of sci-entific research documents, whether they are pub-lished or not. The documents may come from teaching and research institutions in France or abroad, or from public or private research centers.
L’archive ouverte pluridisciplinaire HAL, est destinée au dépôt et à la diffusion de documents scientifiques de niveau recherche, publiés ou non, émanant des établissements d’enseignement et de recherche français ou étrangers, des laboratoires publics ou privés.
The interplay between iron limitation, light, and carbon
in the proteorhodopsin containing Photobacterium
angustum S14
Coco Koedooder, Rémy van Geersdaële, Audrey Gueneugues, François-Yves
Bouget, Ingrid Obernosterer, Stephane Blain
To cite this version:
Coco Koedooder, Rémy van Geersdaële, Audrey Gueneugues, François-Yves Bouget, Ingrid Obernos-terer, et al.. The interplay between iron limitation, light, and carbon in the proteorhodopsin containing Photobacterium angustum S14. FEMS Microbiology Letters, Wiley-Blackwell, 2020, �10.1093/fem-sec/fiaa103�. �hal-02896294�
The interplay between iron limitation, light, and
1carbon in the proteorhodopsin containing
2Photobacterium angustum S14
3 4
Coco Koedooder1,2*, Rémy Van Geersdaële1, Audrey Guéneuguès1, François-Yves Bouget1,
5
Ingrid Obernosterer1, Stéphane Blain1
6 7
1Sorbonne Université, UPMC Univ Paris 06, CNRS, Laboratoire d'Océanographie
8
Microbienne (LOMIC), Observatoire Océanologique, Banyuls/mer, France 9
2 The Fredy and Nadine Herrmann Institute of Earth Sciences, Hebrew University of
10
Jerusalem, Jerusalem, Israel 11
12
Keywords: proteorhodopsin, Fe-limitation, Photobacterium angustum S14, 13 photoheterotrophy 14 15 Abstract 16
Fe-limitation is known to affect heterotrophic bacteria within the respiratory electron 17
transport chain, therefore strongly impacting the overall intracellular energy production. We 18
investigated whether the gene expression pattern of the light-sensitive proton pump, 19
proteorhodopsin (PR), is influenced by varying light, carbon and Fe-concentrations in the 20
marine bacterium Photobacterium angustum S14 and whether PR can alleviate the 21
physiological processes associated with Fe-starvation. Our results show that the gene 22
expression of PR increases as cells enter the stationary phase, irrespective of replete or Fe-23
limiting conditions. This upregulation is coupled to a reduction in cell size, indicating that PR 24
gene regulation is associated with a specific starvation-stress response. We provide 25
experimental evidence that PR gene expression does not result in an increased growth rate, 26
cell abundance, enhanced survival or ATP concentration within the cell in either Fe-replete or 27
Fe-limiting conditions. However, independent of PR gene expression, the presence of light did 28
influence bacterial growth rates and maximum cell abundances under varying Fe-regimes. 29
Our observations support previous results indicating that PR phototrophy seems to play an 30
important role within the stationary phase for several members of the Vibrionaceae family, but 31
that the exact role of PR in Fe-limitation, remains to be further explored. 32
33 34 35
*corresponding author details:
Coco Koedooder
The Fredy and Nadine Herrmann Institute of Earth Sciences, Hebrew University of Jerusalem, Jerusalem, Israel
1. Introduction 36
Iron (Fe) is an essential trace element in organisms due to its ability to harbour two major 37
oxidation states, and the various enzymes that require Fe for their functioning are responsible 38
for major cellular processes including photosynthesis, respiration, DNA synthesis and nitrogen 39
fixation (Merchant and Helmann 2012; Ilbert and Bonnefoy 2013). Fe in the ocean is present 40
in various chemical forms and redox states, and experiences a multitude of transformations 41
mediated by chemical, physical and biological processes that will ultimately determine both its 42
solubility and bioavailability towards the microorganisms present within the water column (Lis 43
et al. 2015; Blain and Tagliabue 2016; Tagliabue et al. 2017). Heterotrophic bacteria, like all 44
other organisms, are affected by Fe-limitation which will subsequently impact the 45
biogeochemical cycling of carbon through their role as principal remineralizers of dissolved 46
organic carbon (Azam. F. et al. 1983). Within heterotrophic bacteria, the majority of Fe-47
containing enzymes (~90%) are located within the complexes of the respiratory electron 48
transport chain in the form of various cytochromes and Fe-sulfur clusters (Holms 1996; Tortell 49
et al. 1999; Alberts B, Johnson A, Lewis J 2002; Andrews, Robinson and Rodríguez-Quiñones 50
2003; Almaas, Oltvai and Barabási 2005). Consequently, Fe-limitation, has been shown to 51
particularly affect heterotrophic bacteria in their ability to produce ATP (Tortell, Maldonado 52
and Price 1996). 53
54
Proteorhodopsin (PR), a light-driven transmembrane proton pump, was discovered through the 55
genomic analysis of an uncultivated gammaproteobacterial strain of the ubiquitous SAR86 56
clade (Béjà et al., 2000; 2001). PR requires the chromophore retinal which, in the presence of 57
light, enables it to undergo a conformational change that allows for the absorption and release 58
of a proton across the cellular membrane. The formation of a proton gradient can be harboured 59
for several different physiological functions (Fuhrman, Schwalbach and Stingl 2008), and 60
when coupled to ATP synthase, PR activity can result in the transformation of light energy to 61
ATP. The low energetic production costs of PR in comparison to other light harvesting 62
complexes (Raven 2009; Kirchman and Hanson 2013), together with the widespread 63
prevalence of PR in the surface waters of the ocean (Gómez-Consarnau et al. 2019), hereby 64
suggested the presence of an important form of photoheterotrophy (Béjà et al. 2000, 2001; 65
Pinhassi et al. 2016; Song et al. 2020). 66
67
While the biological function of PR as a light-driven proton pump has been well characterized 68
(Martinez et al. 2007; Song et al. 2020), the exact physiological function and role of PR has 69
only been tested in a handful of cultivatable strains (Pinhassi et al., 2016). Thus far, 70
experiments conducted on culturable PR-containing bacteria (Supplementary Table 1) have 71
shown that the gene expression pattern of PR can differ between strains, and that PR activity 72
can be attributed to a wide range of physiological functions, including the promotion of growth 73
and its use as a survival mechanism under stressful conditions such as periods of carbon 74
starvation and other forms of nutrient limitation (Fuhrman, Schwalbach and Stingl 2008; 75
Pinhassi et al. 2016; Song et al. 2020). 76
77
Considering that Fe-limitation typically results in a decline in energy levels within the cell 78
(Tortell et al. 1999), a possible link may exist between PR-based phototrophy and the ability 79
to enhance energy production within Fe-limited cells (Raven 2009; Marchetti et al. 2012, 2015; 80
Sun et al. 2017; Cohen et al. 2018). The formation of a proton gradient by the PR photosystem 81
does not require Fe, while phototrophic systems containing Type I and Type II reaction centers, 82
such as those found in oxygenic phototrophs, require Fe-containing cytochromes in order to 83
sustain electron flow (Blankenship 2010). The comparison of three closely related Roseobacter 84
strains, indicated that the two strains isolated from Fe-replete regions contained a Type II 85
reaction centre (bacteriochlorophyll complex), while the strain isolated from an environment 86
characterised by Fe-limitation (Antarctic waters) contained a PR gene (Sun et al. 2017). It was 87
hereby suggested that the presence of a PR gene was a potential adaptation for a Roseobacter 88
strain subjected to low Fe-concentrations. PR genes have also been identified in several marine 89
eukaryotes (Marchetti et al. 2012) and were shown to be upregulated under Fe-limitation 90
compared to Fe-replete conditions within both the oceanic diatom Pseudo-nitzschia granii 91
and the polar sea-ice diatom Fragilariopsis cylindrus (Marchetti et al. 2015; Cohen et al. 92
2018). Interestingly, this upregulation in both light and dark conditions, did not result in 93
significant differences in the growth rate of P. granii. PR was hereby predicted to enable 94
the continued survival of P. granii until Fe becomes available again to allow cellular growth 95
(Marchetti et al. 2015). Whether a similar prediction can be made for PR-containing bacteria 96
subjected to Fe-limitation has, to our knowledge, not been tested. In this study, we aimed to 97
elucidate the potential role of PR in the presence of Fe-limitation using the model marine 98
bacterium Photobacterium angustum S14. 99
100
2. Material and Methods 101
2.1. Strains and Maintenance 102
A culture of P. angustum strain S14 was provided by Prof. S. Kjelleberg (UNSW, Sydney, 103
NSW, Australia) and stored under cryopreservation in the Microbial Observatory of the 104
Laboratoire Arago (MOLA) culture collection (BBCC7451). For the bacterial transformation 105
of P. angustum S14, cultures were grown and maintained in ZoBell and LB medium or agar as 106
described previously (Bertani 1951; Oppenheimer H. C. and ZoBell 1952; Koedooder et al. 107
2018). Escherichia coli strains Π3813 and β3914 were used as plasmid hosts for amplification 108
and transformation by bacterial conjugation respectively (Le Roux et al. 2007). Both E. coli 109
strains were grown in LB medium and LB agar at 37°C. When necessary 5 μg/mL of 110
chloramphenicol (Cm) for P. angustum S14 and 25 μg/mL for E. coli strains, thymidine (0.3 111
mM) and diaminopimelate (0.3 mM) were added as supplements to the medium. Induction of 112
the PBAD promoter was achieved through the addition of 0.2% L-arabinose to the growth 113
medium. Conversely, its repression was obtained by the addition of 1% D-glucose. 114
115
For the experimental setup, all strains and genetic constructs were grown in 30 mL Thermo 116
ScientificTM NalgeneTM polycarbonate bottles containing 12 mL Aquil medium supplemented
117
with 6 mM[C] glucose and 5.4µM Fe:EDTA (1:1 ratio, Price et al. 1989) and placed in the 118
dark at 20°C, agitated with a stirring rate of 110 rpm. Batches were refreshed at least 2 times 119
prior to the start of the experiment (25 μL of a culture was transferred to a fresh 12 mL batch 120
of Aquil medium every 2 days) in order to remove any traces of Fe and carbon that could be 121
carried over from growth on Zobell or LB medium. 122
123
2.2. Genetic Constructs 124
Construction of both a PR gene bioreporter (ptr-luc) and a PR gene knockout (∆pr) was 125
performed in P. angustum S14 by allelic exchange using the R6K based pSW7848T suicide 126
vector, as described previously (Le Roux et al. 2007; Val et al. 2012; Lemire et al. 2015; 127
Koedooder et al. 2018). Briefly, the pSW7848T plasmid contains the gene insert for allelic 128
exchange which, for the construction of the gene knockout, consists of the upstream and 129
downstream region (500 bp) that encompasses the PR gene of P. angustum S14 (EAS63552.1) 130
and, for the construction of the bioreporter, consists of the PR gene fused together with a 131
luciferase gene. The pSW7848T plasmid further contains the RP4 replication origin oriT, the 132
pir-dependent R6K replication origin oriR6K and the resistance gene for the antibiotic Cm, as 133
a selection marker. For the construction of ∆pr, the pSW7848T plasmid additionally contains 134
the inducible CcdB toxin which is under control of the PBAD promoter and induced in the 135
presence of arabinose. The assembly of the plasmid construct was performed according to the 136
Gibson Assembly protocol (New England Biolabs, NEB) according to the manufacturer’s
137
instructions and inserted into the E. coli strain Π3813 for amplification by electroporation. 138
After amplification, the plasmid was extracted and purified prior to its insertion into E. coli 139
strain β3914 (Le Roux et al. 2007; Lemire et al. 2015). The plasmid was subsequently 140
transferred by conjugation from E. coli β3914 to the recipient P. angustum S14 by a filter 141
mating procedure as described previously (Le Roux, Davis and Waldor 2011) with a 142
donor/recipient ratio of 1:10 ml. The plasmid is integrated into P. angustum S14 via 143
homologous recombination and selected for in media containing Cm. The gene knockout ∆pr, 144
which contains the PBAD promoter, undergoes a second homologous recombination enabling 145
the removal of the plasmid backbone which is selected for in media containing arabinose. The 146
formation of ∆pr and ptr-luc was verified via PCR for the presence or absence of the gene 147
fragment and by sequencing the gene products with the wildtype serving as positive or negative 148
control (Supplementary Fig 1). 149
150
2.3. Trace metal-controlled conditions 151
All experiments were conducted under trace metal clean conditions in a clean room (class 152
10000) and under a laminar flow hood (ADS class 100; Morel et al. 2008). Briefly, all plastic 153
materials were made trace metal free by soaking them for 24 h in 10% HCl. This was followed 154
by rinsing and soaking the materials for another 24 h in an ultra-pure water (UPW) bath that 155
was produced with an 18.2 MΩ cm, Elga system equipped with a 0.2 μm final filter (Thermo 156
Fisher Scientific). NalgeneTM polycarbonate flasks dedicated to the culture experiments were
157
additionally microwaved 3 times at 750 W until boiling with UPW. All plastic materials were 158
placed under the laminar flow hood to dry and sterilized by UV light (30 min) before use. Aquil 159
medium was prepared according to Price et al. (1989) where Synthetic Ocean Water (SOW) is 160
passed through a column containing a Chelex 100 resin (Bio-Rad) in order to remove all trace 161
metals including Fe (Davey et al. 1970). Carbon sources were chelexed separately to form 162
stock solutions of 3 M[C] and were added to the medium as single carbon sources (6 mM[C] 163
final concentration). SOW was filtered (0.2 μm) and further sterilized by microwaving it 3 164
times at 750 W until boiling before the addition of nutrients, vitamins and metals all filtered 165
through a 0.2 μm syringe Acrodisc filter (Pall Corporation). Fe-concentrations in the medium 166
were derived from a stock solution of FeCl3 complexed with EDTA at a 1:1 ratio for at least 167
24 h before being subsequently filtered (0.2 μm) and added to the Aquil medium (5.4 μM final 168
concentration). 169
170
Bacteria were grown in 30 mL Thermo ScientificTM NalgeneTM polycarbonate bottles with 12
171
mL of Aquil medium containing 6 mM[C] glucose and transferred into fresh growth medium 172
every 2 days with a starting dilution of approximately 1.8 × 10⁴ cells mL−1. When Fe-173
contamination could not be accounted for, which occurred when using medium containing Cm 174
or luciferin, the addition of 50 µM of the strong Fe-chelator Desferroxamine-B (DFOB) was 175
used to obtain Fe-deplete conditions in P. angustum S14. An overview of all the conducted 176
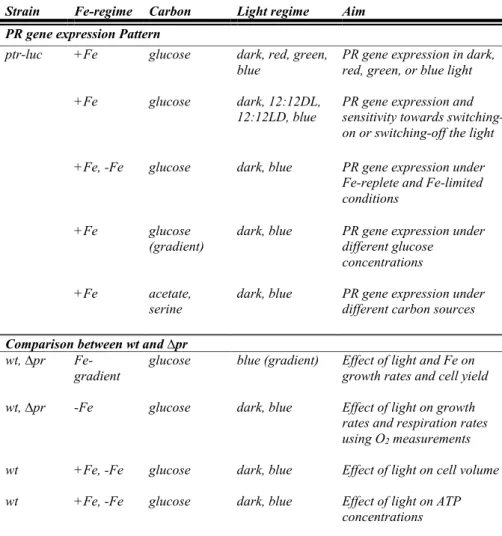
experiments and their aim can be seen in Table 1. 177
2.4. Ptr-luc PR gene expression experiments 178
The bioreporter ptr-luc was used to measure the gene expression of PR over time via 179
luminescence (arbitrary units, a.u.) under various different conditions. Ptr-luc was grown under 180
different wavelengths of red (570-638 nm), green (485-570 nm) and blue light (434-502 nm), 181
and light intensities (0, 15, 30, 60 µmol quanta m-2 s-1) using light-emitting diodes (LEDs) 182
coupled to a ventilation system to regulate temperature, and grown under different single 183
carbon sources (acetate, glucose, serine) in varying concentrations (60, 600, 6000 µM[C]). Fe-184
deplete conditions were obtained through the addition of 50 µM DFOB. 185
186
Luminescence was measured every hour (5 s per well) using an automated microplate 187
luminometer (Berthold LB Centro LB; Thommen et al. 2015). The obtained luminescence 188
measurements were corrected for by subtracting the observed background noise derived from 189
the blanks (Supplementary Fig 2) from the sample measurements. In order to obtain a 190
luminescence signal with a high enough resolution for the observation of possible changes 191
during the start of the experiment, ptr-luc was diluted in Aquil media to a starting concentration 192
of ~1.0 x 10⁶ cells mL−1. 200μL of the culture was pipetted into each well of a clear-bottom 193
black 96-well microplate (Greiner Bio-One) containing luciferin (final concentration 250 μM) 194
and covered with a clear diamond film seal (Thermo Fisher ScientificTM). Bacterial cell counts 195
were performed on samples fixed with formaldehyde (0.2% final concentrations) and stained 196
with SYBR Green I (15 min) using a Becton Dickinson Accuri C6 flow cytometer (Marie et 197 al. 1997). 198 199 2.5. Wt and ∆pr experiments 200
In order to address the question of how PR gene expression can affect growth under different 201
light and Fe regimes, comparative experiments were conducted between the P. angustum S14 202
wildtype (wt) and Δpr. The strains were grown at a starting abundance of ~1.8 × x105 cells
203
mL−1 in a range of blue light (LEDs; 434-502 nm range) intensities (0, 15, 30 and 60 µmol
204
quanta m-2 s-1) and Fe concentrations (5.4 μM, 0.54 μM, 54 nM, 5.4 nM). 205
206
For the construction of bacterial growth curves, cell counts were performed as described above. 207
In parallel, the mean cell volume (μm3) was determined for several time points using a coulter 208
counter (CASY Cell Counter, Roche) with a 45 μm capillary and a cellular size range between 209
0.7 and 30 μm and analyzed according to the manufacturer’s instructions. The mean volume 210
was calculated from the measured particles within each sample (>0.7 µm). 211
212
Respiration rates and growth rates of wt and ∆pr were obtained from O2 measurements 213
conducted using a SensorDish reader (Presens) equipped with 24 glass vials of 4.8 mL 214
containing non-invasive O2 sensors (OxoDish) and placed in an incubator at a constant 215
temperature of 20°C for a period of 24 hours as described previously (Koedooder et al., 2018; 216
Supplementary Text). 217
218
ATP measurements (fmol per 1000 cells) were taken from wt subjected to replete and Fe-219
deplete (50 μM DFOB) conditions using the ATP Biomass Kit HS (BioThema) by a 220
luminometer and following the manufacturer’s instructions (Lundin, 2000). 221
222
The presence of reactive oxygen species (ROS) from ptr-luc was measured using the 223
CellROX® Deep Red reagent according to the manufacturer’s instructions (Lifetechnologies, 224
Switzerland) in bacterial cells (Manoil and Bouillaguet 2018). Briefly, CellROX® Deep Red 225
is a cell permeable dye that detects oxidative stress in cells by reacting to ROS in the cells and 226
becoming brightly fluorescent upon oxidation (excitation/emission of 640/665 nm). Ptr-luc was 227
grown in their respective media and pipetted into 200 μL wells of a clear-bottom 96-well 228
microplate (Greiner Bio-One) and covered with a clear diamond film seal (Thermo Fisher 229
ScientificTM). Cells were incubated for 30 minutes with 5 μM CellROX® Deep Red and then
230
consequently fixed with formaldehyde (0.2% final concentration) and stained with SYBR 231
Green I (15 min). Fluorescence from CellROX® Deep Red was measured from the 232
allophycocyanin (APC)-H channel using a BD FACS-Canto II. The geometric mean was taken 233
and expressed in relative fluorescence units (rfu). 234
235
2.6. Statistical Analysis 236
All statistical analyses were conducted in R software (Version 3.5.1) and consisted of a one-237
way or two-way Analysis of Variance (ANOVA) once the assumptions of normality (Shapiro-238
Wilk) and homogeneity of variance (Levene Test) were met. A Tukey HSD test was conducted 239
to further elucidate significant interactive results amongst the different conditions*. 240
241
3. Results
242
3.1. PR gene expression patterns in P. angustum S14 243
The PR gene expression pattern in P. angustum S14 was determined under different growth 244
conditions using the luminescent bioreporter ptr-luc (Table 1). In order to determine whether 245
PR gene expression was stimulated by a certain wavelength of light, ptr-luc was subjected to 246
continuous dark, red, green and blue light conditions (30 µmol quanta m-2 s-1) and the total 247
luminescence was observed over time (Figure 1). A sudden increase in luminescence was 248
observed in both the dark and all light conditions after 8h of incubation. The luminescence 249
continues to increase thereafter in blue light but not in the other light conditions, which 250
indicates that P. angustum S14 specifically induces its PR gene under blue light but not under 251
red or green light or in the dark. 252
253
Ptr-luc was further subjected to 12-hour light:12-hour dark or 12-hour dark:12-hour light cycles 254
in order to test how sensitive PR gene expression was to the presence or absence of blue light 255
* The outcome of all statistical analyses has been deposited under the following github link: https://github.com/cocokoedooder/STATS_PRP.angS14
(Supplementary Fig 3). As shown previously, an increase in luminescence was observed in all 256
conditions after 8-hours, followed by a further increase of luminescence over time in the 257
presence of blue light that was absent under dark conditions. Importantly, after ~24 hours, PR 258
gene expression was stimulated by the presence of blue light and turning off or turning on the 259
light respectively resulted in a decrease or increase of the luminescent signal. 260
261
When normalizing the total luminescence by cell counts (Figure 2), ptr-luc grown under Fe-262
replete conditions and continuous blue light, was shown to express a low luminescent signal 263
within the exponential growth phase. Upon approaching the stationary phase at around ~30 264
hours, the luminescence signal increased per cell in both light and dark conditions. The 265
increased luminescent signal became significantly higher in the presence of blue light 266
compared to the dark at ~48 hours (p=0.0006) and ~57 hours (p<0.0001). Luminescence 267
peaked around ~60 hours and then gradually declined over time in both light and dark 268
conditions. When comparing the growth rates of ptr-luc grown in Fe-replete conditions in the 269
presence (7.4 ± 0.1 day-1) or absence (7.1 ± 0.4 day-1) of blue light (Table 2), no significant 270
differences were observed (p=0.9081). The growth rates further coincided with a maximum 271
cell abundance of 1.31 ± 0.29 x 10⁸ cells per mL in the presence and 1.26 ± 0.09 x 10⁸ cells 272
per mL in the absence of blue light and was not found to be statistically different (p=0.2345). 273
274
In order to test whether the gene expression pattern of PR could be affected by the carbon 275
concentration in the medium, ptr-luc was grown in a range of glucose concentrations (60, 600 276
6000 µM[C]) in the presence and absence of light (Supplementary Fig 4). The gene expression 277
pattern that was observed previously under Fe-replete conditions became less distinct. 278
Specifically, the clear distinction in PR gene expression between light and dark conditions 279
became less pronounced in lower carbon concentrations (600 µM[C]) and was absent in the 280
lowest carbon concentration (60 µM[C]). 281
282
Ptr-luc was further grown under Fe-limiting conditions (50 µM DFOB) in order to see if the 283
gene expression pattern of PR would change compared to Fe-replete conditions. Growth rates 284
respectively declined to 4.0 ± 0.1 and 5.1 ± 1.0 (day-1) in the presence or absence of light (Table 285
2), but again were not found to be significantly different (p=0.1451). The decline in growth 286
rate respectively coincided with a decline in maximum cell abundance to 0.11 ± 0.08 and 0.11 287
± 0.13 x 10⁸ cells per mL in dark or blue light conditions which was not significantly different 288
(p=0.9948). When looking at the total luminescence normalized by cell counts, the gene 289
expression experiments again revealed that as ptr-luc approached the stationary phase at ~20 290
hours, an increase in luminescence was observed in both light and dark conditions (Figure 3). 291
Unlike what was observed for Fe-replete conditions, under Fe-limitation, no significant 292
differences in the luminescence per cell was found between light and dark conditions 293
(p=0.8866). 294
295
Lastly, in order to determine whether single-carbon sources other than glucose could change 296
the PR gene expression pattern in P. angustum S14, ptr-luc was grown in either 6mM[C] 297
acetate or 6mM[C] serine in the presence of blue light (Supplementary Fig 5). Compared to 298
glucose, a lower luminescence signal was observed in serine while the signal completely 299
flatlined in the presence of acetate (Supplementary Fig 5). For cells grown in acetate, the low 300
luminescent signal in the presence of light, was due to the absence of cell growth. Under further 301
investigation, the presence of light for cells grown in acetate was coupled to a significantly 302
higher presence of reactive oxygen species (ROS) which doubled in the presence of blue light 303
in comparison to cells grown in the dark (Supplementary Table 2). 304
305
3.2. Comparison between the wt and ∆pr 306
Growth experiments of wt and ∆pr in a range of Fe and light concentrations allowed us to 307
establish the effect of a well-defined Fe-concentration gradient regarding growth rates and total 308
cell abundance (Supplementary Fig 6, Table 1). Overall, decreasing Fe-concentrations resulted 309
in a significant and gradual decline in both the growth rate (p<0.0001) and maximum cell 310
abundance (p<0.0001) of both wt (Supplementary Table 3) and ∆pr (Supplementary Table 4). 311
312
In Fe-replete conditions (5.4 µM), the growth rates and maximum cell abundance of wt were 313
similar to what was obtained for ptr-luc, reaching values between 7.1 ± 0.1 and 7.4 ± 0.1 (day -314
1) and 1.4 ± 0.1 and 1.1 ± 0.1 x 10⁸ cells per mL respectively. These values decreased with
315
lower Fe-concentrations to growth rates between 3.8 ± 0.1 and 4.3 ± 0.2 (day-1) and maximum
316
cell abundances between 0.2 ± 0.1 and 0.3 ± 0.1 x 10⁸ cells per mL) under 5.4 nM Fe, 317
respectively. Furthermore, the maximum cell abundance obtained from wt grown under 5.4 318
µM and 0.54 µM of Fe was similar to each other, indicating that, at these concentrations, Fe is 319
not considered to be a limiting factor within the medium and that at 5.4 µM Fe is in excess. Fe-320
limitation caused a similar decline in both the growth rate (p<0.0001) and maximum cell 321
abundance (p<0.0001) in ∆pr (Supplementary Figure 6; Supplementary Table 4). 322
323
The presence of light significantly affected both the growth rate (p=0.0004) and maximum cell 324
abundance (p=0.0007) of wt (Figure 4, Supplementary Table 3). Under 5.4 nM of Fe, a small 325
but significantly lower growth rate was observed in the dark compared to 25, 50 and 100% 326
blue light. The opposite response was observed in Fe-replete conditions (5.4 µM) where a small 327
but higher growth rate was observed in the dark compared to the light treatments. Under high 328
light intensities, significantly lower maximum cell abundances were observed for wt grown in 329
5.4 µM of Fe (p=0.0013). Similar results were obtained from growth experiments conducted 330
on ∆pr. A significant interactive effect between light and Fe-concentrations occurred on both 331
the growth rate (p=0.0001) and maximum cell abundance (p=0.0029) (Supplementary Table 332
4). A Tukey Test revealed that under Fe-replete conditions, no negative effect of light was 333
observed on the growth of ∆pr under high light intensities (100% blue light) as was previously 334
shown for wt. Similar to wt, under Fe-limiting conditions an increase in the maximum cell 335
abundance was observed under high light intensities and under 54 nM a significant increase in 336
the growth rate was observed (p=0.0022). 337
338
Growth and respiration rates derived from O2 measurements were taken for both the wt and 339
∆pr grown under Fe-limiting conditions (100 µM DFOB) in the presence and absence of light 340
(Table 3). In the presence of light, no significant differences were observed in the respiration 341
rate (p=0.999). Significant differences in the growth rate between the wt and ∆pr (p=0.045) 342
were observed but concerned a respectively small difference of 0.2 (2.6 ± 0.1 and 2.8 ± 0.05 343
day-1). 344
345
Changes in cell volume were measured for wt grown in both replete (5.4µM) and Fe-346
limiting (50µM DFOB) conditions in the presence or absence of light over time (Figure 5, 347
Supplementary Table 5). Cell volumes were always slightly lower in constant blue light 348
compared to dark-conditions. The mean cell volume declined over time from 1.44 ± 0.01 µm3
349
and 1.35 ± 0.01 µm3 in Fe-limiting and Fe-replete conditions to 0.76 ± 0.01 µm3 and 0.69 ±
350
0.01 µm3 respectively. 351
Lastly, ATP measurements were taken for wt grown in Fe-replete (5.4µM) and Fe-limiting 353
(50µM DFOB) conditions that coincided with cells entering the stationary phase (Table 4). 354
ATP measurements were significantly lower in Fe-limiting conditions compared to Fe-replete 355
conditions, but no significant differences were observed in the presence or absence of light 356
under both Fe-conditions. 357
358
4. Discussion
359
4.1. PR gene expression pattern of P. angustum S14 is linked to a starvation state 360
The gene expression pattern of PR is known to differ amongst various bacterial strains as 361
several studies have been able to demonstrate that the PR gene can be either facultatively or 362
continuously expressed within the cell (Supplementary Table 1). Our results established that 363
P. angustum S14 facultatively expresses its PR gene as cells approach the stationary phase and 364
that this occurs in both Fe-replete and Fe-limiting conditions. The gene expression pattern of 365
PR in P. angustum S14 was similar to other members of the Vibrionaceae family including 366
Vibrio sp. AND4 and Vibrio campbelli, both of which contain green-tuned PR molecules 367
(Gómez-Consarnau et al. 2010; Wang et al. 2012; Akram et al. 2013). Due to the presence of 368
glutamine in position 105 of its amino acid sequence, the PR present in P. angustum S14 is 369
expected to be tuned towards blue light which coincides with our results. Thus far, P. angustum 370
S14 is the only known bacterial strain in culture containing a blue-tuned PR molecule of which 371
the PR gene expression pattern has been elucidated. 372
373
In the stationary phase, significant differences in the PR gene expression of P. angustum S14 374
were observed in the presence and absence of light and these differences only became apparent 375
under high glucose concentrations of 600 µM[C] and 6mM[C] but not 60 µM[C]. For other 376
members of the Vibrionaceae family, significant differences in the PR gene expression in the 377
presence or absence of light have been observed in V. campbelli (132 µM[C]; Wang et al., 378
2012), but not for Vibrio sp. AND4 (2 mM[C]; Akram et al., 2013). While it is important to 379
note that the two experiments are not strictly comparable due to differences in their culture 380
media and carbon source, the carbon concentration present within the medium can be relevant 381
in these expression analyses. In Dokdonia sp. MED 134 (Gómez-Consarnau et al. 2007), for 382
example, significant differences in the gene expression of PR in the presence or absence of 383
light only appeared under DOC concentrations ranging between 140 µM[C] and 1.1 mM[C] 384
but not in lower (60 µM[C]) or higher (242 mM[C]) carbon concentrations. Unlike members 385
of the Vibrionaceae family, however, Dokdonia sp. MED 134 has been shown to constitutively 386
express PR in the presence of light (Palovaara et al. 2014; Gómez-Consarnau et al. 2016). 387
388
As cells approached the stationary phase, the increased gene expression of PR was coupled 389
with a strong decrease in cellular biovolume over time under both Fe-replete and Fe-limiting 390
conditions. The ability to starkly reduce cellular biovolume is a characteristic trait that occurs 391
when cells are capable of inducing a stringently controlled starvation state upon energy and 392
carbon deprivation (Kjelleberg, Humphrey and Marshall 1982; Nyström and Kjelleberg 1989; 393
Nyström, Olsson and Kjelleberg 1992). The induction of a starvation state is a phenomenon 394
commonly observed in several members of the Vibrionaceae family including P. angustum 395
S14 (Hild et al. 2000; Lauro et al. 2009; Lever et al. 2015). The gene expression pattern of PR 396
in both V. campbelli and Vibrio sp. AND4 has previously been linked to the alternative sigma 397
factor RpoS1 which instigates the induction of a starvation state (Wang et al. 2012; Akram et 398
al. 2013). It is therefore likely that a similar form of regulation may be occurring in P. angustum 399
S14 under both carbon-limitation and Fe-limitation. 400
Previous experiments have shown that the reduction in cellular biovolume observed in P. 402
angustum S14 is absent under other forms of limitation such as low phosphorus and nitrogen 403
concentrations (Holmquist and Kjelleberg 1993). Our results, hereby, indicate that Fe-404
limitation, like carbon limitation, induces a starvation-like state in P. angustum S14. The lower 405
biovolume observed in the presence of Fe-limitation was in contrast to what was shown for E. 406
coli (Hubbard et al. 1986) and a small oceanic A. macleodii strain (Fourquez et al. 2014), the 407
latter of which resulted in a 2-fold increase in its biovolume under Fe-limiting conditions. 408
While carbon-limitation will directly affect energy production within the cell and is known 409
from previous studies to induce a starvation state in P. angustum S14 (Holmquist and 410
Kjelleberg 1993), the effect of Fe-limitation on the energy status of the cell is inherently more 411
complex. Fe-limitation is known to indirectly affect energy production within the cell by 412
affecting the synthesis of Fe-containing enzymes. These include enzymes located within the 413
respiratory electron transport chain, and enzymes involved in the TCA cycle and DNA 414
synthesis (Tortell, Maldonado and Price 1996). 415
416
A large fraction of the heterotrophic bacteria are considered to be present in a starvation-like 417
state until specific nutrients become available for them to grow (Burgess 1997; Gray et al. 418
2019) and, for members of the Vibrionaceae family, PR is currently considered to be an 419
important mechanism to maintain sufficient energy-levels to keep basal metabolic functioning 420
within the cell under unfavourable and starved conditions (Gómez-Consarnau et al. 2010; 421
Akram et al. 2013). Extended growth experiments conducted for both wt and ∆pr in the 422
presence or absence of light also did not result in any further significant differences which is 423
in contrast to what was observed in Vibrio sp. AND4 where an enhanced survival upon 424
starvation conditions occurred by means of a series of dilution experiments (Gómez-Consarnau 425
et al. 2010; Akram et al. 2013). The effect of light on P. angustum S14 in the context of 426
maintenance energy and carbon yield had previously been studied using continuous culture 427
experiments (Courties et al. 2015). When correcting for variations in the dilution rates, Courties 428
et al (2015) reported an increase in the carbon yield for cells subjected to light and dark cycles 429
compared to dark controls. It was predicted that higher carbon yields resulted from a lower 430
maintenance coefficient that could be attributed to PR activity although PR gene expression 431
had not been measured in these experiments. As continuous culture experiments aim to target 432
the exponential growth phase, these predictions were in contrast to our finding that PR activity 433
in P. angustum S14 specifically occurs as cells enter the stationary phase and appears to be 434
linked to a starvation-like state. 435
436
4.2. PR gene expression pattern of P. angustum S14 grown in alanine and serine 437
Experiments conducted by Palovaara et al (2014) for Dokdonia sp. MED 134 compared the 438
effect of PR under different single carbon sources. Growth of Dokdonia sp. MED 134 under a 439
“poor” carbon source such as alanine resulted in a stronger difference in the enhanced bacterial 440
growth- and uptake rates in the presence of light when compared to glucose. In previous 441
experiments, P. angustum S14 has been shown to grow on “poor” carbon sources such as serine 442
and acetate (Koedooder et al. 2018). When P. angustum S14 was grown under carbon sources 443
other than glucose, such as serine and acetate, we hereby predicted that any affect from PR 444
activity in the presence of light may be enhanced. Instead, growth under acetate or serine was 445
hindered in the presence of light and appeared to heighten the susceptibility of P. angustum 446
S14 towards photo-oxidative stress as a significant build-up of ROS was observed within the 447
cell that increased in the presence of light. It is well established that the various methods in 448
which a bacterial strain can combat (photo)oxidative stress are strain specific (Cabiscol, 449
Tamarit and Ros 2000). P. angustum S14 is particularly known to contain a wide diversity of 450
pathways to counter oxidative stress (Matallana-Surget et al. 2012, 2013). Our results 451
emphasize that the sensitivity of ptr-luc grown in acetate and serine towards continuous blue 452
light ultimately outweighed any potential benefit for the cells in terms of PR activity. 453
454
4.3. PR gene expression pattern of P. angustum S14 in Fe-limitation 455
In P. angustum S14, the PR gene expression was shown to increase over time in the presence 456
of both light and dark conditions under Fe-limitation. This is in line with experiments 457
conducted by Marchetti et al (2015) which showed that the presence of Fe-limitation increased 458
the gene expression of PR in the oceanic diatom P. granii compared to Fe-replete conditions. 459
Importantly, Marchetti et al (2015) did not link these expression experiments to a particular 460
growth phase and whether the observed increase in PR gene expression in P. granii specifically 461
occurs as cells were entering the stationary phase could not be determined from these 462
experiments. 463
464
Our results highlight that care must be taken when attributing changes in growth rate and cell 465
yield to the presence of PR within the cell. Under Fe-limitation, a small but significant 466
enhanced growth rate and maximum cell abundance was observed in the presence of light 467
compared to the dark. Based on our expression experiments and on further investigation using 468
∆pr, the enhanced growth rate and maximum cell abundance was not due to the presence of PR 469
in P. angustum S14. Instead, it is likely due to an enhanced bioavailability of Fe through the 470
photo-reduction of the Fe:EDTA complex within the medium (Sunda and Huntsman 2003; 471
Barbeau 2006). In contrast, under Fe-replete conditions, the presence of light resulted in a 472
slightly lower growth rate and maximum cell abundance which may be attributed to an 473
enhancement of photo-oxidative stress by means of the Fenton reaction (Touati 2000; Dixon 474
and Stockwell 2014; Mullarky and Cantley 2015). Similar growth rates and maximum cell 475
abundances were, for example, obtained for P. angustum S14 grown in the presence of both 476
5.4 µM and 0.54 µM of Fe and is an indication that P. angustum S14 is grown under Fe-excess. 477
Furthermore, while Fe-limitation clearly reduced ATP concentrations and respiration rates 478
within the cell, no significant differences were observed in P. angustum S14 in the presence or 479
absence of light. Similarly, the experiments conducted with P. granii did not result in additional 480
differences in the growth rate or maximum cell abundances (Marchetti et al. 2015). 481
482
In conclusion, our results contribute to the growing body of PR gene expression studies that 483
have been conducted over the past decade. While our observations strengthen the finding that 484
PR seems to play an important role within the stationary phase for several members of the 485
Vibrionaceae family, the exact role of PR, and in particular under Fe-limitation, still remains 486
unclear. Another potential mechanism by which PR can aid a cell within the stationary phase 487
is in the search and uptake of available nutrients. Copiotrophs are often characterized by a wide 488
diversity in transporters that enables the uptake of various nutrients (Ho, Lonardo and Bodelier 489
2017). Under carbon starvation, P. angustum S14 has the ability, for example, to induce a high-490
affinity uptake system for glucose (Lauro et al. 2009; Lever et al. 2015) and has also been 491
shown to evoke a chemotaxis response towards several carbon sources (Malmcrona-Friberg, 492
Goodman and Kjelleberg 1990). Both the observed chemotaxis response towards glucose in 493
the presence of carbon-starvation and the ability of P. angustum S14 to upregulate high-uptake 494
mechanisms for glucose are all potential physiological functions that could ultimately require 495
the use of PR activity and remains to be further elucidated (Fuhrman, Schwalbach and Stingl 496 2008; Gómez-Consarnau et al. 2016). 497 498 5. Funding 499
This work was financially supported in part by a grant from the French National Research
500
Agency (ANR-16-CE32-0008-01) and the National Center for Marine Biological Resources
501 (EMBRC). 502 503 6. Acknowledgments 504
The authors would like to thank Frederique Le Roux and Astrid Lemire for the construction
505
of the gene knockout ∆pr and we further wish to acknowledge Valerie Vergé for helping us
506
provide PCR results during the experiments to confirm the absence of PR in the gene
507
knockout ∆pr and the presence of the PR-luciferin construct in the bioreporter ptr-luc.
508
Phillipe Catalan for providing guidance with the ROS experiments.
509
Conflicts of interest. There are no conflicts of interest to declare.
510
()() 511
References
512
Akram N, Palovaara J, Forsberg J et al. Regulation of proteorhodopsin gene expression by 513
nutrient limitation in the marine bacterium Vibrio sp. AND4. Environ Microbiol 514
2013;15:1400–15. 515
Alberts B, Johnson A, Lewis J et al. Electron transport chains and their proton pumps. Mol 516
Biol cell 4th Ed 2002:1–10. 517
Almaas E, Oltvai ZN, Barabási A-L. The Activity Reaction Core and Plasticity of Metabolic 518
Networks. PLoS Comput Biol 2005;1:e68. 519
Andrews SC, Robinson AK, Rodríguez-Quiñones F. Bacterial iron homeostasis. FEMS 520
Microbiol Rev 2003;27:215–7. 521
Azam. F., Fenchel T, Field JG et al. The Ecological Role of Water-Column Microbes in the 522
Sea*. Ecol Prog Ser, Mar 1983;10:257–63. 523
Barbeau K. Photochemistry of Organic Iron(III) Complexing Ligands in Oceanic Systems. 524
Photochem Photobiol 2006;82:1505–16. 525
Béjà O, Aravind L, Koonin E V et al. Bacterial rhodopsin: evidence for a new type of 526
phototrophy in the sea. Science 2000;289:1902–6. 527
Béjà O, Spudich EN, Spudich JL et al. Proteorhodopsin phototrophy in the ocean. Nature 528
2001;411:786–9. 529
Bertani G. Studies on lysogenesis. I. The mode of phage liberation by lysogenic Escherichia 530
coli. J Bacteriol 1951;62:293–300. 531
Blain S, Tagliabue A. Iron Cycle in Oceans. Tregeur P (ed.). London: ISTE Ltd and John 532
Wiley & Sons, Inc., 2016. 533
Blankenship RE. Early Evolution of Photosynthesis. Plant Physiol 2010;154:434–8. 534
Burgess G. Bacteria in Oligotrophic Environments: Starvation Survival Lifestyle. World J 535
Microbiol Biotechnol 1997;14:305–305. 536
Burr DJ, Martin A, Maas EW et al. In situ light responses of the proteorhodopsin-bearing 537
Antarctic sea-ice bacterium, Psychroflexus torques. ISME J 2017;11:2155–8. 538
Cabiscol E, Tamarit J, Ros J. Oxidative stress in bacteria and protein damage by reactive 539
oxygen species. Int Microbiol 2000;3:3–8. 540
Cohen NR, Gong W, Moran DM et al. Transcriptomic and proteomic responses of the 541
oceanic diatom Pseudo-nitzschia granii to iron limitation. Environ Microbiol 542
2018;20:3109–26. 543
Courties A, Riedel T, Rapaport A et al. Light-driven increase in carbon yield is linked to 544
maintenance in the proteorhodopsin-containing Photobacterium angustum S14. Front 545
Microbiol 2015;6:688. 546
Davey EW, Gentile JH, Erickson SJ et al. Removal of Trace Metals from Marine Cluster 547
Media. Limnol Oceanogr 1970;15:486–8. 548
Dixon SJ, Stockwell BR. The role of iron and reactive oxygen species in cell death. Nat 549
Chem Biol 2014;10:9–17. 550
Feng S, Powell SM, Wilson R et al. Light-stimulated growth of proteorhodopsin-bearing sea-551
ice psychrophile Psychroflexus torquis is salinity dependent. ISME J 2013;7:2206–13. 552
Feng S, Powell SM, Wilson R et al. Extensive gene acquisition in the extremely 553
psychrophilic bacterial species Psychroflexus torquis and the link to sea-ice ecosystem 554
specialism. Genome Biol Evol 2014;6:133–48. 555
Feng S, Powell SM, Wilson R et al. Proteomic Insight into Functional Changes of 556
Proteorhodopsin-Containing Bacterial Species Psychroflexus torquis under Different 557
Illumination and Salinity Levels. J Proteome Res 2015;14:3848–58. 558
Fourquez M, Devez A, Schaumann A et al. Effects of iron limitation on growth and carbon 559
metabolism in oceanic and coastal heterotrophic bacteria. Limnol Oceanogr 560
2014;59:349–60. 561
Fuhrman JA, Schwalbach MS, Stingl U. Proteorhodopsins: an array of physiological roles? 562
Nat Rev Microbiol 2008;6:488–94. 563
Giovannoni SJ, Bibbs L, Cho J-C et al. Proteorhodopsin in the ubiquitous marine bacterium 564
SAR11. Nature 2005;438:82–5. 565
Gómez-Consarnau L, Akram N, Lindell K et al. Proteorhodopsin Phototrophy Promotes 566
Survival of Marine Bacteria during Starvation. Eisen JA (ed.). PLoS Biol 567
2010;8:e1000358. 568
Gómez-Consarnau L, González JM, Coll-Lladó M et al. Light stimulates growth of 569
proteorhodopsin-containing marine Flavobacteria. Nature 2007;445:210–3. 570
Gómez-Consarnau L, González JM, Riedel T et al. Proteorhodopsin light-enhanced growth 571
linked to vitamin-B1 acquisition in marine Flavobacteria. ISME J 2016;10:1102–12. 572
Gómez-Consarnau L, Raven JA, Levine NM et al. Microbial rhodopsins are major 573
contributors to the solar energy captured in the sea. Sci Adv 2019;5:eaaw8855. 574
González JM, Fernández-Gómez B, Fernàndez-Guerra A et al. Genome analysis of the 575
proteorhodopsin-containing marine bacterium Polaribacter sp. MED152 (Flavobacteria). 576
Proc Natl Acad Sci U S A 2008;105:8724–9. 577
Gray DA, Dugar G, Gamba P et al. Extreme slow growth as alternative strategy to survive 578
deep starvation in bacteria. Nat Commun 2019;10:890. 579
Hild E, Takayama K, Olsson RM et al. Evidence for a role of rpoE in stressed and unstressed 580
cells of marine Vibrio angustum strain S14. J Bacteriol 2000;182:6964–74. 581
Ho A, Lonardo DP Di, Bodelier PLE. Revisiting life strategy concepts in environmental 582
microbial ecology. FEMS Microbiol Ecol 2017;93:fix006. 583
Holmquist L, Kjelleberg S. Changes in viability, respiratory activity and morphology of the 584
marine Vibrio sp. strain S14 during starvation of individual nutrients and subsequent 585
recovery. FEMS Microbiol Ecol 1993;12:215–23. 586
Holms H. Flux analysis and control of the central metabolic pathways in Escherichia coli. 587
FEMS Microbiol Rev 1996;19:85–116. 588
Hubbard JAM, Lewandowska KB, Hughes MN et al. Effects of iron-limitation of Escherichia 589
coli on growth, the respiratory chains and gallium uptake. Arch Microbiol 1986;146:80– 590
6. 591
Ilbert M, Bonnefoy V. Insight into the evolution of the iron oxidation pathways. Biochim 592
Biophys Acta - Bioenerg 2013;1827:161–75. 593
Kimura H, Young CR, Martinez A et al. Light-induced transcriptional responses associated 594
with proteorhodopsin-enhanced growth in a marine flavobacterium. ISME J 595
2011;5:1641–51. 596
Kirchman DL, Hanson TE. Bioenergetics of photoheterotrophic bacteria in the oceans. 597
Environ Microbiol Rep 2013;5:188–99. 598
Kjelleberg S, Humphrey BA, Marshall KC. Effect of interfaces on small, starved marine 599
bacteria. Appl Environ Microbiol 1982;43:1166–72. 600
Koedooder C, Guéneuguès A, Van Geersdaële R et al. The Role of the Glyoxylate Shunt in 601
the Acclimation to Iron Limitation in Marine Heterotrophic Bacteria. Front Mar Sci 602
2018;5, DOI: 10.3389/fmars.2018.00435. 603
Lauro FM, McDougald D, Thomas T et al. The genomic basis of trophic strategy in marine 604
bacteria. Proc Natl Acad Sci U S A 2009;106:15527–33. 605
Lemire A, Goudenège D, Versigny T et al. Populations, not clones, are the unit of vibrio 606
pathogenesis in naturally infected oysters. ISME J 2015;9:1523–31. 607
Lever MA, Rogers KL, Lloyd KG et al. Life under extreme energy limitation: a synthesis of 608
laboratory- and field-based investigations. Giudici-Orticoni M-T (ed.). FEMS Microbiol 609
Rev 2015;39:688–728. 610
Lis H, Shaked Y, Kranzler C et al. Iron bioavailability to phytoplankton: an empirical 611
approach. ISME J 2015;9:1003–13. 612
Malmcrona-Friberg K, Goodman A, Kjelleberg S. Chemotactic Responses of Marine Vibrio 613
sp. Strain S14 (CCUG 15956) to Low-Molecular-Weight Substances under Starvation 614
and Recovery Conditions. Appl Environ Microbiol 1990;56:3699–704. 615
Manoil D, Bouillaguet S. Oxidative Stress in Bacteria Measured by Flow Cytometry. 2018;6, 616
DOI: 10.19080/AIBM.2018.08.555726. 617
Marchetti A, Catlett D, Hopkinson BM et al. Marine diatom proteorhodopsins and their 618
potential role in coping with low iron availability. ISME J 2015;9:2745–8. 619
Marchetti A, Schruth DM, Durkin CA et al. Comparative metatranscriptomics identifies 620
molecular bases for the physiological responses of phytoplankton to varying iron 621
availability. Proc Natl Acad Sci 2012;109:E317–25. 622
Marie D, Partensky F, Jacquet S et al. Enumeration and Cell Cycle Analysis of Natural 623
Populations of Marine Picoplankton by Flow Cytometry Using the Nucleic Acid Stain 624
SYBR Green I. Appl Environ Microbiol 1997;63:186–93. 625
Martinez A, Bradley AS, Waldbauer JR et al. Proteorhodopsin photosystem gene expression 626
enables photophosphorylation in a heterologous host. Proc Natl Acad Sci U S A 627
2007;104:5590–5. 628
Matallana-Surget S, Cavicchioli R, Fauconnier C et al. Shotgun Redox Proteomics: 629
Identification and Quantitation of Carbonylated Proteins in the UVB-Resistant Marine 630
Bacterium, Photobacterium angustum S14. Gasset M (ed.). PLoS One 2013;8:e68112. 631
Matallana-Surget S, Joux F, Wattiez R et al. Proteome Analysis of the UVB-Resistant 632
Marine Bacterium Photobacterium angustum S14. Gasset M (ed.). PLoS One 633
2012;7:e42299. 634
Merchant SS, Helmann JD. Elemental Economy: Microbial Strategies for Optimizing Growth 635
in the Face of Nutrient Limitation. Adv Microb Physiol 2012;60:91–210. 636
Morel FMM, Rueter JG, Anderson DM et al. Aquil: A chemically definied phytoplankton 637
culture medium for trace metal studies. J Phycol 2008;15:135–41. 638
Mullarky E, Cantley LC. Diverting Glycolysis to Combat Oxidative Stress. In: Nakao, 639
Kazuwa; Minato, Nagahiro; Uemoto S (ed.). Innovative Medicine: Basic Research and 640
Development. Tokyo: Springer, 2015, 3–23. 641
Nyström T, Kjelleberg S. Role of Protein Synthesis in the Cell Division and Starvation 642
Induced Resistance to Autolysis of a Marine Vibrio during the Initial Phase of 643
Starvation. Microbiology 1989;135:1599–606. 644
Nyström T, Olsson RM, Kjelleberg S. Survival, stress resistance, and alterations in protein 645
expression in the marine vibrio sp. strain S14 during starvation for different individual 646
nutrients. Appl Environ Microbiol 1992;58:55–65. 647
Oppenheimer H. C., ZoBell C. The growth and viability of sixty-three species of marine 648
bacteria as influenced by hydrostatic pressure. J Mar Res 1952;11:10–8. 649
Palovaara J, Akram N, Baltar F et al. Stimulation of growth by proteorhodopsin phototrophy 650
involves regulation of central metabolic pathways in marine planktonic bacteria. PNAS 651
2014;111:e3650–8. 652
Pinhassi J, DeLong EF, Béjà O et al. Marine Bacterial and Archaeal Ion-Pumping 653
Rhodopsins: Genetic Diversity, Physiology, and Ecology. Microbiol Mol Biol Rev 654
2016;80:929–54. 655
Price N, Harrison G, Hering J et al. Preparation and Chemistry of the Artificial Algal Culture 656
Medium Aquil. Biol Oceanogr 1989;6:443–61. 657
Raven JA. Functional evolution of photochemical energy transformations in oxygen-658
producing organisms. Funct Plant Biol 2009;36:505–15. 659
Le Roux F, Binesse J, Saulnier D et al. Construction of a Vibrio splendidus mutant lacking 660
the metalloprotease gene vsm by use of a novel counterselectable suicide vector. Appl 661
Environ Microbiol 2007;73:777–84. 662
Le Roux F, Davis BM, Waldor MK. Conserved small RNAs govern replication and 663
incompatibility of a diverse new plasmid family from marine bacteria. Nucleic Acids Res 664
2011;39:1004–13. 665
Song Y, Cartron ML, Jackson PJ et al. Overproduction of proteorhodopsin enhances long-666
term viability of Escherichia coli. Appl Environ Microbiol 2020;86:e02087-19. 667
Steindler L, Schwalbach MS, Smith DP et al. Energy starved Candidatus Pelagibacter ubique 668
substitutes light-mediated ATP production for endogenous carbon respiration. Gilbert 669
JA (ed.). PLoS One 2011;6:e19725. 670
Stingl U, Tripp HJ, Giovannoni SJ. Improvements of high-throughput culturing yielded novel 671
SAR11 strains and other abundant marine bacteria from the Oregon coast and the 672
Bermuda Atlantic Time Series study site. ISME J 2007;1:361–71. 673
Sun Y, Zhang Y, Hollibaugh JT et al. Ecotype diversification of an abundant Roseobacter 674
lineage. Environ Microbiol 2017;19:1625–38. 675
Sunda W, Huntsman S. Effect of pH, light, and temperature on Fe–EDTA chelation and Fe 676
hydrolysis in seawater. Mar Chem 2003;84:35–47. 677
Tagliabue A, Bowie AR, Boyd PW et al. The integral role of iron in ocean biogeochemistry. 678
Nature 2017;543:51–9. 679
Terashima M, Ohashi K, Takasuka TE et al. Antarctic heterotrophic bacterium 680
Hymenobacter nivis P3 T displays light-enhanced growth and expresses putative 681
photoactive proteins. Environ Microbiol Rep 2019;11:227–35. 682
Thommen Q, Pfeuty B, Schatt P et al. Probing entrainment of Ostreococcus tauri circadian 683
clock by green and blue light through a mathematical modeling approach Quentin. Front 684
Genet 2015;6, DOI: 10.3389/fgene.2015.00065. 685
Tortell PD, Maldonado MT, Granger J et al. Marine bacteria and biogeochemical cycling of 686
iron in the oceans. FEMS Microbiol Ecol 1999. 687
Tortell PD, Maldonado MT, Price NM. The role of heterotrophic bacteria in iron-limited 688
ocean ecosystems. Nature 1996;383:330–2. 689
Touati D. Iron and Oxidative Stress in Bacteria. Arch Biochem Biophys 2000;373:1–6. 690
Val M-E, Skovgaard O, Ducos-Galand M et al. Genome Engineering in Vibrio cholerae: A 691
Feasible Approach to Address Biological Issues. Guttman DS (ed.). PLoS Genet 692
2012;8:e1002472. 693
Wang Z, O’Shaughnessy TJ, Soto CM et al. Function and Regulation of Vibrio campbellii 694
Proteorhodopsin: Acquired Phototrophy in a Classical Organoheterotroph. Harvey BK 695
(ed.). PLoS One 2012;7:e38749. 696
Yoshizawa S, Kumagai Y, Kim H et al. Functional characterization of flavobacteria 697
rhodopsins reveals a unique class of light-driven chloride pump in bacteria. Proc Natl 698
Acad Sci U S A 2014;111:6732–7. 699
Lundin A. Use of firefly luciferase in atp-related assays of biomass, enzymes, and 700
metabolites. Methods Enzymol 2000;305:346–70. 701
702
7. Table Legends
703
Table 1. Overview and aim of the different experiments performed with the P. angustum S14 704
wildtype (wt), the PR luminescent bioreporter (ptr-luc) and PR gene knockout (∆pr). 705
706
Table 2. Growth rates (µ) and maximum cell abundance of ptr-luc grown in Fe-replete and
707
Fe-limiting conditions, in the presence or absence of light. (n=3) 708
Table 3. Growth rates (µ) and cellular respiration rates derived from O2 measurements of P.
710
angustum S14 (wt) and ∆pr grown in Fe-limiting conditions (100 µM DFOB) and the 711
presence of constant light or dark conditions. Statistically significant values are marked in 712
bold. (n=3) 713
714
Table 4. ATP measurements taken at 20 h (coinciding with the exponential phase) for P.
715
angustum S14 (wt) grown in Fe-replete and Fe-limiting conditions and p-values of a 1-way 716
ANOVA comparing differences between light and dark conditions after a ln transformation in 717
order to meet the assumptions of homogeneity of variance. (n=4) 718
719
8. Figure Legends
720
Figure 1. Ptr-luc grown in Aquil medium and 6mM[C] glucose subjected to either (a) no
721
light, (b) red-light, (c) green-light and (d) blue-light. Light intensity for all wavelengths was 722
set at 30 µmol quanta m-2 s-1. An increase in luminescence occurs at ~8 hours and continues
723
to increase in blue light but not in the other light conditions. (n=5) 724
725
Figure 2. Ptr-luc grown in Fe-replete conditions in Aquil medium and 6mM[C] glucose
726
subjected to either dark (dark red circles) or constant blue light (light red circles; 30 µmol 727
quanta m-2 s-1). (a) Total luminescence where vertical dashed lines represent the time points
728
when cell counts were taken, (b) cell counts and (c) luminescence per cell. Total 729
luminescence increases after ~25 hours in the presence of both light and dark, which 730
coincides with the time cells are approaching the stationary phase. In the presence of light, 731
luminescence continues to increase and peaks at ~60 hours which coincides with slightly 732
elevated cell counts in the presence of light compared to dark conditions, albeit this is not 733
significantly different. (n=3) 734
735
Figure 3. Ptr-luc grown in Fe-limiting conditions (50 μM DFOB) in Aquil medium and
736
6mM[C] glucose subjected to either dark conditions (dark blue circles) or constant blue light 737
(light blue circles; 30 µmol quanta m-2 s-1). (a) total luminescence where vertical dashed
738
lines represent the time points when cell counts were taken, (b) cell counts and (c) 739
luminescence per cell. Total luminescence shows an increase in expression after ~20 hours in 740
the presence of both light and dark, which coincides with the time cells are approaching the 741
stationary phase. No clear difference between light and dark conditions were observed. (n=3) 742
743
Figure 4. The relationship between the growth rate (day-1) of P. angustum S14 (wt) for a
744
range of Fe-concentrations grown in either 0, 25, 50, 100% blue light (dark grey, grey, light 745
grey and white circles) where 100% light was equivalent to 60 µmol quanta m-2 s-1. Under
746
low Fe-concentrations (5.4 nM), the presence of light positively influences the growth rate 747
while under high Fe-concentrations (5.4 µM), the presence of light negatively influences the 748
growth rate. (n=3) 749
750
Figure 5. Mean cell volume (μm3) of P. angustum S14 (wt) at several time points grown in
751
either 6mM[C] of glucose in Fe-limiting (blue) or Fe-replete (red) conditions and subjected 752
to constant darkness (dark blue or red) or blue light (light blue or light red; 30 µmol quanta 753
m-2 s-1). At 1 hour, cell size was measured from acclimated cells grown overnight in glucose
754
and Fe-replete conditions. 24 hours coincides with the end of the exponential growth phase 755
31 and start of the exponential phase. 50 hours coincides with peak proteorhodopsin expression 756
and 75 hours when the expression of proteorhodopsin is in decline. (n=3) 757 758 9. Tables 759 760 761
Table 1. Overview and aim of the different experiments performed with the P. angustum S14
wildtype (wt), the PR luminescent bioreporter (ptr-luc) and PR gene knockout (∆pr).
Strain Fe-regime Carbon Light regime Aim
PR gene expression Pattern
ptr-luc +Fe +Fe
glucose glucose
dark, red, green, blue
dark, 12:12DL, 12:12LD, blue
PR gene expression in dark, red, green, or blue light PR gene expression and sensitivity towards switching-on or switching-off the light +Fe, -Fe glucose dark, blue PR gene expression under
Fe-replete and Fe-limited conditions
+Fe glucose
(gradient)
dark, blue PR gene expression under different glucose
concentrations
+Fe acetate,
serine
dark, blue PR gene expression under different carbon sources
Comparison between wt and ∆pr
wt, ∆pr Fe-gradient
glucose blue (gradient) Effect of light and Fe on growth rates and cell yield wt, ∆pr wt wt -Fe +Fe, -Fe +Fe, -Fe glucose glucose glucose dark, blue dark, blue dark, blue
Effect of light on growth rates and respiration rates using O2 measurements Effect of light on cell volume Effect of light on ATP concentrations
Table 2. Growth rates (µ) and maximum cell abundance of ptr-luc grown in Fe-replete and
Fe-limiting conditions, in the presence or absence of light. (n=3)
Conditions µ (day-1) Bacteria (108 cells mL-1)
Fe-rep + dark 7.4 ± 0.1 1.26 ± 0.09 Fe-rep + light 7.1 ± 0.4 1.31 ± 0.29 p-value p=0.9081 p=0.2345 Fe-lim + dark 4.0 ± 0.1 0.11 ± 0.08 Fe-lim + light 5.1 ± 1.0 0.11 ± 0.13 p-value p=0.1451 p=0.9948