Tautomerism in azo dyes: border cases of azo and hydrazo tautomers as possible NMR reference compounds
V. Denevaa, A. Lyckab, S. Hristovaa, A. Crochetc, K. M. Frommc, L. Antonova,*
a Institute of Organic Chemistry with Centre of Phytochemistry, Bulgarian Academy of
Sciences, Acad. G. Bonchev str., bl. 9, 1113 Sofia, Bulgaria
b Faculty of Science, University of Hradec Králové, Rokitanského 62, CZ-500 03 Hradec
Králové III, Czech Republic
c University of Fribourg, Department of Chemistry, Chemin du Musée 9, CH-1700 Fribourg,
Switzerland
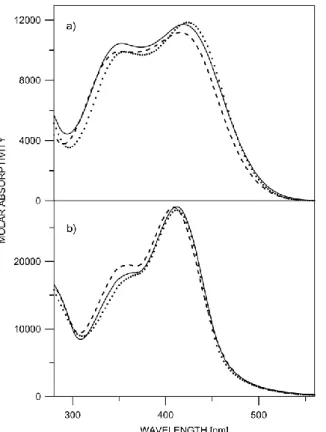
Figure S1. Absorption spectra of a) 2 in acetonitrile (---), benzene (…) and chloroform (___); b) 5 in acetonitrile (---), benzene (…) and chloroform (___).
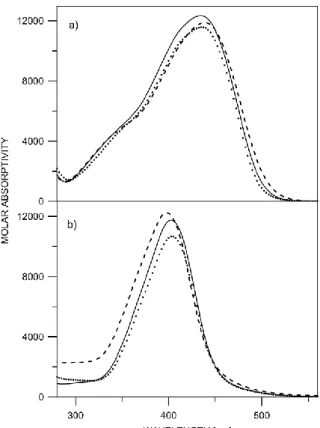
Figure S2. Absorption spectra of a) 3 in acetonitrile (---), benzene (…) and chloroform (___); b)
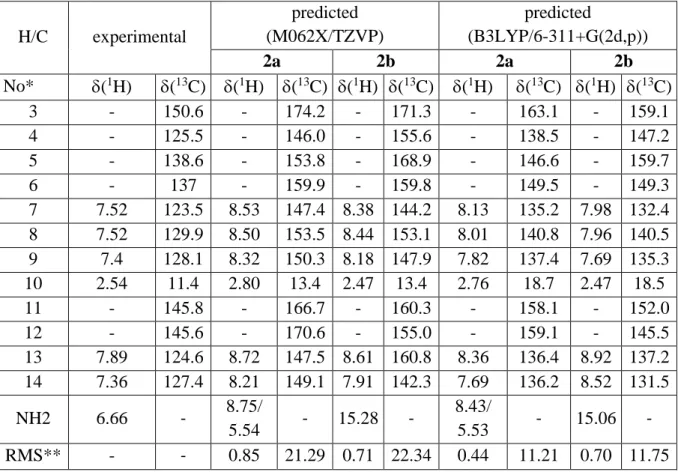
Table S1. Predicted and experimental NMR parameters in ppm of selected atoms of 2 in chloroform. H/C experimental predicted (M062X/TZVP) predicted (B3LYP/6-311+G(2d,p)) 2a 2b 2a 2b No* (1H) (13C) (1H) (13C) (1H) (13C) (1H) (13C) (1H) (13C) 3 - 150.6 - 174.2 - 171.3 - 163.1 - 159.1 4 - 125.5 - 146.0 - 155.6 - 138.5 - 147.2 5 - 138.6 - 153.8 - 168.9 - 146.6 - 159.7 6 - 137 - 159.9 - 159.8 - 149.5 - 149.3 7 7.52 123.5 8.53 147.4 8.38 144.2 8.13 135.2 7.98 132.4 8 7.52 129.9 8.50 153.5 8.44 153.1 8.01 140.8 7.96 140.5 9 7.4 128.1 8.32 150.3 8.18 147.9 7.82 137.4 7.69 135.3 10 2.54 11.4 2.80 13.4 2.47 13.4 2.76 18.7 2.47 18.5 11 - 145.8 - 166.7 - 160.3 - 158.1 - 152.0 12 - 145.6 - 170.6 - 155.0 - 159.1 - 145.5 13 7.89 124.6 8.72 147.5 8.61 160.8 8.36 136.4 8.92 137.2 14 7.36 127.4 8.21 149.1 7.91 142.3 7.69 136.2 8.52 131.5 NH2 6.66 - 8.75/ 5.54 - 15.28 - 8.43/ 5.53 - 15.06 - RMS** - - 0.85 21.29 0.71 22.34 0.44 11.21 0.70 11.75 * see Scheme 2 for the atom numbering; ** root mean square between experimental and predicted values.
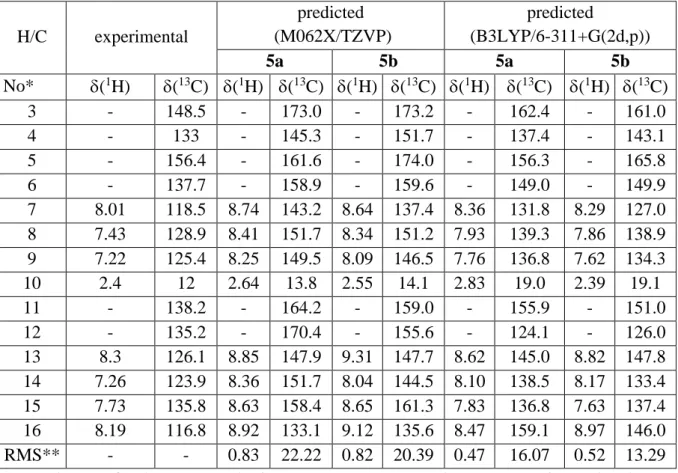
Table S2. Predicted and experimental NMR parameters in ppm of selected atoms of 5 in chloroform. H/C experimental predicted (M062X/TZVP) predicted (B3LYP/6-311+G(2d,p)) 5a 5b 5a 5b No* (1H) (13C) (1H) (13C) (1H) (13C) (1H) (13C) (1H) (13C) 3 - 148.5 - 173.0 - 173.2 - 162.4 - 161.0 4 - 133 - 145.3 - 151.7 - 137.4 - 143.1 5 - 156.4 - 161.6 - 174.0 - 156.3 - 165.8 6 - 137.7 - 158.9 - 159.6 - 149.0 - 149.9 7 8.01 118.5 8.74 143.2 8.64 137.4 8.36 131.8 8.29 127.0 8 7.43 128.9 8.41 151.7 8.34 151.2 7.93 139.3 7.86 138.9 9 7.22 125.4 8.25 149.5 8.09 146.5 7.76 136.8 7.62 134.3 10 2.4 12 2.64 13.8 2.55 14.1 2.83 19.0 2.39 19.1 11 - 138.2 - 164.2 - 159.0 - 155.9 - 151.0 12 - 135.2 - 170.4 - 155.6 - 124.1 - 126.0 13 8.3 126.1 8.85 147.9 9.31 147.7 8.62 145.0 8.82 147.8 14 7.26 123.9 8.36 151.7 8.04 144.5 8.10 138.5 8.17 133.4 15 7.73 135.8 8.63 158.4 8.65 161.3 7.83 136.8 7.63 137.4 16 8.19 116.8 8.92 133.1 9.12 135.6 8.47 159.1 8.97 146.0 RMS** - - 0.83 22.22 0.82 20.39 0.47 16.07 0.52 13.29 * see Scheme 2 for the atom numbering; ** root mean square between experimental and predicted values.
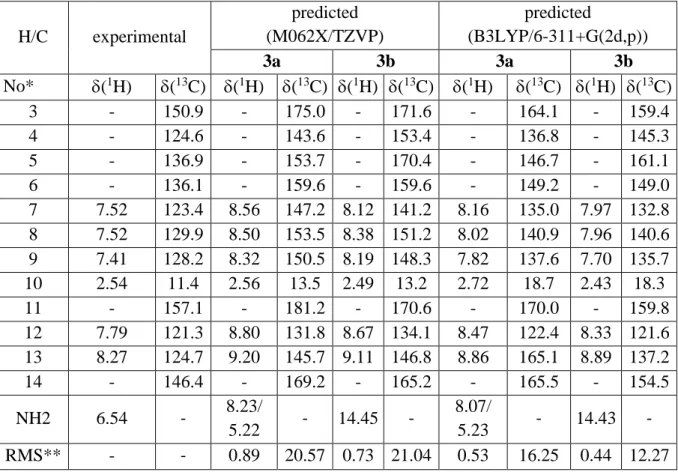
Table S3. Predicted and experimental NMR parameters in ppm of selected atoms of 3 in chloroform. H/C experimental predicted (M062X/TZVP) predicted (B3LYP/6-311+G(2d,p)) 3a 3b 3a 3b No* (1H) (13C) (1H) (13C) (1H) (13C) (1H) (13C) (1H) (13C) 3 - 150.9 - 175.0 - 171.6 - 164.1 - 159.4 4 - 124.6 - 143.6 - 153.4 - 136.8 - 145.3 5 - 136.9 - 153.7 - 170.4 - 146.7 - 161.1 6 - 136.1 - 159.6 - 159.6 - 149.2 - 149.0 7 7.52 123.4 8.56 147.2 8.12 141.2 8.16 135.0 7.97 132.8 8 7.52 129.9 8.50 153.5 8.38 151.2 8.02 140.9 7.96 140.6 9 7.41 128.2 8.32 150.5 8.19 148.3 7.82 137.6 7.70 135.7 10 2.54 11.4 2.56 13.5 2.49 13.2 2.72 18.7 2.43 18.3 11 - 157.1 - 181.2 - 170.6 - 170.0 - 159.8 12 7.79 121.3 8.80 131.8 8.67 134.1 8.47 122.4 8.33 121.6 13 8.27 124.7 9.20 145.7 9.11 146.8 8.86 165.1 8.89 137.2 14 - 146.4 - 169.2 - 165.2 - 165.5 - 154.5 NH2 6.54 - 8.23/ 5.22 - 14.45 - 8.07/ 5.23 - 14.43 - RMS** - - 0.89 20.57 0.73 21.04 0.53 16.25 0.44 12.27 * see Scheme 2 for the atom numbering; ** root mean square between experimental and predicted values.
Table S4. Predicted and experimental NMR parameters in ppm of selected atoms of 6 in chloroform. H/C experimental predicted (M062X/TZVP) predicted (B3LYP/6-311+G(2d,p)) 6a 6b 6a 6b No* (1H) (13C) (1H) (13C) (1H) (13C) (1H) (13C) (1H) (13C) 3 - 148.6 - 173.4 - 173.5 - 162.9 - 161.3 4 - 131.5 - 143.2 - 149.8 - 135.8 - 141.5 5 - 157.2 - 161.8 - 175.2 - 156.6 - 166.9 6 - 137.5 - 158.7 - 159.5 - 148.7 - 149.6 7 7.91 118.4 8.75 143.2 8.64 137.9 8.38 131.8 8.29 127.4 8 7.43 129 8.43 152.0 8.34 151.4 7.95 139.6 7.87 139.0 9 7.22 125.5 8.26 149.7 8.09 146.8 7.78 137.1 7.63 134.5 10 2.37 11.8 2.65 13.7 2.53 14.0 2.79 19.0 2.50 19.0 11 - 146.1 - 178.8 - 169.2 - 167.9 - 158.7 12 7.47 125.7 8.86 132.6 8.71 131.9 8.53 123.3 8.38 122.5 13 8.29 125.7 9.24 145.9 9.23 147.4 8.91 135.8 8.93 137.2 14 - 144.4 - 170.4 - 166.5 - 158.7 - 155.7 15 8.29 125.7 9.37 146.6 9.18 147.0 8.98 136.1 8.87 136.7 16 7.47 125.7 8.75 150.7 9.18 135.4 7.83 138.5 7.47 125.9 RMS** - - 1.03 21.13 0.94 19.28 0.89 11.65 0.51 9.92 * see Scheme 2 for the atom numbering; ** root mean square between experimental and predicted values.
Table S5. Linear correlation between experimental and predicted 1H NMR parameters.
compound level of theory a form b form
slope intercept R2 slope intercept R2 1 M062X/TZVP 1.15 0.17 0.999 1.19 0.59 0.997 B3LYP/6-311+G(2d,p) 1.14 0.51 0.997 1.11 0.40 0.996 2 M062X/TZVP 1.13 0.06 0.998 1.16 0.48 0.997 B3LYP/6-311+G(2d,p) 1.05 0.08 0.998 1.15 0.47 0.979 3 M062X/TZVP 1.18 0.41 0.998 1.16 0.43 0.998 B3LYP/6-311+G(2d,p) 1.07 0.01 0.998 1.12 0.42 0.998 4 M062X/TZVP 1.14 0.01 0.988 1.13 0.06 0.986 B3LYP/6-311+G(2d,p) 1.03 0.40 0.984 1.05 0.05 0.984 5 M062X/TZVP 1.09 0.14 0.988 1.13 0.14 0.997 B3LYP/6-311+G(2d,p) 0.98 0.55 0.987 1.08 0.17 0.978 6 M062X/TZVP 1.11 0.13 0.965 1.11 0.01 0.968 B3LYP/6-311+G(2d,p) 1.03 0.33 0.998 1.06 0.06 0.992 Table S6. Linear correlation between experimental and predicted 13C NMR parameters.
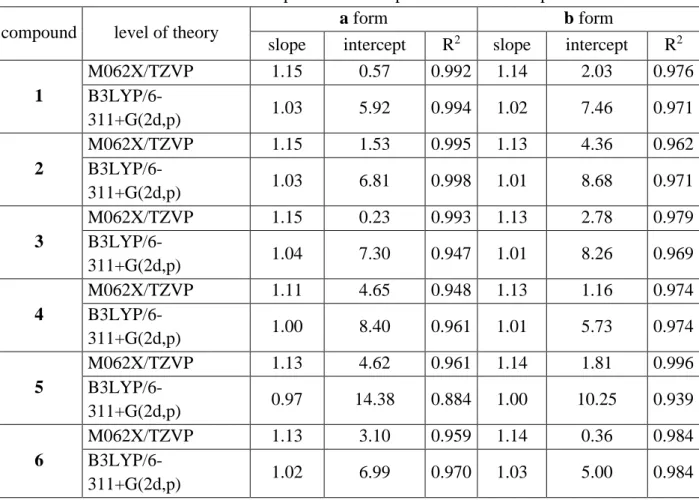
compound level of theory a form b form
slope intercept R2 slope intercept R2 1 M062X/TZVP 1.15 0.57 0.992 1.14 2.03 0.976 B3LYP/6-311+G(2d,p) 1.03 5.92 0.994 1.02 7.46 0.971 2 M062X/TZVP 1.15 1.53 0.995 1.13 4.36 0.962 B3LYP/6-311+G(2d,p) 1.03 6.81 0.998 1.01 8.68 0.971 3 M062X/TZVP 1.15 0.23 0.993 1.13 2.78 0.979 B3LYP/6-311+G(2d,p) 1.04 7.30 0.947 1.01 8.26 0.969 4 M062X/TZVP 1.11 4.65 0.948 1.13 1.16 0.974 B3LYP/6-311+G(2d,p) 1.00 8.40 0.961 1.01 5.73 0.974 5 M062X/TZVP 1.13 4.62 0.961 1.14 1.81 0.996 B3LYP/6-311+G(2d,p) 0.97 14.38 0.884 1.00 10.25 0.939 6 M062X/TZVP 1.13 3.10 0.959 1.14 0.36 0.984 B3LYP/6-311+G(2d,p) 1.02 6.99 0.970 1.03 5.00 0.984
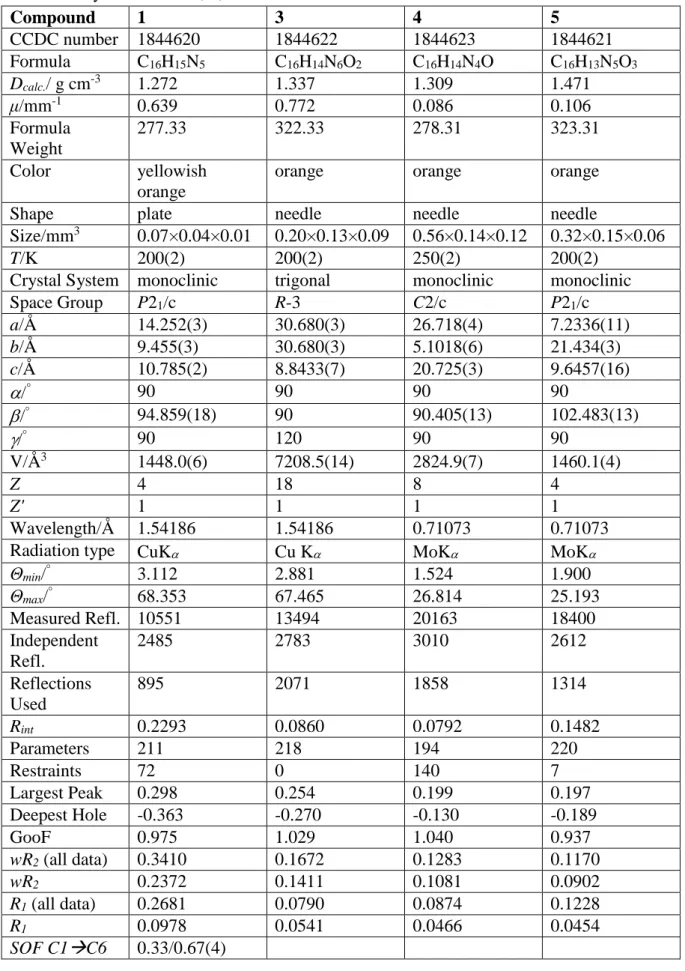
Table S7: Crystal data for 1, 3, 4 and 5. Compound 1 3 4 5 CCDC number 1844620 1844622 1844623 1844621 Formula C16H15N5 C16H14N6O2 C16H14N4O C16H13N5O3 Dcalc./ g cm-3 1.272 1.337 1.309 1.471 μ/mm-1 0.639 0.772 0.086 0.106 Formula Weight 277.33 322.33 278.31 323.31 Color yellowish orange
orange orange orange
Shape plate needle needle needle
Size/mm3 0.07×0.04×0.01 0.20×0.13×0.09 0.56×0.14×0.12 0.32×0.15×0.06
T/K 200(2) 200(2) 250(2) 200(2)
Crystal System monoclinic trigonal monoclinic monoclinic
Space Group P21/c R-3 C2/c P21/c a/Å 14.252(3) 30.680(3) 26.718(4) 7.2336(11) b/Å 9.455(3) 30.680(3) 5.1018(6) 21.434(3) c/Å 10.785(2) 8.8433(7) 20.725(3) 9.6457(16) /° 90 90 90 90 /° 94.859(18) 90 90.405(13) 102.483(13) /° 90 120 90 90 V/Å3 1448.0(6) 7208.5(14) 2824.9(7) 1460.1(4) Z 4 18 8 4 Z' 1 1 1 1 Wavelength/Å 1.54186 1.54186 0.71073 0.71073
Radiation type CuK Cu K MoK MoK
Θmin/° 3.112 2.881 1.524 1.900 Θmax/° 68.353 67.465 26.814 25.193 Measured Refl. 10551 13494 20163 18400 Independent Refl. 2485 2783 3010 2612 Reflections Used 895 2071 1858 1314 Rint 0.2293 0.0860 0.0792 0.1482 Parameters 211 218 194 220 Restraints 72 0 140 7 Largest Peak 0.298 0.254 0.199 0.197 Deepest Hole -0.363 -0.270 -0.130 -0.189 GooF 0.975 1.029 1.040 0.937 wR2 (all data) 0.3410 0.1672 0.1283 0.1170 wR2 0.2372 0.1411 0.1081 0.0902 R1 (all data) 0.2681 0.0790 0.0874 0.1228 R1 0.0978 0.0541 0.0466 0.0454 SOF C1C6 0.33/0.67(4)
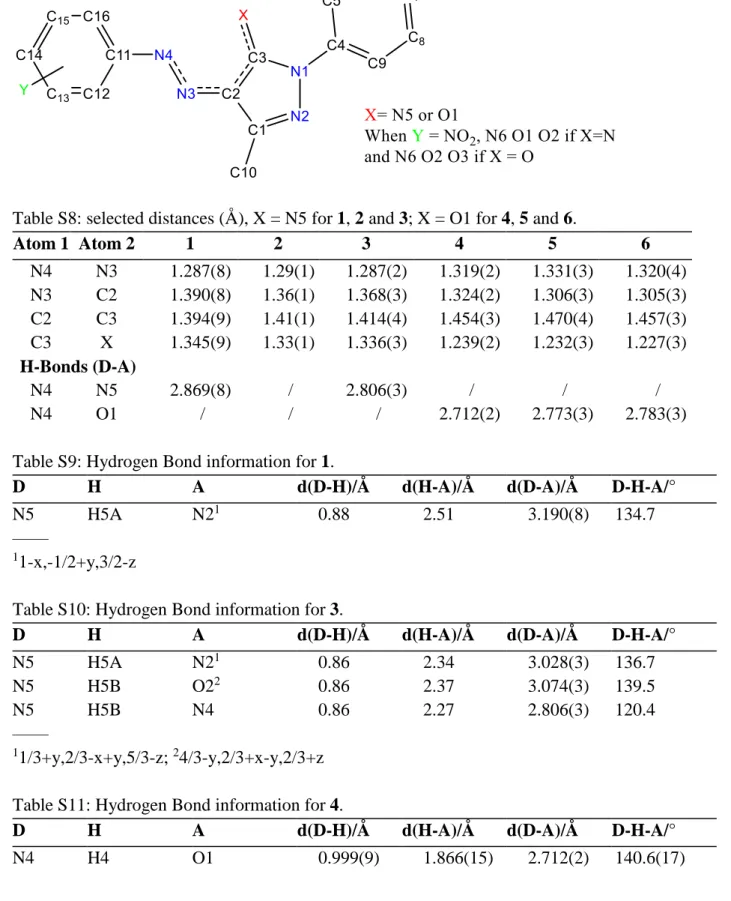
Scheme S1: X-ray labelling scheme.
Table S8: selected distances (Å), X = N5 for 1, 2 and 3; X = O1 for 4, 5 and 6.
Atom 1 Atom 2 1 2 3 4 5 6 N4 N3 1.287(8) 1.29(1) 1.287(2) 1.319(2) 1.331(3) 1.320(4) N3 C2 1.390(8) 1.36(1) 1.368(3) 1.324(2) 1.306(3) 1.305(3) C2 C3 1.394(9) 1.41(1) 1.414(4) 1.454(3) 1.470(4) 1.457(3) C3 X 1.345(9) 1.33(1) 1.336(3) 1.239(2) 1.232(3) 1.227(3) H-Bonds (D-A) N4 N5 2.869(8) / 2.806(3) / / / N4 O1 / / / 2.712(2) 2.773(3) 2.783(3)
Table S9: Hydrogen Bond information for 1.
D H A d(D-H)/Å d(H-A)/Å d(D-A)/Å D-H-A/°
N5 H5A N21 0.88 2.51 3.190(8) 134.7
––––
11-x,-1/2+y,3/2-z
Table S10: Hydrogen Bond information for 3.
D H A d(D-H)/Å d(H-A)/Å d(D-A)/Å D-H-A/°
N5 H5A N21 0.86 2.34 3.028(3) 136.7
N5 H5B O22 0.86 2.37 3.074(3) 139.5
N5 H5B N4 0.86 2.27 2.806(3) 120.4
––––
11/3+y,2/3-x+y,5/3-z; 24/3-y,2/3+x-y,2/3+z
Table S11: Hydrogen Bond information for 4.
D H A d(D-H)/Å d(H-A)/Å d(D-A)/Å D-H-A/°
Table S12: Hydrogen Bond information for 5.
D H A d(D-H)/Å d(H-A)/Å d(D-A)/Å D-H-A/°
N4 H4A O1 0.92 2.05 2.773(3) 134.1
N4 H4A O2 0.92 1.99 2.635(3) 125.8
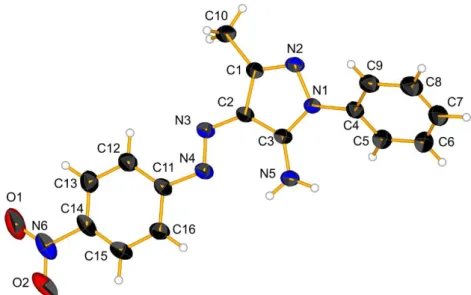
Figure S3. Molecular view of 2, hydrogen bond is draw as dashed blue line, labels have been exchange compare to the published structure.
Figure S5. Molecular view of 5, 50% of probability, hydrogen bonds are draw as dashed blue lines.
Figure S6. Molecular view of 6, hydrogen bond is draw as dashed blue line, labels have been exchange compare to the published structure.