HAL Id: hal-01344523
https://hal.sorbonne-universite.fr/hal-01344523
Submitted on 12 Jul 2016
HAL is a multi-disciplinary open access
archive for the deposit and dissemination of
sci-entific research documents, whether they are
pub-lished or not. The documents may come from
teaching and research institutions in France or
abroad, or from public or private research centers.
L’archive ouverte pluridisciplinaire HAL, est
destinée au dépôt et à la diffusion de documents
scientifiques de niveau recherche, publiés ou non,
émanant des établissements d’enseignement et de
recherche français ou étrangers, des laboratoires
publics ou privés.
Distributed under a Creative Commons Attribution| 4.0 International License
Effects on Long Non-Coding Transcripts in Human
Primary Monocytes
Jonas Carlsson Almlöf, Per Lundmark, Anders Lundmark, Bing Ge, Tomi
Pastinen, Alison H Goodall, François Cambien, Panos Deloukas, Willem H
Ouwehand, Ann-Christine Syvänen
To cite this version:
Jonas Carlsson Almlöf, Per Lundmark, Anders Lundmark, Bing Ge, Tomi Pastinen, et al.. Single
Nucleotide Polymorphisms with Cis-Regulatory Effects on Long Non-Coding Transcripts in Human
Primary Monocytes. PLoS ONE, Public Library of Science, 2014, 9 (7), pp.e102612.
�10.1371/jour-nal.pone.0102612�. �hal-01344523�
Effects on Long Non-Coding Transcripts in Human
Primary Monocytes
Jonas Carlsson Almlo¨f1, Per Lundmark1, Anders Lundmark1, Bing Ge2, Tomi Pastinen2, Cardiogenics Consortium", Alison H. Goodall3,4, Franc¸ois Cambien5, Panos Deloukas6,7,8, Willem H. Ouwehand7,9, Ann-Christine Syva¨nen1*
1 Department of Medical Sciences, Molecular Medicine and Science for Life Laboratory, Uppsala University, Uppsala, Sweden, 2 Department of Human Genetics, McGill University, Montre´al, Canada,3 Department of Cardiovascular Science, University of Leicester, Leicester, United Kingdom, 4 Leicester NIHR Biomedical Research Unit in Cardiovascular Disease, Glenfield Hospital, Leicester, United Kingdom,5 INSERM UMRS 937, Pierre and Marie Curie University and Medical School, Paris, France, 6 William Harvey Research Institute, Barts and The London School of Medicine and Dentistry, Queen Mary University of London, Heart Centre, Charterhouse Square London, United Kingdom,7 Wellcome Trust Sanger Institute, Hinxton, Cambridge, United Kingdom, 8 Princess Al-Jawhara Al-Brahim Centre of Excellence in Research of Hereditary Disorders (PACER-HD), King Abdulaziz University, Jeddah, Saudi Arabia,9 National Health Service Blood and Transplant, Cambridge Centre, Long Road, Cambridge, United Kingdom
Abstract
We applied genome-wide allele-specific expression analysis of monocytes from 188 samples. Monocytes were purified from white blood cells of healthy blood donors to detect cis-acting genetic variation that regulates the expression of long non-coding RNAs. We analysed 8929 regions harboring genes for potential long non-non-coding RNA that were retrieved from data from the ENCODE project. Of these regions, 60% were annotated as intergenic, which implies that they do not overlap with protein-coding genes. Focusing on the intergenic regions, and using stringent analysis of the allele-specific expression data, we detected robust regulatory SNPs in 258 out of 489 informative intergenic regions included in the analysis. The cis-regulatory SNPs that were significantly associated with allele-specific expression of long non-coding RNAs were enriched to enhancer regions marked for active or bivalent, poised chromatin by histone modifications. Out of the lncRNA regions regulated by cis-acting regulatory SNPs, 20% (n = 52) were co-regulated with the closest protein coding gene. We compared the identified cis-regulatory SNPs with those in the catalog of SNPs identified by genome-wide association studies of human diseases and traits. This comparison identified 32 SNPs in loci from genome-wide association studies that displayed a strong association signal with allele-specific expression of non-coding RNAs in monocytes, with p-values ranging from 6.761027to 9.5610289. The identified cis-regulatory SNPs are associated with diseases of the immune system, like multiple sclerosis and rheumatoid arthritis.
Citation: Carlsson Almlo¨f J, Lundmark P, Lundmark A, Ge B, Pastinen T, et al. (2014) Single Nucleotide Polymorphisms with Cis-Regulatory Effects on Long Non-Coding Transcripts in Human Primary Monocytes. PLoS ONE 9(7): e102612. doi:10.1371/journal.pone.0102612
Editor: Tanja Zeller, Medical University Hamburg, University Heart Center, Germany Received February 21, 2014; Accepted June 20, 2014; Published July 15, 2014
Copyright: ß 2014 Carlsson Almlo¨f et al. This is an open-access article distributed under the terms of the Creative Commons Attribution License, which permits unrestricted use, distribution, and reproduction in any medium, provided the original author and source are credited.
Funding: The study was performed as part of WP5 of the Cardiogenics EU FP6 project (grant number LSHM-CT-2006-037593). The work leading to these results has received funding from the European Union’s Seventh Framework Programme (FP7/2007-2013) under grant agreements no 262055, European Sequencing and Genotyping Infrastructure (ESGI) and 282510 BLUEPRINT. A full list of the investigators in the Blueprint consortium who contributed to the generation of the data is available from www.blueprint-epigenome.eu. The study received funding from the Swedish Research Council (grants no A028001 and C0524801 to A-CS) and the Knut and Alice Wallenberg Foundation (KAW 2011.0073 to A-CS). The funders had no role in study design, data collection and analysis, decision to publish, or preparation of the manuscript.
Competing Interests: The authors have declared that no competing interests exist. * Email: [email protected]
" Members of the CARDIOGENICS Consortium are listed in the Acknowledgements.
Introduction
Determination of allele-specific gene expression (ASE) levels by quantitative genotyping of heterozygous SNPs on the RNA level [1], with genome-wide panels of SNPs [2,3] can be used as a guide for identifying cis-acting genetic variants that regulate gene expression. ASE analysis is more powerful for detecting cis-regulated gene expression than the total expression levels of genes determined by regular eQTL analysis [4]. The power and precision of ASE analysis to detect cis-regulatory SNPs (cis-rSNPs) stems from the fact that the differential expression of the two alleles of a SNP are measured in the same environment and have
been exposed to the same environmental conditions in the cells from which the RNA was extracted [4]. Thus trans-acting and environmental factors that may affect gene expression are controlled for in ASE analysis. To adjust for possible methodo-logical differences in the efficiency of the genotyping assay to measure the two alleles of a SNP, such as the sequence context of a SNP or copy number variations, the relative amounts of the alleles measured in DNA, is used as a reference for quantification of the allelic expression. Genome-wide ASE analysis by SNP genotyping has been applied to map cis-regulation of protein coding genes associated with human diseases and traits in lymphoblastoid cell
lines [2,5], osteoblasts [6], fibroblasts [5,7], T-cells [8], and monocytes [5].
Long non-coding RNAs (lncRNAs) are involved in gene regulation and other cellular processes. LncRNAs such as XIST and TSIX, which are involved in X chromosome inactivation [9,10], are well known. Other well known examples of lncRNAs are AIR that suppresses gene expression via hypermethylation and HOTAIR that interacts with the Polycomb Repressive Complex 2 to silence the HOXD locus [11]. New functions for lncRNAs are continuously being discovered. LncRNAs can affect gene expres-sion in many ways, as scaffolds or guides for chromatin modifications, as decoys for reducing the amount of transcription factors interacting with chromatin, as signaling molecules reflect-ing active transcription factor complexes, or as reservoirs for microRNAs [12]. The mechanism for regulation of gene expression by lncRNAs usually involves formation of RNA-protein complexes that influence the gene expression. Recent large studies [13,14,15,16,17,18] have found that lncRNAs display positive correlations with expression of protein-coding genes in cis, and especially with genes that overlap with the antisense strand of a lncRNA. By investigating the effect of regulatory SNPs on the expression of lncRNAs using traditional microarray-based ex-pressed quantiative trait locus (eQTL) analysis of peripheral blood cells a recent study identified 112 cis-regulated lncRNAs [19].
The aim of our study was to apply ASE-analysis to identify cis-acting SNPs that regulate the expression of lncRNAs and to highlight previously unknown roles for lncRNAs in human complex diseases. We reasoned that ASE-analysis that is highly sensitive for detecting cis-rSNPs would be a powerful tool for studying cis-regulation of lncRNAs that are expressed at lower levels than protein-coding genes. To our knowledge ASE-analysis has not been previously used for studies of lncRNAs.
We analysed RNA extracted from human monocytes purified from white blood cells of 188 healthy blood donors using a genome-wide panel of SNPs. Monocytes were selected for analysis because they are a relevant cell type for multiple diseases. Our analysis included 8929 genomic regions that harbor genes for potential long non-coding RNA that were retrieved from the GENCODE database [18]. Of these gene regions, 60% were annotated as intergenic, and thus they do not overlap with protein-coding genes. Using stringent criteria for the identification of SNPs that regulate the expression of lncRNAs we identified 8267 cis-acting regulatory SNPs out of which 3910 are located in intergenic regions and 571 of these are located in enhancer regions marked as active or poised by histone modifications in monocytes. We also compared the indentified SNPs that regulate expression of lncRNAs with risk SNPs for complex diseases and traits previously identified in genome-wide association studies (GWAS). In this way we were able to obtain new functional clues for these disease associated GWAS loci. Additionally, we analysed co-expression between lncRNA genes and nearby protein coding genes, and found that 20% of the intergenic lncRNAs with a cis-rSNP were co-regulated with a protein-coding gene.
Materials and Methods Samples
Circulating monocytes were collected from healthy adult blood donors of European origin (n = 188) recruited from the United Kingdom National Blood Service Centre in Cambridge, UK as part of the Cardiogenics Transcriptomic Study [20]. Volunteer donors with a self-reported recent or acute illness were excluded. Donors with measured full blood cell count and C-reactive plasma
protein levels outside the normal ranges were also excluded from the study.
DNA was extracted from peripheral blood leukocytes using the guanidine hydrochloride - chloroform method. CD14+ magnetic microbeads (autoMACS Pro, Miltenyi Biotec, Bergisch Gladbach, Germany) were used to isolate monocytes from whole blood. RNA was extracted from cell pellets of freshly isolated monocytes by homogenization with Trizol-reagent (Invitrogen, Paisley, UK), chloroform-ethanol extraction and purification using Qiagen RNAeasy columns and reagents, followed by on-column DNase treatment. cDNA was synthesized using reagents from the Illumina TotalPrep RNA Amplification Kit, except that the poly-dT primers were substituted by random decamers (Applied Biosystems, Carlsbad, California, US).
Ethics statement
All participants in the study provided their written consent after a personal meeting with a study nurse. Written consent from each participant was recorded by name, date and signature on a standardized consent form. Both the consent form and the study has been reviewed and approved by the Cambridgeshire 1 Research Ethics Committee. The Research Ethics Committee is independent from the research institute and part of the UK Health Research Authority.
ENCODE lncRNA Regions
A total of 8929 genomic regions containing lncRNAs were retrieved from the GENCODE version 7 database [18]. From regions containing several transcripts, only the longest transcript was included to avoid analyzing completely overlapping regions. Of the lncRNA regions, 5346 were annotated as intergenic, which implies that that there is no overlap between the lncRNA and any known protein coding gene. The remaining 3583 regions overlap with either exons, introns or encompass an entire gene on the sense or anti- sense strand.
Allele-specific expression analysis
RNA (cDNA) and genomic DNA (gDNA) from the monocyte samples were genotyped using the Infinium assay and Human 1.2 M Duo custom BeadChips (Illumina, San Diego, California, USA) as described previously [4]. The genotype data from cDNA is used as a quantitative measure for gene expression in the calculation of the ASE-levels. The genotypes called in gDNA are used for three different purposes i.e. (i) to phase the SNP alleles on each chromosome to facilitate ASE-calling using multiple SNPs per transcript, (ii) to correct the ASE-levels in cDNA for possible allelic bias in gDNA due to sequence context of the SNPs, and (iii) to test for associations between potential cis-rSNPs and the ASE-levels of lncRNAS in a genomic region. Genotypes were called in gDNA using Genome Studio version 2009.2 (Illumina) with a call rate of 99% as the threshold for genotype calls for SNPs and 98% for samples. SNPs were further filtered on deviations from Hardy-Weinberg equilibrium with a p-value cutoff of 1026(Chi-squared test). One sample with higher than 40% call rate in cDNA were removed due to possible DNA contamination. The raw two-colour fluorescence signals from the Infinium assay were normalized to remove dependency of the allele fractions on the signal intensities of the fluorophores using a quadratic function with medians of bins for the two fluorescence colors. From the regression, the intensities were predicted based on the log10 values of the raw signal, which were used to adjust the allele fraction, see Methods S1 for further details and equations. ASE levels were calculated for each heterozygote SNP as the difference in normalized allele fractions between cDNA and gDNA: [Allele1cDNA/(Allele1cDNA+
Allele2cDNA)] – [Allele1gDNA/(Allele1gDNA+Allele2gDNA)]. Here,
gDNA, where the two SNP alleles are present in 1:1 ratio serves as a quantification standard for the relative expression levels of the two alleles in RNA.
A gene region without ASE will obtain an ASE-level close to 0, while a gene region with ASE, where the gDNA fraction is 0.5, will have an absolute ASE-level 0,X, = 0.5. The software IMPUTE 2 [21] (v2.1.0) was used to impute missing genotypes and to phase the genotypes across lncRNA gene regions in each individual sample. As a reference panel prefiltered haplotypes from HapMap3 release #2 [22] and 1000 Genomes pilot1 [23] available at the IMUPUTE 2 website were used. The ASE levels were assigned in each individual sample as the average ASE level for all heterozygous SNPs within a genomic region (ASE window), corresponding to the region of an annotated lncRNA. Windows of lncRNAs with less than three informative heterozygous SNPs were excluded. The association between SNPs and the ASE levels of lncRNAs was assessed by linear regression of the ASE levels in the groups of samples with heterozygous SNPs and homozygous SNPs [4]. In summary, homozygous SNPs (AA and BB) are in one group with an expected ASE-level close to zero, and heterozygous SNPs are either AB or BA with a stochastically determined direction during phasing. In the case of significant ASE the AB and BA group will on average obtain different signs of the ASE-level. SNPs with significant associations with allele specific expression are denoted as cis-rSNPs (Figure S1).
All analyses described above were performed and data is presented using the NCBI36/hg18 assembly as reference genome.
Refseq protein coding regions
Protein coding regions extracted from the Refseq database were analysed to detect SNPs with association signals that overlap with those from lncRNAs. The total number of transcripts in Refseq (downloaded 12th of January 2013) was 42797. To retain only protein coding genes, all genes annotated as RNA genes in the GeneCards database [24] were removed, leaving 38387 tran-scripts. To avoid completely overlapping transcripts, 19654 transcripts that are a subsequence of another transcript were removed. As for lncRNAs, only regions that contained at least three informative SNPs were included in the analysis, leaving 10345 protein-coding regions for further analysis.
Determination of total gene expression levels using the genotype data
The sum of the raw fluorescence signal intensities from both alleles of a SNP in cDNA was used as a measure of total gene expression in the position of the SNP. The average sum of the SNP signals across each lncRNA window and across all samples represents the total expression value for each lncRNA window. A stringent average signal threshold of 1000 fluorescence units for all 188 samples was set for the summed signal intensities, see Figure S2.
Enhancer regions
Monocyte chromatin immunoprecipitation sequencing (ChIP-seq) data was retrieved from the Blueprint project [25]. We analysed the four samples available in the Blueprint data using two chromatin signatures for each sample; H3K27ac, corresponding to an active enhancer [26,27] and H3K4me1, corresponding to a poised enhancer [28,29]. The peaks supplied in the Blueprint data had been called by MACS2 using the standard parameters for each signature. For a ChIP-seq peak to be included in our analysis, we required a p-value of 1025 in at least two out of four
overlapping peaks. To be counted as an overlapping peak the nucleotide overlap was required to be over 50%. This resulted in 22091 peaks for H3K27ac and 32692 peaks for H3K4me1.
Co-expression of lncRNA and closest protein coding gene
We investigated to what extent expression of lncRNA genes with a cis-rSNP were correlated with gene expression of the closest protein coding gene. For this purpose we divided the samples into three groups based on three genotype combinations of the most significantly associated cis-rSNP (AA, AB/BA, BB). For each expressed gene region we calculated the average signal intensity for both alleles and used this value as a measure of gene expression levels. Next, we performed linear regression analysis with the three genotype groups as x-values and the average total expression levels as y-values in order to obtain a p-value for the co-expression.
Results
Allele-specific expression of lncRNA regions
We explored cis-regulation of 8929 genomic regions harboring lncRNA from the ENCODE project using allele-specific expres-sion (ASE) analysis of 188 RNA samples from human primary monocytes. To determine ASE, we genotyped RNA (cDNA) and genomic DNA from the monocytes using a genome-wide panel of 1.2 million SNP markers [4]. To be informative for the detection of ASE, a SNP has to be heterozygous in DNA and expressed at a detectable level in RNA. Out of the 8929 lncRNA regions, 60% were annotated as intergenic. 1298 regions contain at least three informative SNPs and out of these 1122 regions (489 intergenic regions) showed a signal intensity above background and were considered to be expressed in the monocytes and were thus included in the ASE analysis. Of the individual SNPs in the lncRNA regions, two thirds have an intensity level above 1000 in at least 90% of the samples. We found that the mean expression levels of the lncRNAs were 1.5-fold lower than the expression levels of exons (Figure 1), while the lncRNAs were expressed at a 1.5-fold and 5.5-fold higher level than intronic and inter protein coding gene regions, respectively.
The definitions of exon and intron boundaries were taken from Refseq. As protein coding genes are on average expressed at higher levels than lncRNAs, the ASE signal for lncRNA that overlap with protein coding genes is hard to distinguish from that of a protein-coding gene. Because of this, we focus on the intergenic lncRNA regions where the ASE data is most reliable.
For the ASE analysis, the genotypes of 194530 SNPs located within 250 kb upstream and downstream of the lncRNA regions were tested for their association with the ASE levels of the corresponding expressed lncRNAs, using linear regression, see Manhattan plot in Figure 2. A p-value cut-off of p,1026, based on the number of tests performed and adjusted for SNPs in high LD (.0.9), was used to correct the association signals for multiple testing. In addition a threshold of 0.05 for the slope of the regression line was applied to exclude SNPs with low effects on ASE. This value corresponds to approximately a 20% expression difference between the two alleles and was set as a reasonable threshold for biological relevance. To avoid false positives with inflated p-values, we only retained associations that were based on at least four data points for each allele combination for the calculation of the p-value [4] (see example regression plots in Figure S3). Using these criteria, we detected 258 intergenic (53%) lncRNAs with at least one associated cis-rSNP (Table S1). The associated intergenic lncRNA regions varied in size from 0.9 kb to 547 kb. A total of 8267 of the 194530 tested SNPs (4.2%) were
associated with ASE of a lncRNA region (p-value,1026) in the 188 analysed monocyte samples, and for the intergenic lncRNA regions 3910 out of 79628 tested SNPs (4.9%) were significantly associated cis-rSNPs.
To allow comparison between ASE of lncRNA genes and protein coding Refseq genes, we applied the same procedure for ASE analysis to the Refseq gene regions as for the lncRNAs. This analysis identified 8604 cis-rSNP out of 108881 tested SNPs (7.9%) in 471 out of 10345 regions (4.6%) that were associated with ASE of a Refseq gene.
Associated SNPs in enhancer regions
We identified 571 cis-rSNPs located in enhancer regions marked as active or poised by histone modifications in monocytes. To determine if the cis-rSNPs for lncRNAs are enriched in enhancer regions, we calculated the fold enrichment of significantly associated cis-rSNPs defined by ASE analysis of intergenic lncRNA regions to histone marks for active enhancers (H3K27ac) and bivalent, poised enhancers (H3K4me1) in monocytes. The fold enrichment was determined by comparing the fraction of significantly associated SNPs in enhancer regions with the fraction of non-significant (p-value.0.5) SNPs in enhancer regions. Of the
Figure 1. Comparison of total expression levels of regions annotated to intergenic lncRNAs, exons, introns, and intergenic regions. The horizontal axes in the panels show bins of fluorescence signals from the genotyping data, summed for both alleles to give a measure for total expression. The average expression levels of annotated transcripts were 4900 fluorescence units in exons, 2100 in introns, 590 in intergenic regions, compared to 3300 in the intergenic lncRNA regions that were used in the ASE analysis. The vertical axes show the number of observations in each bin.
significantly associated SNPs, 2.1% were located in H3K27ac peaks compared to 1.2% for non-significantly associated SNPs, which corresponds to a 1.72-fold enrichment (p-value 9.061026, Fisher’s exact test). For H3K4me1 we observed a 1.54-fold enrichment (p-value 3.1610216, Fisher’s exact test) of significantly associated SNPs, with 12.5% of the significant SNPs located in the enhancer peaks, while this number was 8.1% for non-significant SNPs. For protein coding genes the percentages and fold enrichment are similar to those for lncRNA for H3K27ac with 2.2% and 1.5% for significant and non-significant SNPs, respectively, and 1.43 fold enrichment (p-value 7.061026, Fisher’s exact test) and less pronounced for H3K4me1 with 9.8% and 8.5% for significant and non-significant SNPs, respectively, and 1.15 fold enrichment (p-value 3.561024, Fisher’s exact test). This result shows that enhancers have a regulatory cis-effect on expression of not only protein coding genes, but also lncRNAs.
Co-expression of lncRNA and closest protein coding gene
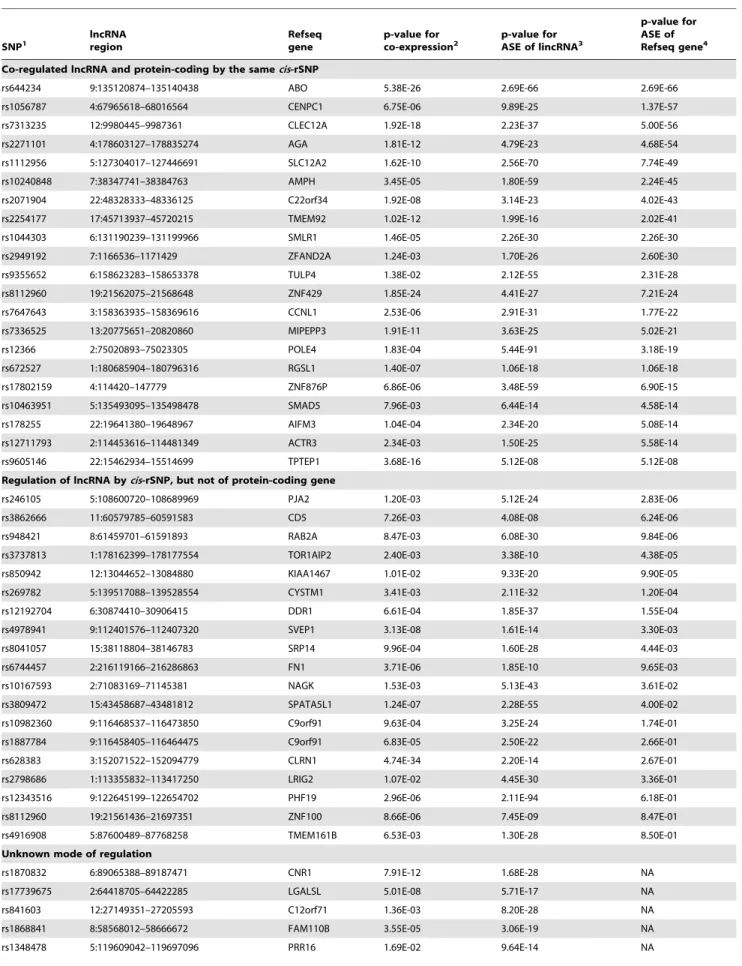
Next we investigated whether the lncRNA genes and nearby protein coding genes are co-expressed and co-regulated by a cis-rSNP. In our data 52 (20%) of the identified intergenic lncRNA regions to which a cis-acting regulatory SNP was associated were also correlated with the expression level of a protein-coding gene
at a false discovery rate (FDR) of 10%, suggesting co-regulation of the genes, see Table 1. We found that 21 of the cis-rSNPs are significantly associated both with ASE of a lncRNA and ASE of the closest protein coding gene, which implies that the expression of the lncRNA and the protein coding genes are regulated by the same cis-rSNP. For 19 cis-rSNPs the ASE signal is unique to a lncRNA, which could be an indication of involvement of the lncRNA in the regulation of the expression of an adjacent protein coding gene as has been suggested in previous studies [14,16]. The remaining 12 cis-rSNPs had a distance .250 kb to the nearest protein coding gene and the ASE signal could therefore not be evaluated.
GWAS lead SNPs overlap with cis-rSNP for lncRNAs
Next we superimposed the cis-rSNP associated with ASE of intergenic lncRNAs in monocytes with SNPs identified in GWAS of human diseases and traits, listed in the National Human Genome Research Institute (NHGRI) GWAS Catalog [30]. The GWAS catalog (downloaded 12thof January 2013) includes 9617 entries, 641 traits and 7797 unique SNPs. We identified SNPs associated with 32 loci high-lighted by GWAS that are also cis-rSNP for lncRNAs. The cis-cis-rSNP are the same as the GWAS associated SNP for 25 of the loci, while seven cis-SNPs are linkage disequilibrium (LD) proxies to the lead GWAS SNPs, with five
Figure 2. Manhattan plot. Manhattan plot with the p-values from ASE association tests between SNPs and lncRNAs on the vertical axis and the genomic lncRNA regions analysed in the study on the horizontal axis. The p-value cut-off of 1026is shown as a grey line.
Table 1. Co-expressed lncRNA regions and protein-coding genes. SNP1 lncRNA region Refseq gene p-value for
co-expression2 p-value for
ASE of lincRNA3
p-value for ASE of Refseq gene4 Co-regulated lncRNA and protein-coding by the samecis-rSNP
rs644234 9:135120874–135140438 ABO 5.38E-26 2.69E-66 2.69E-66
rs1056787 4:67965618–68016564 CENPC1 6.75E-06 9.89E-25 1.37E-57
rs7313235 12:9980445–9987361 CLEC12A 1.92E-18 2.23E-37 5.00E-56
rs2271101 4:178603127–178835274 AGA 1.81E-12 4.79E-23 4.68E-54
rs1112956 5:127304017–127446691 SLC12A2 1.62E-10 2.56E-70 7.74E-49
rs10240848 7:38347741–38384763 AMPH 3.45E-05 1.80E-59 2.24E-45
rs2071904 22:48328333–48336125 C22orf34 1.92E-08 3.14E-23 4.02E-43
rs2254177 17:45713937–45720215 TMEM92 1.02E-12 1.99E-16 2.02E-41
rs1044303 6:131190239–131199966 SMLR1 1.46E-05 2.26E-30 2.26E-30
rs2949192 7:1166536–1171429 ZFAND2A 1.24E-03 1.70E-26 2.60E-30
rs9355652 6:158623283–158653378 TULP4 1.38E-02 2.12E-55 2.31E-28
rs8112960 19:21562075–21568648 ZNF429 1.85E-24 4.41E-27 7.21E-24
rs7647643 3:158363935–158369616 CCNL1 2.53E-06 2.91E-31 1.77E-22
rs7336525 13:20775651–20820860 MIPEPP3 1.91E-11 3.63E-25 5.02E-21
rs12366 2:75020893–75023305 POLE4 1.83E-04 5.44E-91 3.18E-19
rs672527 1:180685904–180796316 RGSL1 1.40E-07 1.06E-18 1.06E-18
rs17802159 4:114420–147779 ZNF876P 6.86E-06 3.48E-59 6.90E-15
rs10463951 5:135493095–135498478 SMAD5 7.96E-03 6.44E-14 4.58E-14
rs178255 22:19641380–19648967 AIFM3 1.04E-04 2.34E-20 5.08E-14
rs12711793 2:114453616–114481349 ACTR3 2.34E-03 1.50E-25 5.58E-14
rs9605146 22:15462934–15514699 TPTEP1 3.68E-16 5.12E-08 5.12E-08
Regulation of lncRNA bycis-rSNP, but not of protein-coding gene
rs246105 5:108600720–108689969 PJA2 1.20E-03 5.12E-24 2.83E-06
rs3862666 11:60579785–60591583 CD5 7.26E-03 4.08E-08 6.24E-06
rs948421 8:61459701–61591893 RAB2A 8.47E-03 6.08E-30 9.84E-06
rs3737813 1:178162399–178177554 TOR1AIP2 2.40E-03 3.38E-10 4.38E-05
rs850942 12:13044652–13084880 KIAA1467 1.01E-02 9.33E-20 9.90E-05
rs269782 5:139517088–139528554 CYSTM1 3.41E-03 2.11E-32 1.20E-04
rs12192704 6:30874410–30906415 DDR1 6.61E-04 1.85E-37 1.55E-04
rs4978941 9:112401576–112407320 SVEP1 3.13E-08 1.61E-14 3.30E-03
rs8041057 15:38118804–38146783 SRP14 9.96E-04 1.60E-28 4.44E-03
rs6744457 2:216119166–216286863 FN1 3.71E-06 1.85E-10 9.65E-03
rs10167593 2:71083169–71145381 NAGK 1.53E-03 5.13E-43 3.61E-02
rs3809472 15:43458687–43481812 SPATA5L1 1.24E-07 2.28E-55 4.00E-02
rs10982360 9:116468537–116473850 C9orf91 9.63E-04 3.25E-24 1.74E-01
rs1887784 9:116458405–116464475 C9orf91 6.83E-05 2.50E-22 2.66E-01
rs628383 3:152071522–152094779 CLRN1 4.74E-34 2.20E-14 2.67E-01
rs2798686 1:113355832–113417250 LRIG2 1.07E-02 4.45E-30 3.36E-01
rs12343516 9:122645199–122654702 PHF19 2.96E-06 2.11E-94 6.18E-01
rs8112960 19:21561436–21697351 ZNF100 8.66E-06 7.45E-09 8.47E-01
rs4916908 5:87600489–87768258 TMEM161B 6.53E-03 1.30E-28 8.50E-01
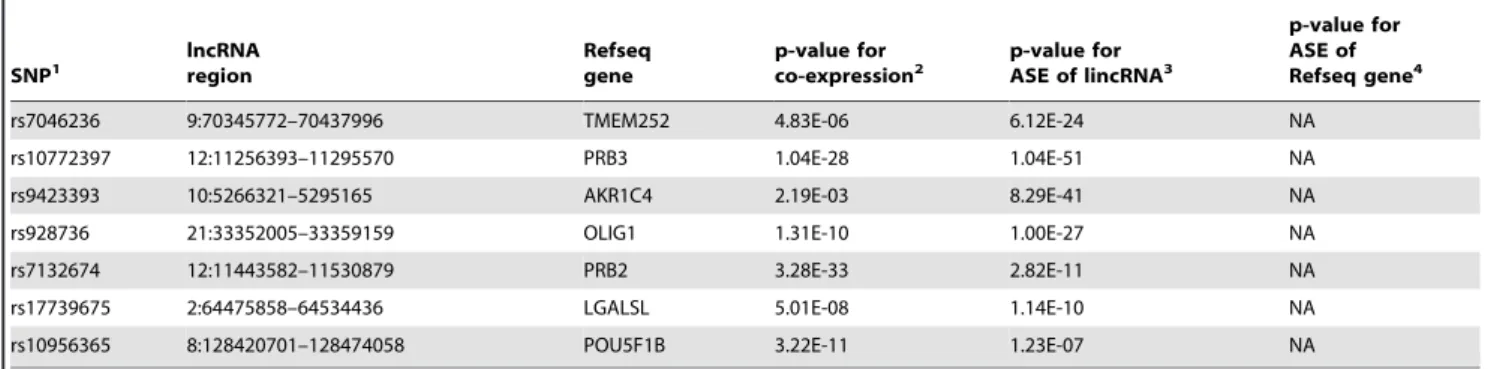
Unknown mode of regulation
rs1870832 6:89065388–89187471 CNR1 7.91E-12 1.68E-28 NA
rs17739675 2:64418705–64422285 LGALSL 5.01E-08 5.71E-17 NA
rs841603 12:27149351–27205593 C12orf71 1.36E-03 8.20E-28 NA
rs1868841 8:58568012–58666672 FAM110B 3.55E-05 3.06E-19 NA
SNPs having LD = 1.0 and two having LD. = 0.88. Table 2 summarizes the data for overlapping GWAS SNPs and cis-rSNP associated with ASE of lncRNA regions as well as the phenotypes to which these SNPs were associated in GWAS. Figure 3 exemplifies a lncRNA region with association between a SNP reported in GWAS and allele-specific expression. For additional examples see Figure S4. The association signals highlight 26 unique traits, out of which 9 are related to the immune system, which is not unexpected given that monocytes function in the immune system. Notably, three of the cis-rSNP that were significantly associated with ASE of a lncRNA are located in an intron of a protein coding gene, illustrating a direct or indirect regulatory function of an intronic SNP. One locus is reported by GWAS to be associated with a non-coding gene (genomic region: 2:19067188–19369296), which we confirm here by a cis-rSNP for the same lncRNA gene. Furthermore, when searching for overlaps between cis-rSNP associated with lncRNA and GWAS SNPs that are located in active enhancer regions in monocytes, we detected three GWAS SNPs that are located in a ChIP-seq peak for H3K4me1, and seven additional SNPs that are in the 2.5 kb enhancer regions flanking the histone mark. For H3K27ac no overlap between the cis-rSNP and the actual ChIP-seq peak was found, but five SNPs were located in the 2.5 kb flanking region. The number of overlapping GWAS SNPs – cis-rSNPs that map to an enhancer region are enriched at the same level as cis-rSNPs in general. For these GWAS SNPs the effect on the enhancer could be the functional mechanism.
For Refseq protein coding regions we found 458 loci where a reported GWAS SNP overlaps with a cis-rSNP or a proxy cis-rSNP in high LD (31 SNPs with LD 1.0 and 29 with LD.0.81 (Table S2). As for the lncRNAs a high fraction (n = 112) of the traits are related to immune diseases.
Discussion
The combination of a large number of samples from primary monocytes and the sensitive genotyping method for detecting cis-regulatory SNPs based on allele-specific gene expression [4] renders our study well powered for detecting cis-regulatory SNPs that affect expression of long non-coding RNAs, which are expressed at a lower level than protein-coding genes. In the ASE approach transcript are detected using a genome-wide panel of SNPs markers, and hence the use of predefined hybridization probes for each transcript is circumvented. This unbiased
detection of expressed transcripts is an advantage of ASE analysis over expression microarrays. This advantage is shared by ASE and ‘‘next’’ generation transcriptome sequencing (RNA-seq). An advantage of RNA-seq compared to ASE analysis using SNP genotyping is that alternatively spliced transcripts and strand specific gene expression can be detected, provided that the sequencing coverage is sufficient. However, ASE analysis using RNA-seq suffers from the drawback of being highly affected by the reference bias [31,32], although methods that can correct for most of the bias have been developed recently [33,34]. Moreover, lowly expressed genes obtain very low coverage in RNA-seq.
In this study we focused our ASE analysis of monocytes on 5346 lncRNAs that were annotated by the ENCODE project as intergenic without overlap with protein coding genes. Thus we ensured that our analysis targeted truly lncRNA genes and was not confounded by overlapping protein-coding genes. Using stringent criteria for calling ASE, we identified 258 lncRNAs that were regulated by at least one cis-rSNP. We observed correlated expression of 20% of the lncRNAs with their neighbouring protein-coding genes, and co-regulation of a lncRNA and a neighbouring protein coding gene by the same cis-rSNP for approximately half of these lncRNA genes. This finding is consistent with a recent study of peripheral blood cells, where 75% of 112 lncRNAs that were mapped using traditional eQTL analysis were found to be regulated independently of nearby protein-coding genes [19]. Because the ASE analysis used in our study only detects cis-regulation, ASE analysis allows the dissection of cis-effects by lncRNAs that influence the transcription of nearby genes. If the expression level of a lncRNA and a nearby protein coding gene are correlated, and they both show significant ASE association with the same cis-rSNP, it is likely that the cis-rSNP directly regulates the protein coding gene. If the expression levels between a protein-coding and lncRNA gene are correlated, but there is no shared association with a cis-SNP, the lncRNA may be a regulatory factor that affects the expression of the adjacent protein coding gene. In our ASE data set we found that these two putative mechanisms occur at similar frequencies. However, using the ASE approach, trans-acting regulatory mechanisms for co-expressed genes would remain undetected. A recent study used traditional eQTL analysis of monocytes found several trans-regulated modules of co-expressed protein coding genes. However, lncRNA expression was not addressed in this study [35]. Table 1. Cont. SNP1 lncRNA region Refseq gene p-value for
co-expression2 p-value for
ASE of lincRNA3
p-value for ASE of Refseq gene4
rs7046236 9:70345772–70437996 TMEM252 4.83E-06 6.12E-24 NA
rs10772397 12:11256393–11295570 PRB3 1.04E-28 1.04E-51 NA
rs9423393 10:5266321–5295165 AKR1C4 2.19E-03 8.29E-41 NA
rs928736 21:33352005–33359159 OLIG1 1.31E-10 1.00E-27 NA
rs7132674 12:11443582–11530879 PRB2 3.28E-33 2.82E-11 NA
rs17739675 2:64475858–64534436 LGALSL 5.01E-08 1.14E-10 NA
rs10956365 8:128420701–128474058 POU5F1B 3.22E-11 1.23E-07 NA
1
All 52 significantly co-expressed lncRNA and protein coding genes with a lncRNA associated cis-rSNP are listed. 2
Multiple testing correction using FDR of 10%, 3
The p-value cut-off for significant ASE is 1026 , 4
ASE p-value for a Refseq gene is shown for all regions that are co-expressed with a lncRNA and have an overlapping ASE analysis window, NA otherwise. doi:10.1371/journal.pone.0102612.t001
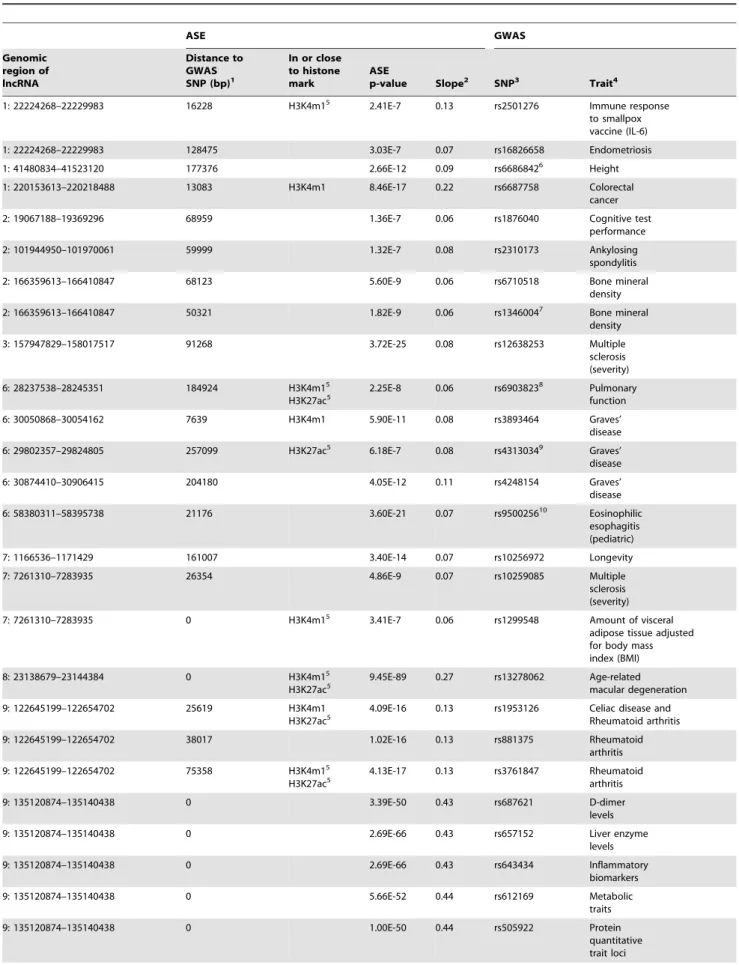
Table 2. SNPs associated with allele-specific expression of lncRNA windows with published trait- or disease-associations from genome-wide association studies.
ASE GWAS Genomic region of lncRNA Distance to GWAS SNP (bp)1 In or close to histone mark ASE p-value Slope2 SNP3 Trait4 1: 22224268–22229983 16228 H3K4m15
2.41E-7 0.13 rs2501276 Immune response
to smallpox vaccine (IL-6) 1: 22224268–22229983 128475 3.03E-7 0.07 rs16826658 Endometriosis 1: 41480834–41523120 177376 2.66E-12 0.09 rs66868426 Height 1: 220153613–220218488 13083 H3K4m1 8.46E-17 0.22 rs6687758 Colorectal cancer
2: 19067188–19369296 68959 1.36E-7 0.06 rs1876040 Cognitive test
performance
2: 101944950–101970061 59999 1.32E-7 0.08 rs2310173 Ankylosing
spondylitis
2: 166359613–166410847 68123 5.60E-9 0.06 rs6710518 Bone mineral
density 2: 166359613–166410847 50321 1.82E-9 0.06 rs13460047 Bone mineral density 3: 157947829–158017517 91268 3.72E-25 0.08 rs12638253 Multiple sclerosis (severity) 6: 28237538–28245351 184924 H3K4m15 H3K27ac5 2.25E-8 0.06 rs69038238 Pulmonary function 6: 30050868–30054162 7639 H3K4m1 5.90E-11 0.08 rs3893464 Graves’ disease 6: 29802357–29824805 257099 H3K27ac5 6.18E-7 0.08 rs43130349 Graves’ disease 6: 30874410–30906415 204180 4.05E-12 0.11 rs4248154 Graves’ disease 6: 58380311–58395738 21176 3.60E-21 0.07 rs950025610 Eosinophilic esophagitis (pediatric) 7: 1166536–1171429 161007 3.40E-14 0.07 rs10256972 Longevity 7: 7261310–7283935 26354 4.86E-9 0.07 rs10259085 Multiple sclerosis (severity) 7: 7261310–7283935 0 H3K4m15
3.41E-7 0.06 rs1299548 Amount of visceral
adipose tissue adjusted for body mass index (BMI) 8: 23138679–23144384 0 H3K4m15 H3K27ac5 9.45E-89 0.27 rs13278062 Age-related macular degeneration 9: 122645199–122654702 25619 H3K4m1 H3K27ac5
4.09E-16 0.13 rs1953126 Celiac disease and
Rheumatoid arthritis
9: 122645199–122654702 38017 1.02E-16 0.13 rs881375 Rheumatoid
arthritis
9: 122645199–122654702 75358 H3K4m15
H3K27ac5 4.13E-17 0.13 rs3761847 Rheumatoid
arthritis
9: 135120874–135140438 0 3.39E-50 0.43 rs687621 D-dimer
levels
9: 135120874–135140438 0 2.69E-66 0.43 rs657152 Liver enzyme
levels 9: 135120874–135140438 0 2.69E-66 0.43 rs643434 Inflammatory biomarkers 9: 135120874–135140438 0 5.66E-52 0.44 rs612169 Metabolic traits 9: 135120874–135140438 0 1.00E-50 0.44 rs505922 Protein quantitative trait loci
A drawback of our study is that this specific dataset was not replicated by an independent method. However, in a previous study we have shown that a similar method for genome-wide ASE-analysis using NS-12 BeadChips (Illumina) was highly reproduc-ible between replicate samples, with correlation coefficients of 0.9969 for gDNA and 0.9956 for cDNA. ASE-levels determined using NS-12 BeadChips and those determined by quantitative Sanger sequencing were also strongly correlated (0.86) in nine
representative genes [3]. Furthermore, in the current study the consistency of the ASE-signal for individual SNPs across the lncRNA regions is high, with an average standard deviation of 0.05 over all regions and samples. The consistency of the ASE-signals can be observed in Figure S4, where almost all SNPs in the lncRNA regions show overexpression of the same allele.
In our study we found that 32 of the cis-rSNPs that regulate the expression of lncRNAs have been identified in GWAS as risk Table 2. Cont. ASE GWAS Genomic region of lncRNA Distance to GWAS SNP (bp)1 In or close to histone mark ASE p-value Slope2 SNP3 Trait4 9: 135120874–135140438 0 3.80E-22 0.43 rs507666 Soluble ICAM-1
9: 135120874–135140438 3551 8.83E-26 0.43 rs579459 Soluble E-selectin
levels 9: 135120874–135140438 4250 7.93E-25 0.43 rs495828 Angiotensin-converting enzyme activity 15: 43458687–43481812 30170 1.24E-21 0.14 rs245353311 Chronic kidney disease 15: 82975686–82986699 245274 4.86E-13 0.05 rs374316212 Alzheimer’s disease (age of onset) 17: 26060783–26121168 150673 H3K4m1 1.28E-8 0.06 rs3760318 Height 1
The distance to the lncRNA region is 0 if the SNP is located within the region and the smallest distance otherwise, 2
Slope is given in absolute numbers, 3
Listed are all cis-rSNPs that are also found in the GWAS catalog together with the associated lncRNA, 4
The trait is taken from the GWAS catalog, 5 Within 2.5 kb, 6 rs6663565 as proxy, 7 rs2303393 as proxy, 8 rs6922111 as proxy, 9 rs7739434 as proxy, 10 rs13214831 as proxy, 11 rs1153862 as proxy, 12 rs12442557 as proxy. doi:10.1371/journal.pone.0102612.t002
Figure 3. Illustration of a region with a SNP from genome wide association studies (GWAS) which is associated with ASE of lncRNAs. The tracks are from top to bottom in each panel: Horizontal red bars represent lncRNA transcript windows (with genomic coordinates) used for determination of ASE levels; grey lines show p-values for the association of GWAS SNPs with ASE levels in the transcript window; a grey line overlayed with a red dotted line indicates that a cis-rSNP overlaps with the reported SNP in the GWAS catalog; red vertical lines are median ASE-levels for each SNP.
variants for human diseases or traits. The diseases or phenotypic traits associated with these cis-regulatory SNPs according to the lncRNA ASE analysis, include diseases of the immune system; multiple sclerosis, Graves’ disease, eosinophilic esophagitis, celiac disease, rheumatoid arthritis, immune response to small pox vaccine, soluble E-selectin levels, soluble ICAM-1, and ankylosing spondylitis, for which monocytes are a relevant cell type (Table 1). Chronic kidney disease is also a relevant trait as it can be caused both by the autoimmune disease type 1 diabetes and by hypertension, which are diseases for which monocytes are a relevant cell type [25]. By manually classifying the traits in the GWAS catalog into two classes, ie traits related to the immune system, and other traits, we tested for over-representation of cis-rSNPs in the GWAS-catalog using Fisher’s exact test. For traits associated to the immune system, the p-value for overrepresenta-tion is 0.00027. The SNP rs13278062 that confers risk of age-related macular degeneration detected in our study of monocytes using ASE analysis (Table 1) was also highlighted by traditional eQTL analysis of peripheral blood samples [19], while none of the other detected risk SNPs or traits overlapped between the two studies.
We also found that the identified cis-rSNPs for lncRNA are enriched to active enhancer regions in monocytes, which suggests a mechanism for their cis-regulatory functions. The reported 32 risk SNPs from GWAS that are strongly associated with the expression of non-coding RNAs provides interesting leads for further characterization and functional clues into immune diseases. Some of the GWAS SNPs are located in enhancer regions, which could be the cause of the allele specific expression of the lncRNA. Thus our study suggests more complex functional mechanisms underlying findings from GWAS than regulatory variants or expression levels of nearby protein coding genes, and provides novel insights into the relationship between genetic variation and human diseases.
Supporting Information
Figure S1 Schematic picture of the principles ASE analysis. In ASE the allele-specific expression level is measured by the difference in fluorophore signal intensity between the two alleles in the same sample. The average ASE-level is calculated for all heterozygous SNPs in the region. This ASE-value is then used in an association test against the genotypes of cis-rSNPs (shown in yellow). Figure adapted from Almlo¨f et al [4].
(PDF)
Figure S2 Signal intensity threshold. The figure shows the distribution of signal intensities for the two alleles. The x-channel represents the A-allele and the y-channel represents the B-allele. In the xraw panel the fraction of SNPs with the BB genotype having intensity levels above the cutoff level of 1000 is very low and similarly for the yraw panel.
(PDF)
Figure S3 Regression lines. Regression lines for the 32 risk SNPs from GWAS that are significantly associated with a lncRNA region.
(PDF)
Figure S4 lncRNA in the GWAS catalog. Illustration of all lncRNA regions that have a significant association to a SNP that is also significantly associated in the GWAS catalog. The tracks are from top to bottom in each panel: Horizontal red bars represent transcript windows (with genomic coordinates) used for determi-nation of ASE levels; grey lines show p-values for the association of GWAS SNPs with ASE levels in the transcript window; a grey line
overlayed with a red dotted line indicates that this is the SNP that overlaps with the reported SNP in the GWAS catalog; red vertical lines are median ASE-levels for each SNP; annotated transcripts are shown in black below the tracks.
(PDF)
Table S1 Significantly associated lncRNA regions. (DOCX)
Table S2 SNPs associated with allele-specific expres-sion of Refseq protein coding genes with published trait-or disease-associations from genome-wide association studies.
(DOCX)
Methods S1 Quadratic normalization. Detailed explana-tion of the quadratic normalizaexplana-tion performed on the intensity levels obtained from the genotyping.
(DOCX)
Acknowledgments
We thank all the volunteers from the Cambridge BioResource who donated blood for this study (http://www.cambridgebioresource.org.uk/). SNP-genotyping using the Human 1.2 M Duo custom BeadChips v1 was performed by the SNP&SEQ Technology Platform in Uppsala, Sweden (www.genotyping.se). We thank the UPPmax NExt-generation sequencing Cluster & Storage (SNIC-UPPNEX, Uppsala, Sweden, www.uppmax.uu. se) for data storage and CPU-time for analysis. Members of the Cardiogenics Consortium: Lead author for the Cardiogenics Consor-tium: Heribert Schunkert, [email protected].
Tony Attwood1, Stephanie Belz2, Peter Braund3, Jessy Brocheton4,
Jason Cooper5, Abi Crisp-Hihn1, Patrick Diemert (formerly
Linsel-Nitschke)2, Jeanette Erdmann2, Nicola Foad1, Tiphaine Godefroy4, Jay
Gracey3, Emma Gray6, Rhian Gwilliams6, Susanne Heimerl7, Christian
Hengstenberg7, Jennifer Jolley1, Unni Krishnan3, Heather Lloyd-Jones1, Ulrika Liljedahl8, Ingrid Lugauer7, Seraya Maouche2,4, Jasbir S Moore3, Gilles Montalescot4, David Muir1, Elizabeth Murray1, Chris P Nelson3, Jessica Neudert9, David Niblett6, Karen O’Leary1, Helen Pollard3, Carole Proust4, Angela Rankin1, Augusto Rendon10, Catherine M Rice6, Hendrik Sager2, Nilesh J Samani3,11, Jennifer Sambrook1, Heribert Schunkert2,
Gerd Schmitz12, Michael Scholz9, Laura Schroeder2, Jonathan Stephens1,
Stefanie Tennstedt (formerly Gulde)2, Chris Wallace5.
1
Department of Haematology, University of Cambridge, Long Road, Cambridge, CB2 2PT, UK and National Health Service Blood and Transplant, Cambridge Centre, Long Road, Cambridge, CB2 2PT, UK;
2Medizinische Klinik II, Universita¨t zu Lu¨beck, Lu¨beck Germany; 3Department of Cardiovascular Sciences, University of Leicester, Glenfield
Hospital, Groby Road, Leicester, LE3 9QP, UK;4INSERM UMRS 937, Pierre and Marie Curie University (UPMC, Paris 6) and Medical School, 91 Bd de l’Hoˆpital 75013, Paris, France; 5Juvenile Diabetes Research Foundation/Wellcome Trust Diabetes and Inflammation Laboratory, Department of Medical Genetics, Cambridge Institute for Medical Research, University of Cambridge, Wellcome Trust/MRC Building, Cambridge, CB2 0XY, UK; 6The Wellcome Trust Sanger Institute,
Wellcome Trust Genome Campus, Hinxton, Cambridge CB10 1SA, UK;
7Klinik und Poliklinik fu¨r Innere Medizin II, Universita¨t Regensburg,
Germany; 8Molecular Medicine, Department of Medical Sciences, Uppsala University, Uppsala, Sweden;9Trium, Analysis Online GmbH, Hohenlindenerstr. 1, 81677, Mu¨nchen, Germany;10European Bioinfor-matics Institute, Wellcome Trust Genome Campus, Hinxton, Cambridge, CB10 1SD, UK; 11Leicester NIHR Biomedical Research Unit in Cardiovascular Disease, Glenfield Hospital, Leicester, LE3 9QP, UK;
12Institut fu¨r KlinischeChemie und Laboratoriums medizin, Universita¨t,
Regensburg, D-93053 Regensburg, Germany.
Data availability. Genotypes and raw intensity data can be accessed at the European Genome-phenome Archive (EGA, http://www.ebi.ac.uk/ ega/) which is hosted at the EBI, under accession number EGAS00000000119 as part of a previous study by our group [4].
Author Contributions
Conceived and designed the experiments: JCA PL TP PD AHG WHO FC ACS. Performed the experiments: AL. Analyzed the data: JCA PL AL BG
FC. Contributed reagents/materials/analysis tools: PD. Wrote the paper: JCA PL FC ACS.
References
1. Pastinen T, Hudson TJ (2004) Cis-acting regulatory variation in the human genome. Science 306: 647–650.
2. Ge B, Pokholok DK, Kwan T, Grundberg E, Morcos L, et al. (2009) Global patterns of cis variation in human cells revealed by high-density allelic expression analysis. Nat Genet 41: 1216–1222.
3. Milani L, Lundmark A, Nordlund J, Kiialainen A, Flaegstad T, et al. (2009) Allele-specific gene expression patterns in primary leukemic cells reveal regulation of gene expression by CpG site methylation. Genome Res 19: 1–11. 4. Almlof JC, Lundmark P, Lundmark A, Ge B, Maouche S, et al. (2012) Powerful identification of cis-regulatory SNPs in human primary monocytes using allele-specific gene expression. PLoS One 7: e52260.
5. Deloukas P, Kanoni S, Willenborg C, Farrall M, Assimes TL, et al. (2013) Large-scale association analysis identifies new risk loci for coronary artery disease. Nat Genet 45: 25–33.
6. Verlaan DJ, Ge B, Grundberg E, Hoberman R, Lam KC, et al. (2009) Targeted screening of cis-regulatory variation in human haplotypes. Genome Res 19: 118–127.
7. Lerner-Ellis JP, Anastasio N, Liu J, Coelho D, Suormala T, et al. (2009) Spectrum of mutations in MMACHC, allelic expression, and evidence for genotype-phenotype correlations. Hum Mutat 30: 1072–1081.
8. Murphy A, Chu JH, Xu M, Carey VJ, Lazarus R, et al. (2010) Mapping of numerous disease-associated expression polymorphisms in primary peripheral blood CD4+ lymphocytes. Hum Mol Genet 19: 4745–4757.
9. Brown CJ, Ballabio A, Rupert JL, Lafreniere RG, Grompe M, et al. (1991) A gene from the region of the human X inactivation centre is expressed exclusively from the inactive X chromosome. Nature 349: 38–44.
10. Lee JT, Davidow LS, Warshawsky D (1999) Tsix, a gene antisense to Xist at the X-inactivation centre. Nat Genet 21: 400–404.
11. Rinn JL, Kertesz M, Wang JK, Squazzo SL, Xu X, et al. (2007) Functional demarcation of active and silent chromatin domains in human HOX loci by noncoding RNAs. Cell 129: 1311–1323.
12. Wang KC, Chang HY (2011) Molecular mechanisms of long noncoding RNAs. Mol Cell 43: 904–914.
13. Guttman M, Amit I, Garber M, French C, Lin MF, et al. (2009) Chromatin signature reveals over a thousand highly conserved large non-coding RNAs in mammals. Nature 458: 223–227.
14. Khalil AM, Guttman M, Huarte M, Garber M, Raj A, et al. (2009) Many human large intergenic noncoding RNAs associate with chromatin-modifying complexes and affect gene expression. Proc Natl Acad Sci U S A 106: 11667– 11672.
15. Kim TK, Hemberg M, Gray JM, Costa AM, Bear DM, et al. (2010) Widespread transcription at neuronal activity-regulated enhancers. Nature 465: 182–187. 16. Orom UA, Derrien T, Beringer M, Gumireddy K, Gardini A, et al. (2010) Long
noncoding RNAs with enhancer-like function in human cells. Cell 143: 46–58. 17. Dunham I, Kundaje A, Aldred SF, Collins PJ, Davis CA, et al. (2012) An integrated encyclopedia of DNA elements in the human genome. Nature 489: 57–74.
18. Derrien T, Johnson R, Bussotti G, Tanzer A, Djebali S, et al. (2012) The GENCODE v7 catalog of human long noncoding RNAs: analysis of their gene structure, evolution, and expression. Genome Res 22: 1775–1789.
19. Kumar V, Westra HJ, Karjalainen J, Zhernakova DV, Esko T, et al. (2013) Human disease-associated genetic variation impacts large intergenic non-coding RNA expression. PLoS Genet 9: e1003201.
20. Garnier S, Truong V, Brocheton J, Zeller T, Rovital M, et al. (2013) Genome-wide haplotype analysis of cis expression quantitative trait loci in monocytes. PLoS Genet 9: e1003240.
21. Howie BN, Donnelly P, Marchini J (2009) A flexible and accurate genotype imputation method for the next generation of genome-wide association studies. PLoS Genet 5: e1000529.
22. Frazer KA, Ballinger DG, Cox DR, Hinds DA, Stuve LL, et al. (2007) A second generation human haplotype map of over 3.1 million SNPs. Nature 449: 851– 861.
23. Abecasis GR, Altshuler D, Auton A, Brooks LD, Durbin RM, et al. (2011) A map of human genome variation from population-scale sequencing. Nature 467: 1061–1073.
24. Li X, Yu Z, Jin B (2002) [Treatment of the paranasal sinuses mycosis with endoscopic sinus surgery]. Lin Chuang Er Bi Yan Hou Ke Za Zhi 16: 412–413. 25. Abbott A (2011) Europe to map the human epigenome. Nature 477: 518. 26. Creyghton MP, Cheng AW, Welstead GG, Kooistra T, Carey BW, et al. (2010)
Histone H3K27ac separates active from poised enhancers and predicts developmental state. Proc Natl Acad Sci U S A 107: 21931–21936. 27. Rada-Iglesias A, Bajpai R, Swigut T, Brugmann SA, Flynn RA, et al. (2011) A
unique chromatin signature uncovers early developmental enhancers in humans. Nature 470: 279–283.
28. Heintzman ND, Ren B (2009) Finding distal regulatory elements in the human genome. Curr Opin Genet Dev 19: 541–549.
29. Heintzman ND, Stuart RK, Hon G, Fu Y, Ching CW, et al. (2007) Distinct and predictive chromatin signatures of transcriptional promoters and enhancers in the human genome. Nat Genet 39: 311–318.
30. Hindorff LA, Sethupathy P, Junkins HA, Ramos EM, Mehta JP, et al. (2009) Potential etiologic and functional implications of genome-wide association loci for human diseases and traits. Proc Natl Acad Sci U S A 106: 9362–9367. 31. Stevenson KR, Coolon JD, Wittkopp PJ (2013) Sources of bias in measures of
allele-specific expression derived from RNA-seq data aligned to a single reference genome. BMC Genomics 14: 536.
32. Degner JF, Marioni JC, Pai AA, Pickrell JK, Nkadori E, et al. (2009) Effect of read-mapping biases on detecting allele-specific expression from RNA-sequencing data. Bioinformatics 25: 3207–3212.
33. Satya RV, Zavaljevski N, Reifman J (2012) A new strategy to reduce allelic bias in RNA-Seq readmapping. Nucleic Acids Res 40: e127.
34. Lappalainen T, Sammeth M, Friedlander MR, t Hoen PA, Monlong J, et al. (2013) Transcriptome and genome sequencing uncovers functional variation in humans. Nature 501: 506–511.
35. Rotival M, Zeller T, Wild PS, Maouche S, Szymczak S, et al. (2011) Integrating genome-wide genetic variations and monocyte expression data reveals trans-regulated gene modules in humans. PLoS Genet 7: e1002367.