The MIT Faculty has made this article openly available.
Please share
how this access benefits you. Your story matters.
Citation
Azoulay, Pierre et al. "Age and High-Growth Entrepreneurship."
American Economic Review: Insights 2, 1 (March 2020): 65-82
As Published
http://dx.doi.org/10.1257/aeri.20180582
Publisher
American Economic Association
Version
Final published version
Citable link
https://hdl.handle.net/1721.1/129944
Terms of Use
Article is made available in accordance with the publisher's
policy and may be subject to US copyright law. Please refer to the
publisher's site for terms of use.
65
* Azoulay: Massachusetts Institute of Technology and NBER (email: [email protected]); Jones: Northwestern University and NBER (email: [email protected]); Kim: The Wharton School, University of Pennsylvania (email: [email protected]); Miranda: US Census Bureau (email: javier.miranda@census. gov). Pete Klenow was the coeditor for this article. We thank Shawn Klimek, Mark Leach, David Robinson, Scott Stern, and two anonymous referees for helpful comments. We thank PCRI and Josh Lerner for access to the matched Business Register-PCRI crosswalk. Any opinions and conclusions expressed herein are those of the author(s) and do not necessarily represent the views of the US Census Bureau or its staff. All results have been reviewed to ensure that no confidential information is disclosed.
† Go to https://doi.org/10.1257/aeri.20180582 to visit the article page for additional materials and author disclosure statement(s).
Age and High-Growth Entrepreneurship
†By Pierre Azoulay, Benjamin F. Jones, J. Daniel Kim, and Javier Miranda*
Many observers, and many investors, believe that young people are
especially likely to produce the most successful new firms. Integrating administrative data on firms, workers, and owners, we study start-ups
systematically in the United States and find that successful entrepre-neurs are middle-aged, not young. The mean age at founding for the
1-in-1,000 fastest growing new ventures is 45.0. The findings are
sim-ilar when considering high-technology sectors, entrepreneurial hubs,
and successful firm exits. Prior experience in the specific industry pre-dicts much greater rates of entrepreneurial success. These findings strongly reject common hypotheses that emphasize youth as a key trait of successful entrepreneurs. (JEL G24, J14, L26, M13, O31)
Young people are just smarter.
—Mark Zuckerberg, founder of Facebook1
The cutoff in investors’ heads is 32 … after 32, they start to be a little
skeptical.
—Paul Graham, venture capitalist and founder of Y Combinator2
Entrepreneurship has long been heralded as a key driver of rising living standards (Smith 1776, Schumpeter 1942, Lucas 1978), but successful entrepreneurship is rare, with the vast majority of entrepreneurs failing to provide the major innovations or creative destruction that can drive economic growth (Glaeser 2009; Haltiwanger, Jarmin, and Miranda 2013; Guzman and Stern 2017; Levine and Rubinstein 2017). In understanding entrepreneurship, and the rarity of substantial success, a key set of questions surrounds the traits of the entrepreneurs themselves. In this paper, we provide wide-ranging evidence about one trait often thought to play a central role: the founder’s age.
1 Mark Coker, “Startup Advice for Entrepreneurs from Y Combinator,” VentureBeat, March 26, 2007. 2 Nathaniel Rich, “Silicon Valley’s Start-up Machine,” New York Times, May 2, 2013.
The view that young people are especially capable of producing big ideas— whether in scientific research, invention, or entrepreneurship—is common and longstanding (see, e.g., Jones, Reedy, and Weinberg 2014). Among the advantages of youth in technology and innovation, young people are sometimes argued to be cognitively sharper, less distracted by family or other responsibilities, and more capable of transformative ideas—this is in line with “Planck’s Principle,” whereby younger people may be less beholden to existing paradigms of thought and practice (Planck 1949; Dietrich and Srinivasan 2007; Weinberg 2006; Jones 2010; Azoulay, Fons-Rosen, and Graff Zivin 2019). Famous individual cases such as Bill Gates, Steve Jobs, and Mark Zuckerberg show that people in their early 20s can create eventually world-leading companies. Meanwhile, venture capital firms appear to emphasize youth as a key criteria in targeting their investments, which has led to charges of “ageism” in Silicon Valley.3 At one extreme, Peter Thiel, the cofounder of PayPal, has created a prominent fellowship program that provides $100,000 grants to would-be entrepreneurs so long as they are below age 23 and drop out of school.
Despite potential advantages, young entrepreneurs may also face substantial dis-advantages. Older entrepreneurs might access greater human capital, social capital, or financial capital. Theories of entrepreneurship often take human-capital orien-tations (e.g., Lucas 1978; Kihlstrom and Laffont 1979; Iyigun and Owen 1998; Lazear 2004, 2005; Amaral, Baptista, and Lima 2011), and empirical studies have found that human capital, including the acquisition of relevant market and tech-nical knowledge, can predict entrepreneurial success (e.g., Dunn and Holtz-Eakin 2000; Fairlie and Robb 2007; Gruber, MacMillan, and Thompson 2008; Chatterji 2009; Lafontaine and Shaw 2016). In deeper technological areas, young people may not have sufficient scientific knowledge to produce or manage effective R&D (e.g., Jones 2010). Age and experience may also be relevant when accessing financial capital, where younger individuals will have less time to build up the capital needed to start a business and may face difficulties borrowing it (e.g., Evans and Jovanovic 1989, Stiglitz and Weiss 1981).4 Whether such issues impose important constraints in the entrepreneurial context is less clear, especially to the extent that young entre-preneurs can overcome personal limitations by assembling effective teams, access-ing third-party financaccess-ing, and tappaccess-ing social networks.
The empirical literature on the characteristics of highly successful entrepreneurs is limited and mixed. Various studies suggest that mean age for starting companies of all kinds (i.e., including restaurants, dry cleaners, retail shops, etc.) is in the late 30s or 40s (e.g., Dahl and Sorensen 2012; Kautonen, Down, and Minniti 2014), but the data in these studies are dominated by small businesses without growth ambitions and do not focus on the relatively rare start-ups with the potential to drive innovation and economic growth. Other research suggests that growth-oriented firms and the people who start them have distinct characteristics (e.g., Guzman and Stern 2017, Levine
3 Vinod Khosla, the cofounder of Sun Microsystems and a prominent venture capitalist, has argued that “people under 35 are the people who make change happen,” and “people over 45 basically die in terms of new ideas” (Vivek Wadhwa, “The Case for Old Entrepreneurs,” Washington Post, December 2, 2011). For public debate around ven-ture capital activity and potential “ageism” see, for example, Noam Scheiber, “The Brutal Ageism of Tech: Years of Experience, Plenty of Talent, Completely Obsolete,” New Republic, March 23, 2014.
4 In Evans and Jovanovic (1989) the entrepreneur’s wealth limits the amounts of funds she can access. Empirical evidence for this mechanism continues to be debated (e.g., Holtz-Eakin, Joulfaian, and Rosen 1994a, 1994b; Hurst and Lusardi 2004; Andersen and Nielsen 2012; Fort et al. 2013; Adelino, Schoar, and Severino 2015).
and Rubinstein 2017). Meanwhile, studies of technology firms in the United States find contrasting results. Roberts (1991), looking across small samples of tech entre-preneurs, finds a median founder age of 37 among 270 new ventures, while Wadhwa, Freeman, and Rissing (2008) use a telephone survey of 502 technology and engineer-ing firms with at least $1 million in sales and find that the mean founder age was 39.
Ng and Stuart (2016) connect Angel List and CrunchBase data to individual LinkedIn profiles and find, in sharp contrast, that the founding of tech ventures comes most commonly only five years after college graduation. Frick (2014) studies a sample of 35 VC-backed firms from the Wall Street Journal’s Billion Dollar Startup Club list and finds a mean founder age of 31, echoing the popular view that the most successful and transformative new ventures come from young people (online Appendix Table A1 further characterizes popular perceptions).
In this paper, we deploy US administrative datasets to investigate the link between age and high-growth entrepreneurship in a systematic manner. By linking (i) newly available IRS K-1 data, which identifies the initial owners of pass-through firms, with (ii) US Census Bureau datasets regarding businesses, employees, and individu-als throughout the economy as well as (iii) USPTO patent databases and third-party venture-capital databases, we provide systematic new facts about founder age and entrepreneurship.
While we include results for all new firms, our emphasis is on founders of “growth-oriented” firms that can have large economic impacts and are often associ-ated with driving an increasing standard of living (Schumpeter 1942, Glaeser 2009). To delineate growth-oriented start-ups, we use both ex ante and ex post measures. The ex ante measures include being a participant in a high-tech sector, owning a patent, or receiving VC backing. The ex post measures examine growth outcomes directly for each firm. Our datasets allow us to investigate multiple measures of firm growth and success at the firm level, including exceptionally high employment and sales growth, as well as exit by acquisition or initial public offering.
Our primary finding is that successful entrepreneurs are middle-aged, not young. We find no evidence to suggest that founders in their 20s are especially likely to succeed. Rather, all evidence points to founders being especially successful when starting businesses in middle age or beyond, while young founders appear disad-vantaged. Across the 2.7 million founders in the United States between 2007–2014 who started companies that go on to hire at least one employee, the mean age for the entrepreneurs at founding is 41.9. The mean founder age for the 1 in 1,000 highest growth new ventures is 45.0. The most successful entrepreneurs in high-technology sectors are of similar ages. So too are the most successful founders in entrepreneur-ial regions of the United States. While the prevalence of the highest-growth com-panies having middle-aged founders is due in part to the prevalence of entry by the middle-aged, we further find that the “batting average” for creating successful firms is rising dramatically with age. Conditional on starting a firm, a 50-year-old founder is 1.8 times more likely to achieve upper-tail growth than a 30-year-old founder. Founders in their early 20s have the lowest likelihood of successful exit or creating a 1 in 1,000 top growth firm.
The rest of the paper is organized as follows. Section I details the newly-inte-grated administrative datasets that make this study possible. Section II presents our main results. Section III presents extensions and discussion. Section IV concludes.
I. Data and Measurement
Our study uses administrative data to identify the demographics of business founders in the United States and to track the performance of their businesses over time. Our primary datasets include administrative data from the US Census Bureau’s Longitudinal Business Database (LBD) and Schedule K-1 business owners data, while also integrating numerous other datasets. Detailed information about each dataset is provided in the online Appendix, with a summary displayed in online Appendix Table A2. Below we describe how key measurement challenges can be overcome with the above databases, which enable us to analyze the demographics of business founders and track the performance of their firms over time.
Identifying New Firms.—We rely on the LBD to identify start-up firms. The LBD tracks both firms and their establishments over time. We follow Haltiwanger, Jarmin, and Miranda (2013) and define a business’s age as the age of the oldest establish-ment present at the first appearance of a new firm identifier. Start-ups are identified as de novo firms with no prior activity at any of its establishments. This approach ensures our definition of entrepreneurial firms does not include spin-offs from exist-ing firms or new firms that are the result of the reorganization or recombination of existing businesses.5 Note that the LBD identifies the start-up year as the year when the business first hires an employee; as such the LBD start-up date might differ from the legal founding date of a business. As a robustness check, we exclude businesses where the K-1 form founding date differs from the LBD age by more than two years. All results are consistent with the main findings from the full sample.
Identifying Founders.—Critical to our effort is the identification of founders. For S corporations and partnerships, we use Form K-1 to define owners as individuals who own some portion of the firm at age zero in the LBD. We then use the W-2 data to define a founder as an owner who also works at the firm (as opposed to an investor who holds equity in the firm but does not work there). The identification of these “owner-workers” is, while traditionally very difficult in the US data, straightforward in the linked administrative datasets we use.6
For C corporations, we rely on two alternative approaches, as K-1 owner data are not available. For our primary analysis, we use the W-2 data to define the three highest paid workers in the first year of the firm’s existence. This is the approach followed by Kerr and Kerr (2017), who argue that business owners are often among the top three initial earners in the firm.7 Based on the S corporation data, where
5 We also drop age zero firms that have multiple establishments in their birth years. On average, their initial employment in year zero is unusually high relative to other new firms, suggesting that they are not de novo start-ups. Inspection of these start-ups suggest they are the result of multinational activity as well as newly created profes-sional employer organizations.
6 For about 20 percent of new S corporations, none of the owners work at the firm, which we interpret as busi-nesses where the equity holders are financing a new business and running it through hired management. These firms are not included in our analysis below; we will be considering these firms more closely in further work.
7 Kerr and Kerr (2017) use Longitudinal Employer-Household Dynamics (LEHD) data which currently exclude Massachusetts whereas we use more comprehensive W-2 earnings records. We have separately considered our anal-ysis using LEHD records, including different definitions of founding team based on quarterly employment data, and find very similar results as in our W-2 sample.
ownership status can be determined with certainty, 90 percent of the owner-workers are in fact among the top three earners in the firm during the first year.8 This “initial team” definition of founders can be applied to all firms. Secondarily, we will pres-ent results using the US Census Annual Survey of Entrepreneurs (ASE), allowing us to look at a large subsample of C corps for whom we can directly determine owner-workers.9 In general, we have analyzed all of our results separately for S cor-porations (K-1 entities), partnerships (K-1 entities), and C corporations (non-K-1 entities). Because the results are similar for each type, the main results emphasize the age findings pooled across all US start-ups. In Section III, we will demonstrate robustness across different ways of defining founders and different legal forms.
Identifying High-Growth Start-Ups.—We are especially interested in examining growth-oriented start-ups. We take two approaches. The first approach considers technology-orientation, which can suggest the potential for high growth. The second approach considers the actual outcome for the firm, based on the 3-, 5-, or 7-year time window after founding. We exclude from our analysis sole proprietors and businesses without employees.
Noting that there is no commonly accepted definition of “high-tech” sectors or firms, we use three alternative definitions. First, following Hecker (2005), we define high-tech sectors as industries (4-digit NAICS) with the highest share of technolo-gy-oriented workers according to the Bureau of Labor Statistics.10 Second, we use a comprehensive match between the Census LBD and the businesses covered by the PCRI and VentureXpert databases to determine whether a given firm receives ven-ture capital, suggesting that the firm is seen as having substantial growth potential. Third, we leverage prior research that matches the USPTO patent database with the LBD (Graham et al. 2018) to determine whether a firm has received a patent.
While the above measures attempt to delineate firms with substantial potential for growth, the LBD also allows us to quantify growth outcomes for each firm directly. Our primary outcome measures include (i) employment growth, and (ii) sales growth, while we also consider (iii) exit by acquisition and (iv) initial public offerings. In the main text, we will emphasize employment growth, denoting a high-growth new venture as one that achieved a given threshold of employment 5 years after found-ing. We examine employment thresholds based on the top 10, 5, 1, or 0.1 percen-tile. Analyses using sales growth are provided in the online Appendix and show extremely similar results. Start-ups can grow and expand to become large multi-es-tablishment corporations spanning multiple types of activities and locations. For these start-ups we calculate total firm employment by aggregating the establish-ment level records for each firm-year observation. From these firm-level measures
8 This approach is thus good at capturing owner-workers in the sense that few are missed. However, examining the S corporation data, the top three earners also typically include individuals who do not have ownership stakes in the firm. Thus this “initial team” definition of founders is best thought of as a related but distinct way of capturing the important individuals in the initial life of the firm, as opposed to an exact way of capturing owner-workers. We will consider distinctions between these approaches below.
9 The ASE is a representative survey of US businesses with paid employees and receipts of $1,000 or more. 10 The list of Hecker (2005) includes 46 four-digit NAICS industries. An industry is considered high tech if the share of technology-oriented workers is at least twice the overall average of 4.9 percent. Defined by the Bureau of Labor Statistics, technology-oriented occupations are generally roles that require knowledge of science, engineer-ing, mathematics, and/or technology typically acquired through specialized higher education.
it is straightforward to compute measures of employment growth by looking at the change in total employment over time.
Start-ups can also become targets for acquisition by existing firms. For example, the owner(s) of a successful venture might decide to exit by selling their idea and the assets embodied in their firm. In this case the original firm will cease to exist as such after the acquisition.11 Some start-ups will simply fail and shutdown. We separately identify acquisitions of start-ups by existing firms as well as shutdowns and classify these events as distinct types of firm outcomes.12 Lastly, we use the Compustat-Business Register Bridge to identify firms that enter public equity markets through an IPO. Our measure of “successful exit” below is an indicator for acquisition or IPO ever occurring within the scope of our databases.
II. Results
We now turn to the analysis of founder age in the universe of US start-ups delin-eated above. Table 1 presents the results. Focusing on the first row and first column, which shows all new ventures in the United States, we see that the mean age at founding is 41.9. This finding is broadly consistent with other population surveys of general types of new firms. Of course, while the word “start-up” may conjure the image of technology entrepreneurs in their proverbial Silicon Valley garage, the great bulk of the new ventures that constitute our universe do not match this arche-type. Though our data do not include sole proprietor businesses, it is still the case that most US firms do not have the ambition and/or the business model to grow and scale their business (Hurst and Pugsley 2011).13
To focus on growth-oriented entrepreneurs within our universe of US start-ups, we take several approaches. Our first set of approaches examines the nature of the start-up at founding, based on technology-related criteria. Our second set of approaches examines the growth performance of the start-ups themselves. Given the scale of the administrative data, we can further look at intersections of these criteria to focus on narrow subgroups of firms that both grow quickly and are in high-technology areas.
A. Ex Ante Growth-Orientation
The results for different measures of growth-orientation are found in columns 2–4 of Table 1. We see that focusing on “high-tech” does not substantively affect mean founder age compared to the overall US sample. Depending on the definition of high-technology, mean founder age now ranges from 41.9 to 44.6, with found-ers in high-tech sectors (43.2) and founders of patenting firms (44.6) appearing somewhat older on average than founders in the United States overall.
We can further partition the data geographically and consider California, Massachusetts, and New York separately given that these three states account
11 In the LBD these firms’ establishments will take on the acquiring firms’ identifiers.
12 To distinguish successful acquisitions (i.e., those that generate positive returns for investors) from fire sale acquisitions, we drop observations for which total employment after the acquisition is lower than initial employment.
13While excluded from the analysis, our data show that the average age of new sole proprietors in 2010 was 44.8, significantly older than the rest of the population.
for significant portions of high-growth start-up activity in the United States (see Chen et al. 2010 with respect to VC-backed start-ups). In addition, we can exam-ine regions with the most entrepreneurial activity at the zip code level. Using the Entrepreneurial Quality Index developed by Guzman and Stern (2017), we define entrepreneurial hubs as the 50 zip codes with the highest entrepreneurial quality. We also look specifically at Silicon Valley, considering all new ventures in the zip codes of Santa Clara and San Mateo counties.
Taking the overall population of new ventures (column 1), we see little variation with geography. Even when looking at the zip codes with the most growth-oriented new ventures, the mean founder age is 40.8, or approximately 1 year younger than the US population average. One interpretation of this result may be that, even in entrepreneurial regions, most new firms are not in technology or growth-oriented sectors. However, reading across columns and rows in the table, we can further examine the intersection of geography with technology or growth-orientation. Remarkably, we see only modest differences in age. Mean founder ages rarely dip much below age 40, let alone ages 35, 30, or 25. The only category where the mean ages appear (modestly) below age 40 is when the firm has VC-backing. The young-est category is VC-backed firms in New York, where the mean founder age was 38.7. More generally, across the various narrow cuts in Table 2, the mean age ranges from 38.7 to 45.3. Put another way, even when reducing the set of 2.7 million founders
Table 1—Founder Age: Averages across United States and by Technology Definition All
start-ups High-tech employment VC-backed firms Patenting firms
United States (entire) 41.9 43.2 41.9 44.6
(12) (11.5) (10.6) (11.3) 2,658,000 334,000 11,000 10,000 California 41.7 42.1 39.6 43.9 (12) (11.3) (10) (11) 374,000 61,700 4,000 3,000 Massachusetts 41.7 43.2 42.3 45.3 (11.8) (11.2) (9.8) (10.6) 52,000 8,100 900 400 New York 41.4 41.8 38.7 42.7 (11.6) (11.6) (10.1) (11.4) 276,000 22,600 800 600 Silicon Valley 41.6 41.5 40.2 44.3 (11.4) (10.3) (9.7) (9.8) 32,000 11,700 1,700 900 Entrepreneurial hubs 40.8 40.5 39.5 43.8 (11.3) (10.6) (9.8) (10.2) 23,000 9,300 1,900 700
Notes: Mean founder age is shown in the first row, standard deviation in parentheses, and observation count in the third row. Data incorporate all C corporations, S corporations, and partnerships founded over 2007–2014. Based on the LBD, only new firms from each year are included. High-tech sectors in column 2 are defined at the 4-digit NAICS level (see text). Column 3 represents firms that ever receive venture capital. Column 4 represents firms that are ever granted a patent, which is derived from the Longitudinal Linked Patent-Business Database. Silicon Valley is defined as zip codes in Santa Clara and San Mateo counties. Entrepreneurial hubs are defined as zip codes with the highest entrepreneurial quality as defined by Guzman and Stern (2017). Counts are rounded to comply with disclosure rules.
to the 1,900 associated with firms that are both in entrepreneurial hubs and receive VC backing, the mean age at founding is 39.5. Meanwhile, founders in high-tech employment sectors tend to be slightly older than the US-wide average, and found-ers of patenting firms are the oldest of all, with an average age of 44.3 in Silicon Valley and 43.8 in the entrepreneurial hubs.
B. Ex Post High-Performance Firms
It may still be that younger founders produce the highest performance new firms. Our second approach considers firm-level outcomes. The capacity to examine firm performance draws on the strengths of the LBD, which provides employment and sales for each firm, as well as indicating exit by acquisition and, via the Compustat Bridge, initial public offerings. A potential limitation in the intersection of our data-bases is that we have a limited time-period in which we can examine firm perfor-mance. Here we will focus on growth outcomes five years after the hiring of the first employee.14
To delineate “successful” entrepreneurs within the population of new ventures, we focus on the upper tail of the new ventures’ employment growth. Specifically, we examine firms alternatively in the top 10 percent, top 5 percent, top 1 percent, and top 0.1 percent of growth. We complement these employment-based growth measures with a metric tracking whether these ventures ever exited by acquisition or IPO within our sample period.
Table 2 presents founder age across a range of upper-tail performance definitions. We see that more successful start-ups have, if anything, slightly older founders on
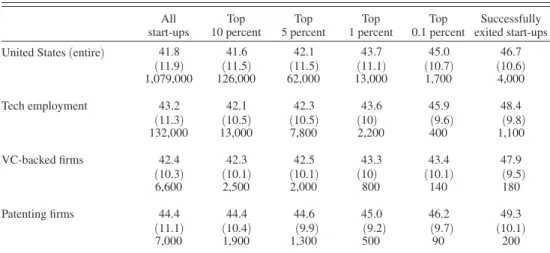
14 Using three-year windows and seven-year windows shows broadly similar results. Table 2—Founder Age and Success: Upper Tail Growth or Acquisition
All start-ups Top 10 percent Top 5 percent Top 1 percent Top 0.1 percent Successfully exited start-ups United States (entire) 41.8 41.6 42.1 43.7 45.0 46.7
(11.9) (11.5) (11.5) (11.1) (10.7) (10.6) 1,079,000 126,000 62,000 13,000 1,700 4,000 Tech employment 43.2 42.1 42.3 43.6 45.9 48.4 (11.3) (10.5) (10.5) (10) (9.6) (9.8) 132,000 13,000 7,800 2,200 400 1,100 VC-backed firms 42.4 42.3 42.5 43.3 43.4 47.9 (10.3) (10.1) (10.1) (10) (10.1) (9.5) 6,600 2,500 2,000 800 140 180 Patenting firms 44.4 44.4 44.6 45.0 46.2 49.3 (11.1) (10.4) (9.9) (9.2) (9.7) (10.1) 7,000 1,900 1,300 500 90 200
Notes: Mean founder age is shown in the first row, standard deviation in parentheses, and observation count in the third row. Data incorporate all C corporations, S corporations, and partnerships founded over 2007–2009 in the LBD, for which we can observe five years of performance data after founding. Only new firms from each year are included. Employment growth is measured using the five-year window. Tech Employment consists of NAICS-4 sec-tors with high shares of STEM-trained workers. Counts are rounded to comply with disclosure rules.
average. For example, the 1,700 founders of the fastest growing new ventures (the top 0.1 percent) in our universe of US firms had an average age at founding of 45.0 (compared to 43.7 for the top 1 percent and 42.1 for the top 5 percent). Regardless of the measure of technology-intensiveness chosen, we see older founders as we move toward upper-tail performance, especially for the top 1 in 100 or top 1 in 1,000 firms, as well as for founders with successful exits. This evidence is at odds with the conventional wisdom that successful founders skew younger.
C. Founder Age Distributions
One limitation of the foregoing results is that they only shed light on mean founder age. While mean age provides a standard summary statistic, and one that we can compare across technology-intensity, regions, and outcome measures, inves-tigating the entire age distribution may reveal bands of age where founder activity is especially intense or founders are especially successful.
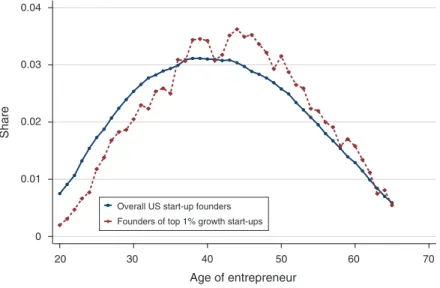
Figure 1 presents the full founder age distributions, for the founders of all US firms (blue line) and for top 1 percent firms by employee growth after five years (red line).15 Studying all founders, the age distribution is single peaked, with a relatively flat plateau at ages 37–43. Studying founders of high-growth firms, the founder age distribution shifts systematically to the right. Thus, the highest-growth new firms not only appear to come from those in middle-age, but also tend to come at even older ages than the background age distribution for founders would imply. Prior to the late 30s, the frequency of successful founders is well below the frequency of these founders in the population. Starting in the late 30s, and especially by the mid-to-late 40s, the frequency of successful founders is substantially greater than the frequency of these founders in the population. A similar peak in middle age appears when comparing the founder age distribution against the underlying workforce age distri-bution as opposed to the population as a whole (online Appendix Figure A1).
D. The Likelihood of Success
Our previous results have demonstrated that growth-oriented start-up founders in the US economy tend to be middle-aged, not young. Thus, when asking where most high-growth or technology-intensive firms in the United States come from, the answer is “middle-aged people.” However, an equally important question is to ask how the probability of entrepreneurial success changes with founder age, condi-tional on starting a new firm. This statistic may be more informative for an individ-ual considering founding a company or for investors deciding where to place their bets. For example, if two founders (of two distinct firms) come to pitch their idea to a venture capitalist, and all the venture capitalist knows is these founders’ ages, which founder would be more likely to produce an upper-tail growth outcome?
To examine the relationship between the likelihood of success and age, we run linear probability models where an indicator for “success” is regressed on a full set of founder age fixed effects (age 20 and below is the omitted category). We graph
15 Online Appendix Figure A4 presents analyses using upper tail sales growth instead of employment growth and shows similar results.
each age coefficient and the associated 95 percent confidence interval in Figure 2. Our success indicators are (i) exit by acquisition or IPO and (ii) employment in the top 0.1 percent measured here at 5 years from founding.
Figure 2, panel A, considers successful exits, which occurs for roughly 4,000 (or 0.15 percent) of the founders in our universe. We see that the relationship between age and successful exit is monotonically increasing up until about age 60 and declin-ing slightly thereafter. A founder at age 50 is approximately twice as likely to experi-ence a successful exit compared to a founder at age 30. Figure 2, panel B, replicates this analysis using top 0.1 percent employment growth as the success metric. Here again, success probabilities are increasing with age, though the individual age coef-ficients are estimated less precisely. Similar to the exit results, a founder at age 50 is approximately twice as likely to achieve upper-tail employment growth compared to a founder at age 30.16
Overall, we see that younger founders appear strongly disadvantaged in their tendency to produce the highest-growth companies. That said, there is a hint of some interesting age thresholds and plateaus in the data. Below age 25, founders appear to do badly (or rather, do well extremely rarely), but there is a sharp increase in performance at age 25. Between ages 25 and 35, performance seems fairly flat.
16 Results (not shown) controlling for industry are virtually unchanged.
Figure 1. Founder Age Distribution: All Start-Ups and High Growth Start-Ups
Notes: This set of kernel density plots shows the age distribution of start-up founders (at year of founding) in the United States. Each bin represents an age cohort. Ages between 20 and 65 are incorporated in the plots. The blue (left) plot incorporates all founders of new C corporations, S corporations, and partnerships with employees founded between 2007 and 2014 as identified in the LBD. The red (right) plot represents founders of the top 1 per-cent growth firms founded over the 2007–2009 period. The top 1 perper-cent employment growth threshold value is calculated for each yearly cohort based on the raw employment figures from the LBD in the five years after the birth of the firm.
Source: Authors’ calculations based on W-2 earnings records, form K-1, and LBD.
0.04 0.03 0.02 0.01 Share Age of entrepreneur 0 20 30 40 50 60 70
Overall US start-up founders Founders of top 1% growth start-ups
However, starting after age 35 we see increased success probabilities, now outpac-ing the 25-year-olds. Another large surge in performance comes at age 46 and is sustained toward age 60.
Figure 2. Likelihood of Extreme Success, Conditional on Starting a Firm
Notes: OLS regression coefficients from estimating the likelihood of extreme firm success on a series of age indicators are shown. Ages 20 and below are grouped as 20 while ages 65 and above are grouped as 65. IPO data are sourced from Compustat. Acquisitions are based on firm ownership changes in the LBD. Top 0.1 percent employment outcomes are calculated based on five-year employment growth in the LBD. Regressions use robust standard errors.
Source: Authors’ calculations based on W-2 earnings records, form K-1, LBD, and Compustat for firms founded over the 2007–2009 period.
Panel A. Probability of successful exit (IPO or acquisition), by age
Coefficient estimate 0.004 0.003 0.002 0.001 0 20 30 40 50 60 70 Age of entrepreneur Coefficient estimate 0.004 0.003 0.002 0.001 0 20 30 40 50 60 70 Age of entrepreneur
III. Extensions and Discussion
In this section, we provide secondary results and discussion to further characterize and help interpret the main findings of Section II.
A. Robustness across Sectors, Founding Year, Legal Form,
and Founding Team Definition
The data can be cut several additional ways to further establish robustness of the main results. First, we explore heterogeneity across industries. Online Appendix Table A3 documents some substantial differences across sectors in the mean age of founders. Yet there is no sector, including in computing, where the mean founder ages are below 38, and only 3 of the 315 NAICS-4 digit sectors show a mean founder age below 40. Second, we consider founder age by calendar year, in part to see if the findings are robust outside the Great Recession, which occurs in our sample period. Using ex ante or ex post growth orientation, we find similar age results looking at calendar years individually from 2007–2014 (online Appendix Table A4). Third, we disaggregate the results by legal form and across definitions of the founding team (online Appendix Figure A2). We see that the highest-growth firms are started by individuals in middle age and beyond regardless of legal form or founding team definition.
B. Age Differences within Founding Teams
We further examine age variation within founding teams. To the extent that dif-ferent members of a founding team play difdif-ferent roles, it is theoretically possible that the youngest members play outsized roles. Further, successful firms might fea-ture founding teams with heterogeneous ages, possibly leveraging advantages of both youth and experience. However, looking at the youngest member of success-ful founding teams, a pre-middle-age tendency does not emerge (online Appendix Table A5). For the top 0.1 percent of new ventures, the youngest members center in the late 30s and early 40s (while the oldest members center in the late 40s and early 50s).
C. Entrepreneurial Outliers
Although we have looked at the top 0.1 percent of firms and the rare outcome of successful acquisition or IPO, one might still wonder if even more extreme upper-tail outliers are the province of the very young. More precisely, several cases of extreme entrepreneurial success in the software and IT sectors have prominently featured very young founders (e.g., Steve Jobs, Bill Gates, and Mark Zuckerberg). One response to this observation is to balance the ledger by noting cases of extraor-dinary successes featuring older founders. For example, Herbert Boyer was age 40 when, based on his genetic engineering breakthroughs, he founded Genentech (which would eventually be acquired for $47 billion), and David Duffield was 64 when he founded Workday (which currently has a market capitalization of $43 billion).
At the same time, a subtler but perhaps more important response may lie among the greatest young founders themselves. Namely, the claim that young people are especially good at starting companies is a within person claim. That is, a given individual is thought to be “better” when s/he is young (e.g., when s/he may have greater energy, deductive abilities, originality, etc.). If so, then we would expect great young entrepreneurs to become “worse” when they age. At a cursory level, this seems doubtful. Elon Musk’s Tesla and SpaceX seem no less visionary than his earlier ventures, Zip2, and X.com. Steve Jobs and Apple appeared to find their blockbuster innovation with the iPhone, introduced when Jobs was 52. Jeff Bezos and Amazon have moved far beyond selling books online. These examples suggest that these prominent founders themselves may not have peaked when very young.
To examine this idea quantitatively, we studied the forward 5-year stock price multiple as a function of founder age for each of Microsoft, Apple, Amazon, and Google.17 This analysis allows us to examine whether the additional growth in mar-ket valuation tends to decline as these individuals age. We see no such tendency (online Appendix Figure A3). In fact, the five-year multiples tend to rise toward middle age. The peaks come at age 48 (Steve Jobs), age 39 (Bill Gates), age 45 (Jeff Bezos), and age 36 (Sergei Brin and Larry Page).
Because many forces influence the stock prices of firms, interpreting these results requires substantial caution. With this important caveat in mind, however, the pat-terns may suggest a potential reconciliation between the existence of great young entrepreneurs and the advantages of middle age. Namely, extremely talented people may also be extremely talented when young. These individuals may succeed at very young ages, even when people (including these young successes) get better with age. Thus there is no fundamental tension between the existence of great young entrepreneurs and a general tendency for founders to reach their peak entrepreneur-ial potententrepreneur-ial later in life.
D. Industry Experience
Among successful entrepreneurs more broadly, we further consider the idea that capabilities may increase with experience by consulting prior employment histories. Using the LEHD to link 2.5 million founders to their prior work experience, we examine, for every founder, whether the individual has prior work experience in the specific sector of the start-up. Overall, the results (Table 3) indicate that founders with both closer and longer experience in the specific industrial sector of the start-up see substantially greater success rates. For achieving a 1 in 1,000 highest-growth firm, having no experience in the 2-digit level industry leads to a success rate of 0.11 percent, while having at least three years of experience in the start-up’s indus-try shows success rates rising to 0.22 percent (NAICS2 experience), 0.24 percent (NAICS4 experience), and 0.26 percent (NAICS6 experience). These findings are the opposite of stories that emphasize an outsider advantage for founders—which
17 The stock price multiple is the ratio of the closing stock price five years in the future to the January 1 closing stock price in the current year. The stock price series are post IPO and account for dividends and splits. While Facebook would be a natural addition to this quartet of firms, the stock price series is too short as yet to allow such analysis.
is a primary rationale underlying the broader belief that young people will produce the highest-growth firms.
E. Prior Wages
We can further incorporate individuals’ prior W-2 wages into the decision to start new firms. Net of wage controls, we find that entry still peaks in middle age (online Appendix Figure A5). At the same time, wages positively predict success. Individuals who start the highest-growth firms typically have very high prior wages (online Appendix Figure A6), so that these individuals have outsized success both in the labor market and in founding firms. This finding is consistent with upper-tail founders having high skill; it is also consistent with the idea that high-growth found-ers set a high bar for entry into entrepreneurship, given a high opportunity cost of leaving the ordinary labor market behind.
F. Venture Capital Behavior
We also see that venture capitalists tend to bet on relatively young founders. Given that younger founders have substantially lower batting averages (e.g., see Figure 2), the founder-age tendency in VC investments may be surprising. VCs may thus be seen as making bad bets, which may be consistent with empirical findings suggesting that VCs have trouble predicting success and have earned low returns (Kaplan and Lerner 2010; Kerr, Nanda, and Rhodes-Kropf 2014). However, young founders may also be more in need of early-stage external finance, thus leading to this relationship. More subtly, and noting that VCs are seeking high returns, which is not identical to high growth, it may be that younger founders tend to sell their equity at lower prices, and thus VCs are making optimal return decisions. Teasing apart
Table 3—Industry-Specific Experience and Growth Outcomes Top
10 percent 5 percentTop 1 percentTop Top 0.1 percent Successfulexit
Panel A. Founders with work experience in start-up’s 2-digit industry classification
NAICS-2 experience
Never 8.6% 4.1% 0.9% 0.11% 0.13%
1–2 years 10.1% 4.8% 1.0% 0.11% 0.10%
≥ 3 years 15.0% 7.7% 1.7% 0.22% 0.20%
Panel B. Founders with work experience in start-up’s 4-digit industry classification
NAICS-4 experience
Never 9.1% 4.5% 1.0% 0.12% 0.14%
1–2 years 11.6% 5.6% 1.1% 0.14% 0.12%
≥ 3 years 16.8% 8.5% 1.7% 0.24% 0.20%
Panel C. Founders with work experience in start-up’s 6-digit industry classification
NAICS-6 experience
Never 9.4% 4.6% 1.0% 0.12% 0.13%
1–2 years 12.6% 6.0% 1.2% 0.15% 0.13%
≥ 3 years 17.7% 9.0% 1.8% 0.26% 0.21%
Notes: Data incorporate all C corporations, S corporations, and partnerships founded over 2007–2009 in the LBD, for which we can observe five years of performance data after founding. Growth outcomes are determined by employment growth, using the five-year window after founding.
why VCs bet young is an interesting area for further work. We can say now however that venture capital, a major source of early-stage financing that can help drive cre-ative destruction and economy-wide growth, does not currently appear allocated to the firms with the highest growth potential.
IV. Conclusion
Researchers, policymakers, investors, and entrepreneurs themselves all strive to understand entrepreneurial traits that predict the creation of successful new firms. This paper has focused on founder age, which is often thought to be a key predictor of entrepreneurial success. We find that age indeed predicts success, and sharply, but in the opposite way that many propose. The highest success rates in entrepreneur-ship come from founders in middle age and beyond.
These findings are consistent with theories in which key entrepreneurial resources (such as human capital, financial capital, and social capital) accumulate with age. Mechanisms by which young people are proposed to have advantages (such as energy or originality) may still be operating, but if so they appear to be overwhelmed by other forces. Future work can explore how variation in specific founder traits pre-dict entrepreneurial entry and success, further informing underlying theories for the life cycle of entrepreneurs and provide additional capacity to predict entrepreneurial success. More broadly, new administrative datasets linking founder traits and busi-ness outcomes promise to further reveal core facts about the high-growth new ven-tures that can drive economic growth and the advance of socioeconomic prosperity.
REFERENCES
Adelino, Manuel, Antoinette Schoar, and Felipe Severino. 2015. “House Prices, Collateral, and Self-Employment.” Journal of Financial Economics 117 (2): 288–306.
Amaral, A. Miguel, Rui Baptista, and Francisco Lima. 2011. “Serial Entrepreneurship: Impact of Human Capital on Time to Re-Entry.” Small Business Economics 37 (1): 1–21.
Andersen, Steffen, and Kasper Meisner Nielsen. 2012. “Ability or Finances as Constraints on Entre-preneurship? Evidence from Survival Rates in a Natural Experiment.” Review of Financial Studies 25 (12): 3684–3710.
Azoulay, Pierre, Christian Fons-Rosen, and Joshua S. Graff Zivin. 2019. “Does Science Advance One Funeral at a Time?” American Economic Review 109 (8): 2889–2920.
Azoulay, Pierre, Benjamin F. Jones, J. Daniel Kim, and Javier Miranda. 2020. “Age and High-Growth Entrepreneurship: Dataset.” American Economic Review: Insights. https://doi.org/10.1257/ aeri.20180582.
Chatterji, Aaron K. 2009. “Spawned with a Silver Spoon? Entrepreneurial Performance and Innova-tion in the Medical Device Industry.” Strategic Management Journal 30 (2): 185–206.
Chen, Henry, Paul A. Gompers, Anna Kovner, and Josh Lerner. 2010. “Buy Local? The Geography of Successful Venture Capital Expansion.” Journal of Urban Economics 67 (1): 90–110.
Dahl, Michael S., and Olav Sorenson. 2012. “Home Sweet Home: Entrepreneurs’ Location Choices and the Performance of their Ventures.” Management Science 58 (6): 1059–71.
Dietrich, Arne, and Narayanan Srinivasan. 2007. “The Optimal Age to Start a Revolution.” Journal of
Creative Behavior 41 (1): 54–74.
Dunn, Thomas, and Douglas Holtz-Eakin. 2000. “Financial Capital, Human Capital, and the Transi-tion to Self-Employment: Evidence from IntergeneraTransi-tional Links.” Journal of Labor Economics 18 (2): 282–305.
Evans, David S., and Boyan Jovanovic. 1989. “An Estimated Model of Entrepreneurial Choice under Liquidity Constraints.” Journal of Political Economy 97 (4): 808–27.
Fairlie, Robert W., and Alicia Robb. 2007. “Families, Human Capital, and Small Business: Evidence from the Characteristics of Business Owners Survey.” Industrial and Labor Relations Review 60 (2): 225–45.
Fort, Teresa C., John Haltiwanger, Ron S. Jarmin, and Javier Miranda. 2013. “How Firms Respond to Business Cycles: The Role of Firm Age and Firm Size.” IMF Economic Review 61 (3): 520–59.
Frick, Walter. 2014. “How Old Are Silicon Valley’s Top Founders? Here’s the Data.” Harvard Business
Review. https://hbr.org/2014/04/how-old-are-silicon-valleys-top-founders-heres-the-data.
Glaeser, Edward L. 2009. “Entrepreneurship and the City.” In Entrepreneurship and Openness:
The-ory and Evidence, edited by David B. Audretsch, Robert E. Litan, and Robert J. Strom, 131–80.
Northampton, MA: Edward Elgar Publishing.
Graham, Stuart J. H., Cheryl Grim, Tariqul Islam, Alan C. Marco, and Javier Miranda. 2018. “Busi-ness Dynamics of Innovating Firms: Linking U.S. Patents with Administrative Data on Workers and Firms.” Journal of Economics and Management Strategy 27 (3): 372–402.
Gruber, Marc, Ian C. MacMillan, and James D. Thompson. 2008. “Look Before You Leap: Market Opportunity Identification in Emerging Technology Firms.” Management Science 54 (9): 1652–65.
Guzman, Jorge, and Scott Stern. 2017. “Nowcasting and Placecasting Entrepreneurial Quality and Performance.” In Measuring Entrepreneurial Businesses: Current Knowledge and Challenges, edited by John Haltiwanger, Erik Hurst, Javier Miranda, and Antoinette Schoar, 63–109. Chicago: University of Chicago Press.
Haltiwanger, John C., Ron S. Jarmin, and Javier Miranda. 2013. “Who Creates Jobs? Small Versus Large Versus Young.” Review of Economics and Statistics 95 (2): 347–61.
Hecker, Daniel E. 2005. “High-Technology Employment: A NAICS-Based Update.” Monthly Labor
Review 128 (7): 57–72.
Holtz-Eakin, Douglas, David Joulfaian, and Harvey S. Rosen. 1994a. “Entrepreneurial Decisions and Liquidity Constraints.” RAND Journal of Economics 25 (2): 334–47.
Holtz-Eakin, Douglas, David Joulfaian, and Harvey S. Rosen. 1994b. “Sticking It Out: Entrepreneurial Survival and Liquidity Constraints.” Journal of Political Economy 102 (1): 53–75.
Hurst, Erik, and Annamaria Lusardi. 2004. “Liquidity Constraints, Household Wealth, and Entrepre-neurship.” Journal of Political Economy 112 (2): 319–47.
Hurst, Erik, and Benjamin Wild Pugsley. 2011. “What Do Small Businesses Do?” Brookings Papers
on Economic Activity 43 (2): 73–142.
Iyigun, Murat F., and Ann L. Owen. 1998. “Risk, Entrepreneurship, and Human-Capital Accumula-tion.” American Economic Review 88 (2): 454–57.
Jones, Benjamin F. 2010. “Age and Great Invention.” Review of Economics and Statistics 92 (1): 1–14.
Jones, Benjamin F., E. J. Reedy, and Bruce A. Weinberg. 2014. “Age and Scientific Genius.” In The
Wiley Handbook of Genius, edited by Dean Keith Simonton, 422–50. West Sussex, UK: John Wiley
& Sons, Ltd.
Kaplan, Steven N., and Josh Lerner. 2010. “It Ain’t Broke: The Past, Present, and Future of Venture Capital.” Journal of Applied Corporate Finance 22 (2): 36–47.
Kautonen, Teemu, Simon Down, and Maria Minniti. 2014. “Ageing and Entrepreneurial Preferences.”
Small Business Economics 42 (3): 579–94.
Kerr, Sari Pekkala, and William R. Kerr. 2017. “Immigrant Entrepreneurship.” In Measuring
Entre-preneurial Businesses: Current Knowledge and Challenges, edited by John Haltiwanger, Erik
Hurst, Javier Miranda, and Antoinette Schoar, 187–249. Chicago: University of Chicago Press.
Kerr, William R., Ramana Nanda, and Matthew Rhodes-Kropf. 2014. “Entrepreneurship as Experi-mentation.” Journal of Economic Perspectives 28 (3): 25–48.
Kihlstrom, Richard E., and Jean-Jacques Laffont. 1979. “A General Equilibrium Entrepreneurial Theory of Firm Formation Based on Risk Aversion.” Journal of Political Economy 87 (4): 719–48.
Lafontaine, Francine, and Kathryn Shaw. 2016. “Serial Entrepreneurship: Learning by Doing?”
Jour-nal of Labor Economics 34 (S2): S217–54.
Lazear, Edward P. 2004. “Balanced Skills and Entrepreneurship.” American Economic Review 94 (2): 208–11.
Lazear, Edward P. 2005. “Entrepreneurship.” Journal of Labor Economics 23 (4): 649–80.
Levine, Ross, and Yona Rubinstein. 2017. “Smart and Illicit: Who Becomes an Entrepreneur and Do They Earn More?” Quarterly Journal of Economics 132 (2): 963–1018.
Lucas, Robert E., Jr. 1978. “On the Size Distribution of Business Firms.” Bell Journal of Economics 9 (2): 508–23.
Ng, Weiyi, and Toby E. Stuart. 2016. “Of Hobos and Highflyers: Disentangling the Classes and Careers of Technology-Based Entrepreneurs.” https://pdfs.semanticscholar.org/9daa/9156d2071c6d1af663 27efe8587a137f4dd3.pdf (accessed October 21, 2019).
Planck, Max. 1949. “The Meaning and Limits of Exact Science.” Science 110 (2857): 319–27.
Roberts, Edward B. 1991. Entrepreneurs in High Technology: Lessons from MIT and Beyond. New York: Oxford University Press.
Schumpeter, Joseph A. 1942. “Creative Destruction.” In Capitalism, Socialism and Democracy. New York: Harper, 1975.
Smith, Adam. 1776. The Wealth of Nations. London: W. Strahan and T. Cadell.
Stiglitz, Joseph E., and Andrew Weiss. 1981. “Credit Rationing in Markets with Imperfect Informa-tion.” American Economic Review 71 (3): 393–410.
Wadhwa, Vivek, Richard Freeman, and Ben Rissing. 2008. Education and Tech Entrepreneurship. Kauffman Foundation Brief. Kansas City Missouri: Kauffman Foundation of Entrepreneurship.
Weinberg, Bruce A. 2006. “Which Labor Economists Invested in Human Capital? Geography, Vintage, and Participation in Scientific Revolutions.” http://citeseerx.ist.psu.edu/viewdoc/download?doi=10 .1.1.376.1877&rep=rep1&type=pdf (accessed October 21, 2019).