Acoustical-Molecular Techniques for Magnetic Resonance Imaging
by
ARCHIVES
MASSACHUSTS INSTITUTE
Bo Zhu
-TECH14OLOGY
M.Eng., Electrical Engineering and Computer Science
MAR 14 2016
Massachusetts Institute of Technology, 2008
S.B., Electrical Engineering
LIBRARIES
Massachusetts Institute of Technology, 2007
SUBMITTED TO THE HARVARD-MIT DIVISION OF HEALTH SCIENCES AND
TECHNOLOGY IN PARTIAL FULFILLMENT OF THE REQUIREMENTS FOR THE
DEGREE OF
DOCTOR OF PHILOSOPHY IN BIOMEDICAL ENGINEERING
AT THE
MASSACHUSETTS INSTITUTE OF TECHNOLOGY
FEBRUARY 2016
C 2016 Massachusetts Institute of Technology. All rights reserved.
Signature of Author
...
Signature redacted
Department of Health Sciences and Technology
January 26, 2016
Certified by
Signature redacted
Bruce R. Rosen, MD, PhD
Director, MGH Athinoula A. Martinos Center for Biomedical Imaging
Professor of Radiology and Health ciences and Technology
Thesis Supervisor
Signature redacted
Accepted by ...--- -...
Emery N. Brown, MD, PhD
Director, Harvard-MIT Program in Health Sciences and Technology
Professor of Computational Neuroscience and Health Sciences and Technology
Acoustical-Molecular Techniques for Magnetic Resonance Imaging
by
Bo Zhu
Submitted to the Harvard-MIT Division of Health Sciences and Technology on Feb 1, 2016, in partial fulfillment of the
requirements for the degree of DOCTOR OF PHILOSOPHY
IN BIOMEDICAL ENGINEERING
Magnetic resonance imaging (MRI) is a remarkably flexible diagnostic platform due to the variety of clinically relevant physical, chemical, and biological phenomena it can detect. In addition to the host of endogenous contrast mechanisms available, MRI functionality can be
further extended by incorporating exogenous factors to attain sensitivity to new classes of indicators. Molecular imaging with targeted injectable contrast agents and MR elastography with externally delivered acoustic vibrations are two such advancements with increasing clinical significance. Conventionally employed separately, this work explores how exogenous
components can interact cooperatively in imaging disease and may be combined to more accurately stage disease progression and generate novel mechanisms of MR contrast, using contrast agents and acoustic stimulation as model systems.
We imaged hepatic fibrosis in a rat model and found that collagen-binding paramagnetic contrast agents and shear wave MR elastography had partially uncorrelated staging abilities, due to the disease condition's differential timing of collagen production and its stiff cross-linking. This complementary feature enabled us to form a composite multivariate model incorporating both methods which exhibited superior diagnostic staging over all stages of fibrosis progression. We then integrated acoustics and molecular-targeting agents at a deeper level in the form of a novel contrast mechanism, Acoustically Induced Rotary Saturation (AIRS), which switches "on" and "off" the image contrast due to the agents by adjusting the resonance of the spin-lock
condition. This contrast modulation ability provides unprecedented clarity in identifying contrast agent presence as well as sensitive and quantitative statistical measurements via rapidly
modulated block design experiments.
Finally, we extend the AIRS method and show preliminary results for Saturation Harmonic Induced Rotary Saturation (SHIRS), which detects the second harmonic time-oscillation of iron oxide nanoparticles' magnetization in response to an oscillating applied field around B0. We
also illustrate an exploratory method of selectively imaging iron oxide agents by diffusion kurtosis measures of freely diffusing water in solutions of magnetic nanoparticles.
Thesis Supervisor: Bruce R. Rosen
Title: Professor of Health Sciences and Technology, Professor of Radiology at Harvard Medical School
Acknowledgements
There are many people who I would like to thank, without whom this work and my path would not be possible. I would first like to thank my thesis supervisor Bruce Rosen, who has been an incredible advisor. In addition to deep scientific knowledge and insights he has imparted to me, his continual encouragement and support over the years have made my graduate career an exciting and joyous learning experience, through all the natural ups and downs of the research process. I would also like to thank my co-supervisor Lawrence Wald, who has shown me the ropes in the art of the physical experiment. I am also indebted to Peter Caravan and Alan
Jasanoff, who have provided invaluable wisdom and guidance as my thesis committee members.
I thank all of my friends and community for their care and encouragement, especially during the
more difficult times in my life. You all have given me more than you know. I am indebted in so many ways to my parents, who have instilled in me a lifelong curiosity and drive to excel, and have sacrificed much to provide the best for me. My brothers Ted and Tim, for whom in the past
I sought to be a role model, are increasingly becoming great examples of maturity for me to
follow, in many ways. Finally, I thank Selina, the constant joy of my life. You are a blessing I could never have imagined.
Contents
I
Introduction ... 82 Molecular imaging and elastography for liver fibrosis staging ... 13
2.1 Introduction... 13
2.2 M ethods... 15
2.2.1 A nim al m odel ... 15
2.2.2 EP-3533 probe ... 15
2.2.3 MR imaging protocol ... 15
2.2.4 Postprocessing of MR inversion recovery data ... 18
2.2.5 Postprocessing of MR elastography data ... 19
2.2.6 Generation of composite scoring metric ... 19
2.2.7 Statistical analysis ... 20
2.2.8 T issue analysis ... 20
2.3 R esults ... 2 1 2.3.1 Characterization of fibrosis disease progression...21
2.3.2 Enhanced liver TI shortening in DEN rats ... 21
2.3.3 Increased liver shear stiffness in DEN rats ... 22
2.3.4 Fibrosis staging ability with ARI and shear stiffness ... .24
2.3.5 Fibrosis staging of ARI and shear stiffness via ROC analysis ... 26
2.3.6 Multivariate composite scoring improves fibrosis staging ... 27
2.4 D iscussion ... 30
3 Selective Imaging of Magnetic Nanoparticles with Acoustically Induced Rotary Saturation ... 38
3.1 Introduction ... 38
3.1.1 Conventional challenges of locating iron oxide in-vivo ... 38
3.1.2 Recent contrast mechanism developments and their limitations ... 39
3.1.3 Contrast modulation paradigm ... 40
3.1.4 Using Rotary Saturation to achieve contrast modulation ... 40
3.2. T heory ... 4 1 3.2.1 Spin-lock pulse sequence ... 41
3.2.2 Rotary Saturation ... 42
3.2.3 Rotary Saturation field by oscillating magnetic particles ... 43
3.2.4 Positive or negative contrast via flipback pulse direction ... 46
3.3 M ethods ... 47
3.3.1 Liquid phantom experimental setup ... 47
3.3.2 MR pulse sequence ... 48
3.3.3 Block design experiment ... 48
3.3.4 Characterization experiment ... 49
3.3.5 Positive contrast experiments ... 50
3 .4 R esults ... 5 1 3.4.1 Liquid phantom block design experiment ... 51
3.4.2 Effect strength characterization ... 52
3.4.3 Positive contrast imaging and characterization ... 54
3.5 D iscussio n ... 55
4 Exploratory methods of imaging magnetic nanoparticle contrast agents...65
4.1 Saturation Harmonic Induced Rotary Saturation ... 65
4.1.1 T heory ... 66
4.1.2 Preliminary validation experiment ... 66
4.1.3 Preliminary validation results ... 68
4.2 Non-Gaussian diffusion imaging of SPIO nanoparticles... 70
4.2.1 Theory and background ... 71
4.2.2 Monte Carlo simulation ... 71
4.2.3 Phantom validation experiment methods ... 74
4.2.4 Validation experiment results and discussion ... 75
List of Figures
2.1 Timing diagram of imaging experiment and characterization of DEN-induced rat model of
liver fibrosis ... 17
2.2 TI imaging and quantification of rat liver...22
2.3 MR elastography setup and phase gradient reconstruction of liver shear stiffness...23
2.4 Staging of liver fibrosis by collagen-enhanced MRI and MR elastography...25
2.5 Receiver operating characteristic (ROC) analysis of liver fibrosis staging by collagen-enhanced MRI and MR elastography... 26
2.6 Composite score for staging liver fibrosis incorporating collagen-enhanced imaging and M R elastography m easures...29
2.7 ARI and shear stiffness measurements over CPA and hydroxyproline concentration... 30
3.1 Schematic representation of Acoustically Induced Rotary Saturation... 45
3.2 Liquid phantom block design experiment and results ... 52
3.3 AIRS effect characterization experiment and results ... 54
3.4 AIRS positive contrast imaging and characterization ... 56
4.1 Temporal harmonics of SPIO magnetization in response to applied field oscillations...68
4.2 Off- vs. On-resonant acquisitions in SHIRS liquid phantom preliminary experiment... 69
4.3 Time course of voxel intensities for block design experiment... 70
4.4 Magnetic field and field gradient distributions for Monte Carlo simulations... 73
4.5 Gaussian vs. kurtotic distributions of field gradients change signal loss over b-value... 74
4.6 Demonstration of kurtotic diffusion behavior in SPIO liquid phantom experiment...76
Chapter 1
Introduction
Magnetic Resonance Imaging (MRI) is a powerful investigative tool for clinicians and
researchers to observe structure and function in living organisms. The image contrast associated with MRI is due to the response of excited water protons in the presence of external magnetic fields. The heterogeneity of this response over different tissues and physiological conditions generates biologically relevant contrast, which is useful for clinical diagnostic or biomedical research purposes.
Most forms of MR contrast are endogenous; although external energy is delivered into the subject by the main and gradient magnetic fields and radiofrequency (RF) pulses to prepare and sensitize the proton magnetization to certain physical conditions, the biologically relevant evolution of the magnetization is usually due to endogenous biological properties and processes such as molecular/macromolecular content (which influences T 1 and T2 relaxation), water diffusion and flow, and blood oxygenation, among others. A great amount of research has been and continues to be done to find clever methods of interfacing the magnetic and RF fields with nuclear spin magnetization to enable sensitivity to new and interesting biological phenomena.
MR contrast can be generated in an exogenous manner by delivery of external matter or energy to perturb the spin magnetization for the purpose of interrogating a biologically relevant
condition or property. One of the most common forms of exogenous MR contrast are injected contrast agents, typically gadolinium-based molecules or magnetic nanoparticles that accumulate in a tissue region of interest and signal their presence by perturbing TI or T2/T2* contrast, respectively. These agents are often functionalized with targeting peptides or antibodies to selectively enhance the regions of an MR image that contain a particular molecule or cell type.
In recent years, another form of exogenous MR contrast has gained widespread interest: delivery of external acoustic energy to generate elastographic contrast. An external acoustic driver coupled to the subject typically transfers vibrations in the form of shear waves in tissues. By estimating the spatial frequencies of the shear waves at each voxel, an elastogram can be reconstructed to reveal the local shear stiffness values (and potentially other mechanical viscoelastic measures) in tissues of interest. Because certain diseased tissues, particularly
cancerous, fibrotic, or cystic tissues, often present changes in viscoelastic properties, MR elastography is becoming an increasingly relevant non-invasive diagnostic tool.
In this thesis, I explore how the exogenous aspects of molecular imaging and acoustic
stimulation interact in imaging disease and can be combined to more accurately stage disease progression and generate novel mechanisms of MR contrast.
In Chapter 2, I investigate how effectively collagen-binding contrast agents and MR
elastography interrogate liver fibrosis, first as separate techniques, and then as an integrated composite evaluation. Fibrosis is a natural candidate for exogenous contrast because thus far
endogenous MR measures dependent on T I and water diffusion do not appear to correlate well with fibrosis and its progression. Both collagen-enhanced imaging and MR elastography are well suited to assess fibrosis because the disease is characterized by pathological increases in collagen production as well as cross-linking of collagen and elastin fibers, causing increased tissue
stiffness.
After performing inversion recovery TI quantification and phase contrast MR elastography simultaneously on rats with a diethylnitrosamine (DEN) treatment model of liver fibrosis over varying disease timepoints (8, 12, and 16 weeks), we found that the ARJ values associated with collagen content was able to stage early fibrosis well, but not for moderate or late stages, and in an opposite manner, the shear stiffness values from MR elastography only accurately staged advanced fibrosis. This complementary staging outcome, which is supported at the molecular level by the differential timing of collagen production and its cross-linking, enabled us to form a composite multivariate linear model incorporating both ARI and shear stiffness scores; the resultant composite metric was shown to discriminate well at both the early and late stages of
fibrosis.
In Chapter 3, I report a novel technique, Acoustically Induced Rotary Saturation (AIRS), which uses acoustic frequency mechanical stimulation to generate modulatable MR contrast from magnetic nanoparticle contrast agents. The acoustic perturbations induce oscillating relative motion between local water and the magnetic nanoparticles, resulting in the spin-locked water experiencing sinusoidally varying magnetic fields which under frequency-matched resonant conditions causes coherent rotation of the magnetization (and thus contrast modulation) as
dictated by the dynamics of the Bloch Equation. Furthermore, the acoustic drive can be externally modulated to turn the effect on and off, allowing sensitive and quantitative statistical comparison, as well as removal of confounding image background variations.
We demonstrate this concept in a phantom validation experiment, using piezoelectric actuators to generate vibrational displacements of iron oxide samples. We can observe a resonant behavior of the signal changes with respect to the acoustic frequency where iron oxide is present. We show that this effect stays approximately constant across acoustic frequency, and behaves
monotonically over actuator displacement and contrast agent concentration. Most importantly, the resonant effect allowed us to generate block-design "modulation response maps" indicating the contrast agents' location, as well as positive contrast images with suppressed background signal. This contrast mechanism addresses the long-standing challenge of accurately detecting MR contrast agents in the presence of complex background tissue.
In Chapter 4, 1 illustrate two imaging techniques at the exploratory stage that expand upon the concepts of the previous chapters and show preliminary results. Instead of introducing acoustic-frequency mechanical vibrations to generate nanoparticle contrast, Saturation Harmonic Induced Rotary Saturation (SHIRS) sinusoidally shifts the main BO field to oscillate the magnetization strength of the iron oxide particles, which produces a rotary saturation effect that can be detected at the second harmonic to avoid the confounding drive field at the fundamental drive frequency. We show preliminary contrast modulation results in a liquid phantom experiment. The potential advantage of this method over AIRS is that it more directly generates an oscillating
nanoparticle-introduce an additional source of experimental error. Finally, I nanoparticle-introduce a technique to selectively image magnetic nanoparticles based on the nanoscale non-Gaussian magnetic fields that water molecules experience in a field of magnetic nanoparticles during random walk
diffusion. With Monte Carlo simulations and diffusion-weighted imaging of phantom samples with varying concentrations of iron oxide nanoparticles, I show preliminary results
demonstrating a monotonic and nearly linear relationship between the non-Gaussian measure of kurtosis and magnetic nanoparticle concentration. Because the high nanoparticle field strengths and unique nanoscale spatial distribution of the nanoparticle fields are not found naturally elsewhere in the body, this technique shows potential for selectively imaging magnetic nanoparticles in-vivo.
Chapter 2
Molecular imaging and elastography for liver fibrosis
staging
2.1 Introduction
Chronic liver disease is an increasingly prevalent cause of morbidity and mortality worldwide
[1] , and results from a wide range of factors such as viral hepatitis, excess alcohol consumption, diabetes, and metabolic dysfunction. Repeated injury to the liver from these conditions results in a fibrotic tissue repair response that replaces necrotic tissue with extracellular matrix scar, rich in fibrilliar collagen. If the underlying causes of disease are eliminated early enough, liver fibrosis may be regressed to less advanced stages or be fully reversed to normal architecture and function [2], but if left unchecked, fibrosis will often progress to cirrhosis, which significantly impairs liver function and is the 12th leading cause of death in the United States [3] . Therefore, accurate
assessment of fibrosis stage and early detection of fibrosis, as well as monitoring its response to therapy, are vital clinical requirements for effective management of liver disease.
Liver biopsy is the gold standard in assessing liver fibrosis [4], although it suffers from many limitations including sampling error, inter-observer variability, and risk of complications; hospitalization is required in 1-5% cases of biopsy [5,6] . Even at advanced stages of fibrosis, large error rates in diagnosis of 33% have been reported [7] . Furthermore, repeated biopsies to evaluate disease progression or response to treatment are not ideal due to increased risk of
complication. Therefore, non-invasive strategies that can repeatedly measure fibrosis throughout the entire organ are advantageous and urgently needed.
MR elastography (MRE) has gained considerable interest in recent years as a clinically relevant method to assess fibrosis, although it has been reported to be most reliable at detecting advanced fibrosis and cirrhosis, during which portal hypertension, inflammation, and collagen cross-linking are some of the commonly acknowledged factors contributing to late-stage liver
stiffening [8-10].
More recently, another imaging advancement, a peptide-based Type I collagen specific MR probe, termed EP-3533, enabled the ability to image collagen levels in-vivo as a targeted TI contrast agent. We had previously reported data with EP-3533, and demonstrated its utility in cardiac, pulmonary, and hepatic models of fibrosis [11-16] .In a recent study we showed that
EP-3533 could accurately stage liver fibrosis [13] and was more sensitive than other
conventional MRI measures such as water diffusion.
In order to compare and contrast the effectiveness of MRE and collagen imaging in assessing liver fibrosis, we concurrently perforned the two techniques on diethylnitrosamine (DEN)-treated rats. We examined the effectiveness of these imagine methods for staging liver fibrosis progression, and explored whether there could be advantages in incorporating both techniques for further increased accuracy in staging fibrosis.
2.2
Methods
2.2.1 Animal model
All experiments were performed in accordance with the NIH Guide for the Care of Use of
Laboratory Animals and were approved by the institution's animal care and use committee. Male Wistar rats (Charles River Laboratories, Wilmington, MA) were administered weekly doses of
100 mg/kg of diethylnitrosamine (DEN) for either 8, 12, or 16 weeks, to induce fibrosis at
different stages (n = 6 for each time point). Controls (n=4 for each time point) received phosphate buffered saline (PBS). Animals were imaged approximately one week after the last
injection to avoid acute effects of DEN.
2.2.2 EP-3533 probe
EP-3533 comprises a ten amino acid cyclic peptide conjugated to three gadolinium (Gd)
moieties, and was synthesized as previously reported [I] . The peptide confers affinity for type
I collagen and the Gd moieties provide strong signal enhancement (relaxivity = 48.4 mM-'s1 at l.4T) [16].
2.2.3 MR Imaging protocol
Animals were anesthetized with isoflurane (1-2%) and placed in a specially designed cradle. The tail vein was cannulated for intravenous delivery of the contrast agent while the animal was positioned in the scanner. Imaging was performed at 1.5T using a clinical MRI scanner (Siemens
Healthcare, Malvern, PA) with a custom-built solenoid coil. Each animal was placed within the solenoid coil in the supine position. A silver needle (disposable silver acupuncture needles,
0.20 x 48 mm; Asahi Medical Instrument Co.,. Kawaguchi, Saitama, Japan) was inserted through a gap in the solenoid coil and into the liver tissue through the anterior body wall, in a
setup similar to that of [17] .An electromechanical driver attached to the other end of the needle generated longitudinal sinusoidal vibrations at 200 Hz (Fig. 2.3A).
Respiratory-gated, 3D inversion recovery images were acquired prior to and 45 minutes
following the intravenous administration of EP-3533. A non-selective inversion pulse was used and images were acquired with inversion recovery times of 50, 100, 200, 250, 300, 400 and 1000 ms. Image acquisition parameters consisted of an echo time of TE = 2.44 ms, field of view FOV = 120 x 120 mm, matrix = 192 x 192 (0.625 mm in-plane resolution), slice
thickness = 0.6 mm, and 36 image slices. The effective repetition time was dictated by the respiration rate through gating. In order to confirm proper delivery of contrast agent, Dynamic Contrast Enhancement spoiled gradient echo (SPGR) acquisitions were taken during a four-minute interval, starting one four-minute before prior to injection to measure baseline signal levels. Doses of the contrast agent were given based on animal surface area at 7.26 nmol/cm2. The surface area (SA) for each animal was estimated by the standard formula S4 = k W- where W is the weight in grams and k is the Meeh constant, which empirically is determined to be
EP-3533 Probe Injection A .- t -J C LL U E -20 min U) LU -0
Pre-Post Interval: 45 min
C
PBSD
0oU-CL) E ' -20 min Week 8 Week 16G
irA-iii"
-don-j-10Fig. 2.1. Timing diagram of imaging experiment and characterization of DEN-induced rat model of liver fibrosis. (A) Timing diagram of imaging session, starting with a pre-injection inversion recovery sequence for T
quantification. followed by EP-3533 probe injection, dynamic contrast enhancement to validate probe delivery to liver, MR elastography, and finally the post-injection inversion recovery acquisition 45 minutes after injection.
(B-E) Representative images of Sirius Red staining after DEN administration for 8, 12, and 16 weeks. (F) Collagen
proportional area as assessed by quantification of Sirius Red staining, increased progressively with time. (G) Total collagen as assessed by hydroxyproline analysis, increased progressively with time. * p < 0.05, ** p < 0.01, p <
0.005, and **** < 0.001. 17
B
F
Week 12 _IleMR elastography of the rat liver was performed after the injection and DCE imaging, during the 45-minute pre-post interval. A gradient echo (GRE) MRE sequence was used for wave image acquisition with following parameters: matrix size 256x256, TR = 50 ms, TE = 23.3 ms, flip
angle =_30, slice thickness = 5 mm, field of view = 100mm x 100mm, one pair of 20 mT/m trapezoidal motion-encoding gradients (MEG) at 200 Hz. The trigger pulses initiating the
sinusoidal oscillations of the electromechanical driver were moved relative to the MEG to obtain images at eight different phase offsets between the motion and the MEG, equally spaced over one cycle of the motion.
Following imaging, animals were sacrificed and liver tissue was subjected to pathologic scoring of fibrosis and analyzed for hydroxyproline content.
2.2.4 Postprocessing of MR Inversion Recovery data
TI was quantified from a three parameter fit of the dependence of liver signal intensity (S) on inversion time (TI) and repetition time (TR) using a nonlinear least squares algorithm with a custom written MATLAB (Mathworks, Natick, MA) program.
TR TI
S = SO(1 - cos 0 e T1- (1 - cos O)e T1) (Eq. 2.1)
where So is the signal intensity at full recovery, and 0 is the flip angle. The liver signal intensity
S is the averaged signal in regions of interest (ROls) isolating the rat liver over a 2.4 mm-thick
group of slices near the center of the liver.
The mean TR for each scan was extracted from the DICOM timestamp data by dividing the duration of the scan by the number of phase encode repetitions. Because the TR changes according to the respiratory rate of the animal, using the precise TR for each TI allows for more
accurate quantification of TI.
The difference between Ri (the inverse of TI) values between pre- and post- injection sessions were computed for each animal, and these ARI values were then corrected based on the Gd concentration remaining in the blood, to account for variance between animals of probe delivery to the liver. This Gd concentration was extracted by Ti measurements of blood voxels.
2.2.5
Postprocessing of MR Elastography data
A phase gradient (PG) reconstruction method reported previously by Yin, et al. [17] was
employed to extract shear stiffness values from the acquired data. For each animal, the phase of the first temporal harmonic of the acquired wave images were computed and unwrapped. The phase values along evenly-spaced spokes radially propagating from the needle location were selected to represent an aggregate phase gradient in the liver, which was derived by a linear fit of the phase values over radial distance. The phase gradient is directly related to the spatial
wavelength (A = 27r/PG), and this spatial wavelength is used to calculate the shear stiffness p via the well-known elastic wave mechanics relation p =fA9Ip, wheref is the temporal frequency of the shear wave vibration (in this case 200 Hz), and p is the density of the tissue, typically
estimated in elastography experiments to be 1000 kg/M3. 2.2.6 Generation of composite scoring metric
Multivariate analysis of variance (MANOVA) was performed on the ARI and MRE data to form a single composite score based on linear combination of the two original metrics. Optimal linear weighting coefficients were determined such that the linear combination resulted in maximum discrimination between the Ishak groups according to the F-test statistic SSB/SSw, where SSB is
the sum-of-squares between groups and SSw is the sum-of-squares within groups [20] .
MANOVA analysis was calculated from custom code in a MATLAB (Mathworks, Natick, MA)
program.
2.2.7 Statistical analysis
Data are displayed as box plots with the dark band inside the box representing the mean, the bottom and top of the box the first and third quartiles, and the whiskers the minimum and maximum values. Data are reported as the mean + standard error. Statistical analyses (Analysis of Variance (ANOVA) and Receiver Operating Characteristic (ROC) analysis) were performed using Prism 6 (GraphPad Software, Inc., La Jolla, CA) with p <0.05 considered as significant. Differences among groups were tested with one-way ANOVA followed by the Tukey post-hoc test.
2.2.8 Tissue analysis
Formalin-fixed samples were embedded in paraffin, cut into 5 Im-thick sections and stained with Sirius Red according to standard procedures. Sirius Red stained sections were analyzed by a pathologist, who was blinded to the study, to score the amount of liver disease according to the method of Ishak. In addition, the collagen proportional area (CPA) was morphometrically
calculated using ImageJ (NIH). Hydroxyproline in tissue was quantified by HPLC analysis as previously described [21]. Gd was quantified in tissue acid digests by inductively coupled plasma-mass spectrometry using dysprosium as an internal standard. Hydroxyproline and Gd are expressed as amounts per wet weight of tissue.
2.3 Results
2.3.1. Characterization of fibrosis disease progression
Liver fibrosis and disease progression in the DEN rat model was characterized by the CPA of histological tissue sections (Fig. 2.1 B-E) and HPLC analysis of hydroxyproline content. CPA increased progressively at each time point from 0.69 0.05% for PBS rats, 3.77 + 0.56% for
week 8 DEN rats, 7.32 2.01% for week 12 DEN rats, to 7.83 1.43 for week 16 rats (Fig. 2.1 F). Hydroxyproline content also increased progressively with time from 229 17 pg/g for PBS rats, 404 47 gg/g for week 8 rats, 563 92 gg/g for week 12 rats, and 591 30 pg/g for
week 16 rats (Fig. 2.IG).
2.3.2. Enhanced liver TI shortening in DEN rats
A respiratory-gated, three-dimensional inversion recovery MRI sequence was used to quantify
Ti of the liver. Representative inversion recovery images at TI = 400 ms for data acquired pre
and post-EP3533 are shown in Fig. 2.2 for week 16 DEN rat (Fig. 2.2A and 2.2C) and a PBS
control rat (Fig. 2.2B and 2.2D). A more dramatic signal enhancement is observed following contrast agent injection for the DEN rat compared to the PBS rat, which is indicative of increased TI shortening due to greater accumulation of the EP-3533 contrast agent. This difference in TI shortening is more precisely demonstrated by TI fitting of acquired data at all
TIs (Fig. 2.2E-F). The difference between the pre- (blue) and post-EP3533 (red) curves is
A
Pre EP-3533C
Post EP-3533E
Inversion Recovery Signal 600 400 200 0 a Pre EP-3533 Post EP-3533 - Data - T1 curve fit 200 400 600 800 1000FInversion
Time (mnsiB
D
F
600 400 200--0 z w. Pre EFP-3533L>oo Post EP-3533
0 Data - T 1 curve fit
200 400 600 800 1000
Inversion Time (rns)
Fig. 2.2. TI imaging and quantification of rat liver. (A,B) Pre-injection inversion recovery scans for PBS (A) and DEN-treated (B) rats at an inversion time of 400 ms. (C,D) Post-injection inversion recovery scans for PBS (C) and DEN-treated (D) rats at an inversion timei of 400 ms. Thle signal enhancement is noticeably larger for the DEN-treated rats (B vs. D). (E-F) The signal averaged over liver ROI for all inversion times, with a TI inversion recovery model (solid line) fitting the data (circles).
2.3.3 Increased liver shear stiffness in DEN rats
Shear stiffness measurements of the rat livers were taken by magnetic resonance elastography. Using a conventional local frequency estimation (LFE) method to post-process the MRE acquisitions yields elastogramis such as those in Fig. 2.3C and 3D, which show representative elastogramns of a PBS control rat liver and a week 16 DEN rat liver, respectively. Much greater shear stiffness values were observed in the DEN-treated rat liver than the control liver. Because hepatic fibrosis is typically distributed homnogenously throughout the liver at the macroscopic scale [22] , it has been shown that highly precise measures of shear stiffnesses can be obtained
through phase gradient reconstruction of MRE acquisitions of radially propagating shear waves
[17] . The higher spatial wavelengths observed in the radially propagating waves in the DEN liver (Fig. 2.3F) compared to that of the control (Fig. 2.3E) can be demonstrated quantitatively through this phase gradient method (Fig. 2.3G and 3H), whereby a single shear stiffness value representing the whole liver is extracted from the data with the analytical procedures previously described.
E
MRE Phase ContrastF
G
Phase Gradient R' 0 9960 595 p3 859 kWu 3 5 7 9 D0stanux hTr center nmmFig. 2.3. MR elastography setup and phase gradient reconstruction of liver shear stiffness. (A) Experimental
setup of vibration delivery. The rat is placed supine in the solenoid coil. Above, an electromechanical driver powered by an amplifier and signal generator (not illustrated) is connected to a silver acupuncture needle. (B) The needle is inserted into the rat liver which delivers vibrations from the driver directly into the liver tissue. (C-D) Conventional elastograms computed by local frequency estimation demonstrating greater shear stiffness in a DEN-treated animal (D) than in the PBS control (C). (E-F) Representative phase contrast images of shear waves radially propagating from the needle location. Note the greater spatial wavelengths in the DEN-treated animal (F), reflecting the greater shear stiffness. (G-H) The phase of the first temporal harmonic of these phase contrast images plotted over radial distance from the needle (blue) represents the phase gradient, which can be linearly fit (red) to quantify a shear stiffness value.
A
B
r
D
a) L) E)2.3.4 Fibrosis staging ability with AR1 and shear stiffness
To assess the ability of the techniques to stage liver fibrosis, we separated the animals into four
groups based on Ishak score (Ishak 0, Ishak 1-2, Ishak 3-4, and Ishak 5-6) and CPA (CPA < 2%,
CPA 2%-4%, CPA 4%-6%, and CPA > 6%). The CPA cutoffs were determined by its
relationship to Ishak score: the CPA in all rats with Ishak 0 were below 2%, the majority of rats with Ishak 1-4 ranged from 2% to 4%, all rats with Ishak 5 ranged from 4%-6%, and all rats with Ishak 6 were above 6%. The ARJ and shear stiffness values for each group are plotted in Fig. 2.4. The general trend we observed was that the collagen probe (via ARI) exhibited the largest differences between the least fibrotic groups (Ishak 0 and CPA < 2%) and the other groups, while MIRE (via shear stiffness) exhibited the largest differences between the most fibrotic groups (Ishak 5-6 and CPA > 6%) and the other groups. This complementary outcome is further supported by the symmetric nature of the statistically significant between-group differences
displayed in Fig. 2.4.
Specifically, we observed that ARI increased progressively with Ishak score, from 0.62 0.02
s-' for Ishak 0, 0.89 0.05 s- for Ishak 1-2, 0.97 0.05 s- for Ishak 3-4, to 1.09 0.09 s- for
Ishak 5-6. Statistically significant differences in ARI were observed between Ishak 0 and Ishak 1-2 (p < 0.05), between Ishak 0 and Ishak 3-4 (p < 0.01), and between Ishak 0 and Ishak 5-6 (p <
0.001). Shear stiffness was observed to stay nearly constant from 2023 124 Pa for Ishak 0,
2252 242 Pa for Ishak 1-2, to 2103 + 202 Pa for Ishak 3-4, until a large increase to 3894 387
Pa for Ishak 5-6. Statistically significant differences in shear stiffness were observed between Ishak 0 and Ishak 5-6 (p < 0.005), between Ishak 1-2 and Ishak 5-6 (p < 0.05), and between
Ishak 3-4 and Ishak 5-6 (p < 0.05). For the CPA groupings, we observed that ARI increased from 0.62 0.02 s for CPA < 2% to 0.94 0.03 s for CPA 2%-4%, remained approximately
constant at 0.93 0.08 s-' for CPA 4%-6%, and increased to 1.12 0.11 s- for CPA > 6%. 2 0- 1,5-1 0-0 5 00 2 0 1.5 1 0- 0.5-0 0.5-0
B
T
8000- 6000-cc LI) a) C2000-C) v N, 15' (D
T
=-t
1- 5 IS C) C) C)-r
-I-
o-
-- 8000- 6000-cc & 4000-C2) 2000-cv 5) I-~ /7Fig. 2.4. Staging of liver fibrosis by collagen-enhanced MRI and MR elastography. Collagen-enhanced MRI is
sensitive to early stages of fibrosis. AR I significantly increases for fibrotic animals compared with non-fibrotic Ishak 0 (A) and CPA < 2% (C) animal groups. MR elastography is most sensitive to advanced stages of fibrosis.
Shear stiffness significantly increases for the Ishak 5-6 (B) and CPA > 6% (D) groups compared with animals with
less advanced fibrosis. The symmetric sensitivity of these methods indicate complementary staging capabilities. * p < 0.05. ** < 0.0 1. *** p < 0.005, and **** p < 0.001.
Statistically significant differences in AR I were observed between CPA < 2% and CPA 2%-4%
(p < 0.01). between CPA <2% and CPA 4%-6% (p < 0.05), and between CPA < 2% and CPA > 6% (p < 0.00 1). Shear stiffness was observed to be 2006 it- 112 Pa for CPA < 2%. 2252 242 Pa for CPA 2%-4%, to 2103 + 202 Pa for CPA 4%-6%, until a large increase to 3894 387 Pa for
25
A
C
C), -1 C).
11
1
U) I,
19
CPA > 6%. Statistically significant differences in shear stiffness were observed between CPA <
2% and CPA > 6% (p < 0.001), between CPA 2%-4% and CPA > 6% (p < 0.005), and between
CPA 4%-6% and CPA > 6% (p < 0.05).
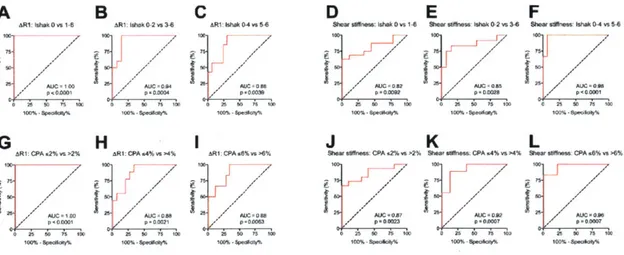
2.3.5 Fibrosis staging of ARI and shear stiffness via ROC analysis
We also evaluated the effectiveness of these techniques to stage fibrosis by receiver operating
characteristic (ROC) analysis. Using the same Ishak and CPA groups, the ROC analyses further
support the complementary notion that collagen probe imaging is most suitable for
differentiating non-fibrotic from fibrotic animals, while elastography is best for differentiating
highly-fibrotic or cirrhotic animals from those with less advanced fibrosis; the highest area under
the curve (AUC) for ARI resulted from the comparison between non-fibrotic and fibrotic groups
(Fig. 2.5A and 2.5G), and the highest AUC for shear stiffness resulted from the comparison
between the most fibrotic group and the less fibrotic (including non-fibrotic) groups (Fig. 2.5F
and 2.5L).
B
AR1 Ishak 0 2 vs 3 6 C--094I 10H
R7 CPA 4 % v1 04 p0 00217 7 a51 5 1 D0 7 100% sp .frC
R1 Ishak 0 4 15 6 '-I 01 0 00 75 I P 6 1AUC s0 8D
Shear iw hal 0 v16 '00.~
75
1
-
1J
Shea, stiffness CPA 72% 7s >2..
1 71002 75. 0 s 0A2 L 07 i5 100
E
75.I AU 0085F
Shear stiffness Ishak 0 4 v0 6
'00-75
0 p07001
K
L
Shea, sf1ness. CPA .4% .s >4'7, Shea, s7 ess CPA 6%, s >V7 S00 75 75 2 1 o AUC TA 2 C09 1./ p= 0 00v7 p=07707 500%. 5s7 0 .777y 5 .100 SOIL W075 W70'
Fig. 2.5. Receiver operating characteristic (ROC) analysis of liver fibrosis staging by collagen-enhanced MRI
and MR elastography. ROC curves are grouped by imaging technique and fibrosis metric: ARI over ishak stages (A-C) and CPA groups (G-1) and Shear stiffness over Ishak stages (D-F) and CPA groups (J-L). ROCs over both
Ishak and CPA demonstrate collagen-enhanced MRI most suitable for discriminating early stages of fibrosis (decreasing AUC with fibrotic progression) while MR elastography most suitable for discriminating late stages of
A
'R1 IshaK 0 vs1 F, R25 0 1 , AG
R! CPA ,2% s-2'1 75n 511,enfibrosis (increasing AUC with fibrotic progression) in this animal disease model.
The AUC for ARI detecting fibrosis (Ishak 0 vs 1-6) was 1.00 (95% Cl 1.00-1.00, p < 0.0001).
The AUC for distinguishing early from significant fibrosis (Ishak 0-2 from Ishak 3-6) was 0.94
0.05 (95% CI 0.83 to 1.00, p = 0.0004). Finally, the AUC for distinguishing significant to severe fibrosis (Ishak 0-4 from Ishak 5-6) was 0.88 0.07 (95% CI 0.75 to 1.00, p = 0.004). Evaluated
with CPA, the AUC for ARI detecting fibrosis (CPA < 2% vs > 2%) was 1.00 (95% Cl
1.00-1.00, p < 0.000 1). The AUC for distinguishing CPA < 4% vs > 4% was 0.88 0.07 (95% CI 0.75 to 1.00, p = 0.0021). Finally, the AUC for distinguishing CPA < 4% vs > 4% was 0.88
0.07 (95% CI 0.73 to 1.00, p = 0.0063).
By MR elastography, the AUC for shear stiffness detecting fibrosis (Ishak 0 vs 1-6) was 0.82 0.08 (95% CI 0.66-0.98, p = 0.0092). The AUC for distinguishing early from significant fibrosis
(Ishak 0-2 from Ishak 3-6) was 0.85 0.08 (95% CI 0.69 to 1.00, p = 0.0028). Finally, the AUC
for distinguishing significant to severe fibrosis (Ishak 0-4 from Ishak 5-6) was 0.98 0.02 (95%
CI 0.93 to 1.00, p < 0.0001). Evaluated with CPA, the AUC for MRE shear stiffness detecting
fibrosis (CPA < 2% vs > 2%) was 0.87 0.07 (95% CI 0.73-1.00, p < 0.0023). The AUC for
distinguishing CPA < 4% vs > 4% was 0.92 0.06 (95% CI 0.81 to 1.00, p = 0.0007). Finally,
the AUC for distinguishing CPA < 4% vs > 4% was 0.96 0.04 (95% Cl 0.89 to 1.00, p
0.0007).
2.3.6
Multivariate composite scoring improves fibrosis staging
Because these two techniques were observed to have complementary staging abilities for
detecting early (best with EP-3533 contrast agent imaging) and late stage fibrosis (best with MR elastography). we formulated a composite metric that accounted for both methods. We used
multivariate analysis of variance (MANOVA), an extended form of the generalized linear model (GLM), to form an optimal linear combination of the ARI and shear stiffness values, resulting in a single composite score that yielded the greatest separation between the Ishak groups [20] .The
MANOVA process decomposed the dataset into two canonical (or composite) variables, each of
which are linear combinations of the original ARI and shear stiffness values (Fig. 2.6A); CVI
8.02*R + 5.69*S -7.06 and CV2= -9.76*R + 3.92*S - 0.72, where CVI and CV2 are the
composite variables, R is the ARI value in sI and S is the shear stiffness in kPa, and each linear combination is each subtracted by its mean. Composite Variable I represents the linear
combination with maximum discrimination between Ishak groups, and when plotted in a conventional manner against Ishak groups (Fig. 2.6B), we observed this composite metric's ability to discriminate well between both early and late stage fibrosis.
This is further reflected by the ROC curves (Fig. 2.6C-E), which display superior AUC values
compared to that determined by the individual ARI and shear stiffness tests. The AUC for the composite score detecting fibrosis (Ishak 0 vs 1-6) was 1.00 (95% CI 1.00-1.00, p < 0.00 1). The AUC for distinguishing early from significant fibrosis (Ishak 0-2 from Ishak 3-6) was 0.96 +
0.04 (95% CI 0.88 to 1.00, p = 0.0001). Finally, the AUC for distinguishing significant to severe
-2 0 2
Composite Variable 2
C
Composite Score: Ishak 0 vs 1-6 100- 75- 50- S25-AUC = 1.00 p < 0.0 0 0 1 0 T -I. 0 25 50 75 100 100% -Specificity%
D
E
Composite Score: Ishak 0-2 vs 3-6 Composite Score: Ishak 0-4 vs 5-6
.5 0) (I) 100- 75-50-, 25- AUC = 0.96 p = 0.0001 0 0 25 50 75 100 100% - Specificity% a) CO 0-5- AUC =0.98 p = 0.0 0 02 0 25 50 75 100 100% -Specificity%
Fig. 2.6. Composite score for staging liver fibrosis incorporating collagen-enhanced imaging and MR elastography measures. (A) The ARI and shear stiffness for each animal were linearly combined, with weighting
coefficients optimized by multivariate analysis of variance (MANOVA) to achieve maximum separation between groups. The analysis generated two sets of coefficients, and the resultant linear combinations form Composite Variable I (with maximum separation) and Composite Variable 2 (with 2"d-highest separation). (B) Fibrosis staging
by composite score (Composite Variable 1) incorporates the advantages of both imaging techniques and is capable
of discriminating both early and late stages of fibrosis. (C-E) ROC curves demonstrating the composite score's ability to distinguish between fibrotic stage groups. These AUC values are the highest in comparison with those from Fig. 5. derived from the original imaging data. * p < 0.05, ** p < 0.01, and **** < 0.001.
29
A
4 CU a 0 U. 2 0 -2 0 0. 0 i L 4 6- 4- 2- 0- -2--14 + + + 0 0 0 Ishak 0 Ishak 1 -2 0 Ishak 3-4 + Ishak 5-6-r
N. '6 -- Nw.
.
.
-A ,-100-751 5 2Xr.0.* t , 0 0 0 200 400 600 Hyp (pg/g) 0 S 1 5 10 CPA(%) 15
D
3000- 5000- 4000- 3000- 2000- 1000-, e., e . r =0.53 200 400 600 800 1DOC Hyp (pg/g )
Fig. 2.7. ARI and shear stiffness measurements over CPA and hydroxyproline concentration (A) Correlation between ARI and CPA. (B) Correlation between AR I and hydroxyproline content. (C) Correlation between shear modulus and CPA. (D) Correlation between shear modulus and hydroxyproline content.
I
2.4 Discussion
In this work we show for the first time simultaneous MR imaging of collagen content and tissue stiffness to compare and contrast each technique's ability to stage liver fibrosis in DEN-treated rats. Our results for each separate technique recapitulated previous findings for staging fibrosis. We observed the same exponential-like trend for tissue stiffness over fibrotic progression that has been widely reported in previous elastography literature [22,23 .resulting in good detection
A
1.5-B
1 5-0 5 10 CPA (%) 15 0.C
3 a -3 3 E 3 :3 (I) 800 1000 60007 5000- 4000- 3000- 2000-r= .79 macfor advanced fibrosis and cirrhosis, but not for earlier stages. Our previous EP-3533 studies also demonstrated the ability for the collagen probe to be sensitive in detecting early stages of fibrosis and reported similar AUC values in ROC analysis across discrimination stages [13,14].
An important consideration for diagnostic imaging is the relationship between the imaging measurement and the true biological condition the test is attempting to probe. Although MRE is
conventionally a measurement of the elastic properties of tissue, confounds such as varying inflammation or perfusion levels (such as portal venous hypertension during cirrhosis) can influence the measurement. In fact, these are commonly cited contributors to the apparent late-stage increases in liver stiffness [24]. Similarly, molecular imaging is dependent upon
pharmacokinetics, and perfusion characteristics of the tissue also affect probe delivery, which can obscure the desired measurement of molecular concentration. The early increases in ARI we observe are likely more reflective of the early collagen deposition during mild fibrosis, whereas decreased liver perfusion during the later stages of disease would likely decrease probe delivery and thus result in a flattening of the ARI values we observe.
Because these imaging techniques measure independent biophysical properties, the negative effects of these limitations may be ameliorated by using both techniques concurrently, especially in this study of fibrosis where we observe the complementary nature of these techniques in their ability to stage fibrosis. Again, the collagen-enhanced imaging was shown most effective in distinguishing non-fibrotic and early stages, and MR elastography most effective in
distinguishing more advanced stages in this animal model.
By incorporating both measures, we generated a composite score model that was able to
the partially uncorrelated nature of the techniques. Although the specific coefficients of the model described here are tied to the exam parameters of this study (e.g. contrast agent dose, elastography frequency...), a multivariate collagen+MRE model can be instantiated for future
experimental or clinical investigations by similar staging studies to determine optimal linear weighting coefficients.
The MR elastography reconstruction method we used was based on previous work [17] demonstrating the superior precision of the phase gradient technique in quantifying the shear stiffness value for predominately homogenously distributed diseases such as liver fibrosis. Although cirrhotic nodules at advanced stages may introduce focal perturbations of shear stiffness, the cirrhotic condition is already detectable by the bulk tissue stiffness, which we are more interested in. Additionally, the stiffness values of these small nodules are typically not accurately measured by MR elastography, especially in small animals where the spatial
wavelengths of the shear waves are usually greater than the size of the nodules, because spatial frequency estimation is easily corrupted by noise in regions of interest (ROIs) with a low dynamic range of shear wave phase.
There were slight differences between this study and our previous EP-3533 staging study, with CCI4-treated mice demonstrated the ability to stage not only the non-fibrotic and mildly fibrotic stages, but also advanced fibrosis [13] . Since both this study and our previous study both had high linear correlations to hydroxyproline (r=0.85 and r--0.89, respectively), it is likely the staging discrepancy is due to differences in disease models that have differences in collagen deposition. Hydroxyproline levels were much higher in this study, and there were no Ishak 6 animals in the CCl4 study. Regardless, the ability for EP-3533 to be sensitive in detecting early stages of fibrosis is a consistent result across animal (rat vs. mouse) and disease (DEN-induced
vs CCl4-induced) models.
Prior literature reporting the direct elastic modulus measurements of fresh surgical samples of fibrotic liver corroborate our results, showing the elastic moduli at the lower fibrotic stages staying within similar ranges and only the highly fibrotic and cirrhotic livers with greater values
[25] . One of the key molecular explanations suggested by literature is that cross-linking of
collagen and elastin fibers, which has been shown to significantly increase tissue stiffness
[26-28] , occurs typically in advanced fibrotic stages after initial collagen deposition [29-31] . While elastography studies of patient populations with chronic liver diseases have typically shown similar results where insignificant stiffness differences are observed between non-fibrotic and mild fibrosis [22,23,32,33], some recent studies, primarily small animal injury models with
CCI4, have observed early-stage stiffness increases [10,24,34] even before fibrotic
overproduction of collagen due to the cross-linking activity of lysyl oxidase. As many molecular mechanisms across varying models of fibrosis are still unresolved and under active investigation, one feature becoming increasingly apparent is that collagen production and the cross-linking that increases tissue stiffness have partially correlated but separate timelines that contribute
differently to fibrotic progression. Therefore, we submit that imaging probes targeting collagen can provide useful information complementary to that of MR elastography toward the common goal of fibrosis staging, and models that incorporate both metrics can be advantageous in clinical and research settings.
Bibliography
[1] R. Williams, Global challenges in liver disease, Hepatology. 44 (2006) 521-526.
[2] Iredale, John P. "Models of liver fibrosis: exploring the dynamic nature of inflammation and repair in a solid organ." Journal of Clinical Investigation1 17.3 (2007): 539.
[3] SL Murphy, J Xu. KD Kochanek, Deaths: preliminary data for 2010., National Vital
Statistics Reports: (2012) http://www.cdc.gov/nchs/products/nvsr.htm.
[4] Manning, Afdhal, Diagnosis and quantitation of fibrosis, Gastroenterology. 134:1670 -1681 (2008).
[5] V Ratziu, F Charlotte, A Heurtier, S Gombert, P Giral, Sampling variability of liver biopsy in nonalcoholic fatty liver disease, Gastroenterology. 128:1898 -1906 (2005).
[6] Myers, Robert P., Andrew Fong, and Abdel Aziz M. Shaheen. "Utilization rates, complications and costs of percutaneous liver biopsy: a population-based study including 4275
biopsies." Liver International 28.5 (2008): 705-712.
[7] Afdhal, Nezam H., and David Nunes. "Evaluation of liver fibrosis: a concise review." The American journal ofgastroenterology 99.6 (2004): 1160-1174.
[8] F. Vizzutti, U. Arena, R.G. Romanelli, L. Rega, M. Foschi, S. Colagrande, et al., Liver stiffness measurement predicts severe portal hypertension in patients with HCV related cirrhosis,
Hepatology. 45 (2007) 1290-1297.
[9] M. Nakasaki, Y. Hwang, Y. Xie, S. Kataria, R. Gund, E. Hajam, et al., The matrix protein Fibulin-5 is at the interface of tissue stiffness and inflammation in fibrosis, Nat Commun.
6(2015).
[10] Perepelyuk, Maryna, et al. "Hepatic stellate cells and portal fibroblasts are the major cellular sources of collagens and lysyl oxidases in normal liver and early after injury." American
Journal of Physiology-GastrointestinaI and Liver Piysiology 304.6 (2013): G605-G614.
[11] P. Caravan, B. Das, S. Dumas, F.H. Epstein, P.A. Helm, V. Jacques, et al., Collagen-Targeted MRI Contrast Agent for Molecular Imaging of Fibrosis, Angew Chem-Ger Edit. 119
(2007).
[12] M. Polasek, B. Fuchs, R. Uppal, D. Schfihle, J. Alford, G. Loving, et al., Molecular MR
imaging of liver fibrosis: A feasibility study using rat and mouse models, J Hepatol. 57 (2012).
[13] B.C. Fuchs, H. Wang, Y. Yang, L. Wei, M. Polasek, D.T. Schtihle, et al., Molecular MRI
[14] Farrar, Christian T., Danielle K. DePeralta, Helen Day, Tyson A. Rietz, Lan Wei, Gregory Y. Lauwers, Boris Keil et al. "3D molecular MR imaging of liver fibrosis and response to rapamycin therapy in a bile duct ligation rat model."Journal of Hepatology (2015).
[15] Caravan, Peter, Yan Yang, Roshini Zachariah, Anthony Schmitt, Mari Mino-Kenudson, Howard H. Chen, David E. Sosnovik, Guangping Dai, Bryan C. Fuchs, and Michael Lanuti. "Molecular magnetic resonance imaging of pulmonary fibrosis in mice." American journal of
respiratory cell and molecular biology 49, no. 6 (2013): 1120-1126.
[16] Helm, Patrick A., Peter Caravan, Brent A. French, Vincent Jacques, Luhua Shen, Yaqin Xu, Ronald J. Beyers, R. Jack Roy, Christopher M. Kramer, and Frederick H. Epstein.
"Postinfarction Myocardial Scarring in Mice: Molecular MR Imaging with Use of a
Collagen-targeting Contrast Agent 1." Radiology247, no. 3 (2008): 788-796.
[17] M. Yin, J. Woollard, X. Wang, V. Torres, P. Harris, C. Ward, et al., Quantitative assessment of hepatic fibrosis in an animal model with magnetic resonance elastography, Magn.
Reson. Med. 58 (2007) 346-353.
[18] Gilpin, D. A. "Calculation of a new Meeh constant and experimental determination of
bum size." Burns 22, no. 8 (1996): 607-611.
[19] Gouma, Simos, Verginadis, Lykoudis, Evangelou, Karkabounas, A simple procedure for estimation of total body surface area and determination of a new value of Meeh's constant in
rats, Lab Anim-Uk. 46 (2012).
[20] Anderson, M.J., 2001. A new method for non-parametric multivariate analysis of variance. Austral ecology, 26(1), pp.3 2-4 6.
[21] Hutson, Paul R., Mark E. Crawford, and Ronald L. Sorkness. "Liquid chromatographic determination of hydroxyproline in tissue samples." Journal of Chromatography B 791, no. 1
(2003): 427-430.
[22] Sandrin, L., Fourquet, B., Hasquenoph, J.M., Yon, S., Fournier, C., Mal, F., Christidis, C., Ziol, M., Poulet, B., Kazemi, F. and Beaugrand, M., 2003. Transient elastography: a new
noninvasive method for assessment of hepatic fibrosis. Ultrasound in medicine &
biology, 29(12), pp.1 7 0 5-1 7 1 3.
[23] Ziol, Marianne, Adriana Handra-Luca, Adrien Kettaneh, Christos Christidis, Freddric Mal, Farhad Kazemi, Victor de L6dinghen et al. "Noninvasive assessment of liver fibrosis by measurement of stiffness in patients with chronic hepatitis C." Hepatology 41, no. 1 (2005):
48-54.
[24] N. Salameh, B. Larrat, J. Abarca-Quinones, S. Pallu, M. Dorvillius, I. Leclercq, et al.,
Early detection of steatohepatitis in fatty rat liver by using MR elastography., Radiology. 253
[25] Yeh, Wen-Chun, Pai-Chi Li, Yung-Ming Jeng, Hey-Chi Hsu, Po-Ling Kuo, Meng-Lin
Li, Pei-Ming Yang, and Po Huang Lee. "Elastic modulus measurements of human liver and correlation with pathology." Ultrasound in medicine & biology 28, no. 4 (2002): 467-474.
[26] Marturano, Joseph E., Joanna F. Xylas, Gautham V. Sridharan, Irene Georgakoudi, and Catherine K. Kuo. "Lysyl oxidase-mediated collagen crosslinks may be assessed as markers of functional properties of tendon tissue formation." Acta biomaterialia 10, no. 3 (2014):
1370-1379.
[27] Lau, Ying-Ka Ingar, Andre M. Gobin, and Jennifer L. West. "Overexpression of lysyl oxidase to increase matrix crosslinking and improve tissue strength in dermal wound
healing." Annals of biomedical engineering 34, no. 8 (2006): 1239-1246.
[28] Elbjeirami, Wafa M., Edward 0. Yonter, Barry C. Starcher, and Jennifer L. West. "Enhancing mechanical properties of tissue-engineered constructs via lysyl oxidase crosslinking activity." Journal ofBiomedical Materials Research Part A 66, no. 3 (2003): 513-521.
[29] Friedman, Scott L. "Mechanisms of hepatic fibrogenesis." Gastroenterologyl 34, no. 6
(2008): 1655-1669.
[30] Schuppan, Detlef, and Yong Ook Kim. "Evolving therapies for liver fibrosis."The
Journal of clinical investigation 123, no. 123 (5) (2013): 1887-1901.
[31] Tzortzaki, Eleni G., Jay A. Tischfield, Amrik Sahota, Nikolaos M. Siafakas, Marion K.
Gordon, and Donald R. Gerecke. "Expression of FACIT collagens XII and XIV during
bleomycin-induced pulmonary fibrosis in mice." The Anatomical Record Part A: Discoveries in
Molecular, Cellular, and Evolutionary Biology 275. no. 2 (2003): 1073-1080.
[32] Takahashi, Hirokazu, Naofumi Ono, Yuichiro Eguchi, Takahisa Eguchi, Yoichiro
Kitajima, Yasunori Kawaguchi, Shunya Nakashita et al. "Evaluation of acoustic radiation force impulse elastography for fibrosis staging of chronic liver disease: a pilot study." Liver
international 30, no. 4 (2010): 538-545.
[33] Sporea, loan, Roxana $irli, Alina Popescu, Simona Bota, Radu Badea, Monica Lupgor, Mircea Focya, and Mirela DanilA. "Is it better to use two elastographic methods for liver fibrosis assessment?." Worldjournal ofgastroenterology:
WJG
17, no. 33 (2011): 3824.[34] Georges, Penelope C., Jia-Ji Hui, Zoltan Gombos, Margaret E. McCormick, Andrew Y. Wang, Masayuki Uemura, Rosemarie Mick, Paul A. Janmey, Emma E. Furth, and Rebecca G. Wells. "Increased stiffness of the rat liver precedes matrix deposition: implications for
fibrosis." American Journal of Phiiology-GastrointestinaI and Liver Physiology 293, no. 6