HAL Id: hal-03137658
https://hal.archives-ouvertes.fr/hal-03137658
Submitted on 10 Feb 2021HAL is a multi-disciplinary open access archive for the deposit and dissemination of sci-entific research documents, whether they are pub-lished or not. The documents may come from teaching and research institutions in France or abroad, or from public or private research centers.
L’archive ouverte pluridisciplinaire HAL, est destinée au dépôt et à la diffusion de documents scientifiques de niveau recherche, publiés ou non, émanant des établissements d’enseignement et de recherche français ou étrangers, des laboratoires publics ou privés.
Sugar landscapes and pollinator-mediated interactions in
plant communities
Henning Nottebrock, Baptiste Schmid, Katharina Mayer, Céline Devaux,
Karen J. Esler, Katrin Böhning-Gaese, Matthias Schleuning, Jörn Pagel,
Frank M. Schurr
To cite this version:
Henning Nottebrock, Baptiste Schmid, Katharina Mayer, Céline Devaux, Karen J. Esler, et al.. Sugar landscapes and pollinator-mediated interactions in plant communities. Ecography, 2017, 40 (9), pp.1129-1138. �10.1111/ecog.02441�. �hal-03137658�
Energetic principles are critical to pollinator-mediated interactions (Heinrich and Raven 1972, Heinrich 1975, Tomlinson et al. 2014): pollinators take up energy resources provided by flowering plants (notably as nectar sugar) and partly use it for foraging movements that define their pollination services. Consequently, spatial variation in the floral resource landscape provided by a plant community should translate into spatial variation in pollinator foraging behaviour and pollinator-mediated interactions (Ghazoul 2005; Fig. 1a). Pollinator-mediated interactions also depend on flowering phenology because pollinators track temporal changes in resource landscapes (Hegland et al. 2009; Fig. 1a). Despite these simple principles, pollinator-mediated interac-tions among plant species can be complex. This complexity arises from spatial and temporal variation in floral resources and from the partitioning of these resources among plant species and individual inflorescences (Fig. 1). Pollinators can mediate interactions among plants at several spatial Ecography 40: 1129–1138, 2017
doi: 10.1111/ecog.02441 © 2016 The Authors. Ecography © 2016 Nordic Society Oikos Subject Editor: Paulo Guimaraes Jr. Editor-in-Chief: Miguel Araújo. Accepted 7 August 2016
Pollinators mediate indirect interactions between conspe-cific and heterospeconspe-cific plants, thereby shaping the dynamics of plant communities (Ghazoul 2005, Sargent and Ackerly 2008, Pauw 2013). Within plant species, pollinator-mediated interactions can be positive when neighbouring plants attract pollinators and increase their visitation rates, or negative when plants compete for shared pollinators (Rathcke 1983, Ghazoul 2005). Between plant species, generalist pollinators can also mediate both competitive and facilitative interac-tions (Moeller 2004, Sargent and Ackerly 2008, Mitchell et al. 2009). These interspecific interactions depend on the foraging behaviour of pollinators in multi-species plants communities, and on whether interspecific pollen transfer reduces plant reproductive success (Waser 1978). The relative strength of intra- and interspecific competition mediated by pollinators determines whether pollinators promote or hinder coexistence of plant species that depend on animal pollination (Pauw 2013).
Sugar landscapes and pollinator-mediated interactions in plant
communities
Henning Nottebrock, Baptiste Schmid, Katharina Mayer, Céline Devaux, Karen J. Esler, Katrin Böhning-Gaese, Matthias Schleuning, Jörn Pagel and Frank M. Schurr
H. Nottebrock ([email protected]), J. Pagel and F. M. Schurr, Inst. of Landscape and Plant Ecology, Univ. of Hohenheim, Stuttgart, Germany. – B. Schmid, K. Böhning-Gaese and M. Schleuning, Senckenberg Biodiversity and Climate Research Centre (BiK-F), Frankfurt am Main, Germany. KB-G also at: Goethe Univ. Frankfurt, Inst. for Ecology, Evolution and Diversity, Frankfurt (Main), Germany. – K. Mayer, K. J. Esler, HN and BS, Dept of Conservation Biology and Entomology and Centre for Invasion Biology, Stellenbosch Univ., Matieland, South Africa. – C. Devaux, HN, JP and FMS, Inst. des Sciences de l’Evolution, UMR 5554, Univ. Montpellier 2, Montpellier, France.
Pollinator-mediated interactions between plants can play an important role for the dynamics of plant communities. Pollination services depend on the abundance and the foraging behaviour of pollinators, which in turn respond to the availability and distribution of floral resources (notably nectar sugar). However, it is still insufficiently understood how the ‘sugar landscapes’ provided by flowering plant communities shape pollinator-mediated interactions between multiple plant species and across different spatial scales. A better understanding of pollinator-mediated interactions requires an integrative approach that quantifies different aspects of sugar landscapes and investigates their relative importance for pollinator behaviour and plant reproductive success. In this study, we quantified such sugar landscapes from individual-based maps of Protea shrub communities in the Cape Floristic Region, South Africa. The 27 study sites of 4 ha each jointly comprise 127 993 individuals of 19 species. We analysed how rates of visitation by key bird pollinators and the seed set of plants respond to different aspects of sugar landscapes: the distribution of nectar sugar amounts, as well as their quality, taxonomic purity and phenology. We found that pollinator visitation rates strongly depended on phenological variation of site-scale sugar amounts. The seed set of focal plants increased with nectar sugar amounts of conspecific neighbours and with site-scale sugar amounts. Seed set increased particularly strongly if site-scale sugar amounts were provided by plants that offer less sugar per inflorescence. These combined effects of the amount, quality, purity and phenological variation of nectar sugar show that nectar sugar is a common interaction currency that determines how multiple plant species interact via shared pollinators. The responses of pollinator-mediated interactions to different aspects of this interaction currency alter conditions for species coexistence in Protea communities and may cause community-level Allee effects that promote extinction cascades.
and temporal scales. Their small-scale foraging behaviour affects interactions among inflorescences on the same plant (Goulson 2000, Devaux et al. 2014) whereas foraging move-ments determine interactions and pollen transfer among neighbouring plants (Seifan et al. 2014). At large spatial scales, pollinator abundance and pollination service respond to the quantity of floral resources within the community (Williams et al. 2012, Nottebrock et al. 2013, Schmid et al. 2015b). The sign of pollinator-mediated interactions can change with spatial scale: for instance, plants may benefit from pollinator attraction by close neighbours, but suffer from competition for pollination over large scales (Gunton and Kunin 2009). Overall, the intensity of pollinator-mediated interactions between two individual plants should decrease with the spatial and temporal distance between them (Heinrich and Raven 1972, Elzinga et al. 2007, Devaux and Lande 2009, Fig. 1a). Yet, even plants that do not flower simultaneously may interact via pollinators: early-flowering species can contribute to high pollinator densities that benefit late-flowering species (Riedinger et al. 2014).
In behavioural ecology, it is well established that the quality of resource patches affects foraging decisions of animals. For a foraging pollinator, an inflorescence repre-sents a food patch; the quality of which can be defined as the amount of floral resources available in a single visit (Pyke 1978). Hence, plant–pollinator interactions should not only depend on total resource amounts, but also on whether these resources are split into a few high-quality inflorescences or into many low-quality inflorescences (Fig. 1b). Optimal foraging theory predicts that pollinators should respond to differences between the quality of a focal inflorescence and the quality of surrounding inflorescences: pollinators
should prefer high-quality inflorescences over low-quality inflorescences (MacArthur and Pianka 1966) and they should spend more time visiting high-quality inflorescences (Charnov 1976, Pyke 1978). High-quality inflorescences can thus reduce the reproductive success of surrounding plants with low-quality inflorescences by reducing visita-tion of shared pollinators (Kandori et al. 2009). Conversely, high-quality inflorescences could attract shared pollinators, which then pollinate neighbouring plants with low-quality inflorescences (Seifan et al. 2014). The net outcome of these opposite effects of high-quality inflorescences on their surroundings remains unclear. Moreover, it is not obvious how quality differences between a focal inflorescence and other inflorescences should be evaluated, because the set of available inflorescences depends on the spatial scale at which pollinators take their foraging decision, which is generally poorly known (Ghazoul 2005).
Pollinator-mediated interactions between a focal plant and the surrounding floral resource landscape can also be affected by the taxonomic ‘purity’ of floral resources, defined as the proportion of floral resources contributed by conspe-cifics (Fig. 1c, Ghazoul 2005). Positive effects of purity on pollinator efficiency and plant reproductive success result from increased intraspecific pollen transfer and reduced stigma clogging by incompatible heterospecific pollen (Waser 1978, Shore and Barrett 1984). Purity may also increase reproductive success via positive effects on pollinator visita-tion (Ghazoul 2005) because pollinators preferentially visit common plant species or because they sequentially visit inflorescences of the same species (Chittka and Thomson 2001). Conversely, purity can reduce plant reproductive success if competition for pollinators is more intense among
Figure 1. A conceptual framework for studying effects of floral resource landscapes on pollinator-mediated interactions among plants. (a) Effects of spatial and phenological variation in floral resource amounts: the strength of pollinator-mediated interactions experienced by a focal inflorescence depends on the resource amount, spatial and phenological proximity of other inflorescences (interaction strength indicated by line widths). (b) Effects of inflorescence quality: pollinator-mediated interactions depend on whether a given floral resource amount is split into a few high-quality inflorescences or into many low-quality inflorescences. In the example figures, the central inflores-cence is surrounded by infloresinflores-cences of equal quality (left) or lower quality (right). (c) Effects of floral resource purity: pollinator-mediated interactions depend on the proportion of conspecific floral resources. The example figures show cases of high purity (left) and low purity (right).
conspecifics than among heterospecifics (Pauw 2013). Heterospecifics can increase pollinator visitation if different plant species with temporally staggered flowering phenolo-gies facilitate each other by maintaining high pollinator den-sities (Riedinger et al. 2014). Hence, the taxonomic purity of floral resources can have either positive or negative effects on plant reproductive success and the balance between these effects likely varies with the spatial and temporal scales at which floral resource purity is considered.
The spatial distribution, phenology, quality and purity of floral resource landscapes are thus expected to strongly influence pollinator-mediated interactions among plants. Previous studies considered these aspects individually and showed their relevance for plant–pollinator interac-tions. However, some results of these previous studies seem conflicting (Kunin 1997, Ghazoul 2005, Gunton and Kunin 2009, Williams et al. 2012, Carvalheiro et al. 2014, Feldman and McGill 2014). We argue that progress in understanding the effects of floral resources on pollina-tion requires an integrative approach that jointly quantifies the different aspects of floral resource landscapes and analy-ses their relative contribution for pollinator behaviour and plant reproductive success (Fig. 1). Here, we develop such an approach and apply it to 27 plant communities from the Cape Floristic Region, a global biodiversity hotspot (Myers et al. 2000). We construct high-resolution resource landscapes of the nectar sugar provided by these plant com-munities in order to quantify how sugar landscapes vary in space, time, quality and purity. We use these sugar land-scapes to 1) determine the relevance of these aspects of sugar landscapes for pollinator visitation and plant seed set and 2) infer whether these effects result in pollinator-mediated competition or facilitation.
Material and methods
Study system and study designWe studied shrub communities dominated by the species-rich genus Protea that has high ecological and economic importance in the Fynbos biome (Schurr et al. 2012) and is well suited for studying plant–pollinator interactions. Protea species frequently dominate the overstorey of Fynbos shru-blands (Collins and Rebelo 1987). Two other plant genera (Leucospermum and Erica) are important nectar sources for animal pollinators in the study region. However, both gen-era rarely co-flower with Protea (Collins and Rebelo 1987, Schmid et al. 2015b). Moreover, Leucospermum only occurs at few of our study sites and Erica produces less nectar per inflorescence and stand than Protea (Turner et al. 2011, Heystek et al. 2014).
Inflorescences of Protea bear many individual florets, each of which contains a single ovule and thus produces a single seed (Rebelo 2001), and provide copious amounts of nectar accumulated at the base of the inflorescence. A pollinator exclusion experiment with seven of the studied Protea species showed that the capacity for autonomous selfing is either absent or very low so that seed set largely depends on ani-mal pollination (Schmid et al. 2015a). Many Protea species depend on pollination by nectarivorous birds that are the
most important pollinators of Protea (Collins and Rebelo 1987, Schmid et al. 2015a). In particular, Cape sugarbirds
Promerops cafer and orange-breasted sunbirds Anthobaphes violacea account for more than 85% of bird pollinator visits
(Schmid et al. 2015b). Both bird species in turn strongly depend on floral nectar and their abundance increases with the amount of Protea nectar sugar per hectare (Schmid et al. 2015b). Since Protea inflorescences (referred to as cones after flowering) are the functional unit of plant–pollinator interactions in our study, we measured standing nectar sugar crops, pollinator visitation and seed set at the level of inflorescences.
Protea meta-communities have a high beta-diversity,
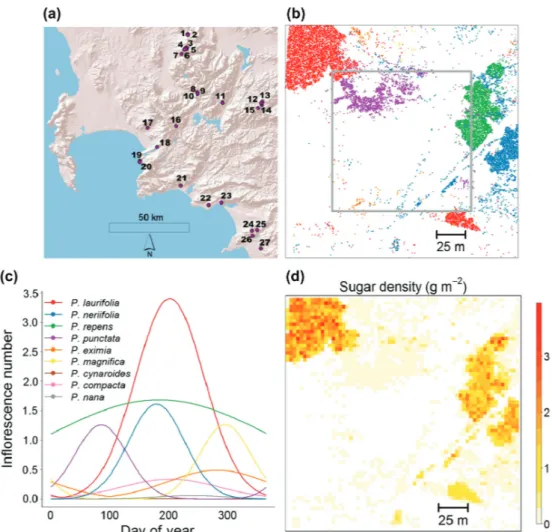
which allowed us to select 27 study sites that varied in species composition and density but show little within-site variation in topography and soil conditions (Fig. 2a, Schmid et al. 2015b). Each site consisted of a 200 200 m plot with a core zone of 120 120 m surrounded by a 40 m wide buffer zone, in total 40 000 m² (Fig. 2b). Plots are thus larger than the actively defended territories of sugarbirds (mean territory size vary from 207 to 25 880 m², Calf et al. 2003). To analyse the effects of sugar landscapes on pollinator-mediated interactions at these sites, we 1) generated fine-scale maps of all overstorey Protea individuals, 2) quantified sugar amount per inflorescence and phenological variation in the number of flowering inflorescences to predict sugar land-scapes (Fig. 2d), 3) measured both visitation rates of key bird pollinators and seed set at the inflorescence level for a subset of plants, and 4) analysed how pollinator visitation and seed set are shaped by sugar amounts at the plant, neighbourhood and site scales, and by the phenology, quality and purity of these sugar amounts. Note that the predicted sugar amounts were already used in Schmid et al. (2015b) to analyse bird abundance and behaviour. However, in the following and in Supplementary material Appendix 1 we provide details on how the sugar landscapes were quantified, and report how nectar sugar is distributed in space and across plant species, inflorescences and flowering phenologies.
Fine-scale mapping
We mapped all overstorey Protea plants on the study sites using differential GPS (Trimble GeoXH; median accuracy 20 cm) and recorded their size (canopy height) and species identity. For details see Schmid et al. (2015b). In total, the fine-scale maps comprise 127 993 individuals of 19 Protea species, with 318 to 48 602 individuals per species, 83 to 37 253 individuals per site, and 3 to 9 species per site.
Trait-based prediction of sugar landscapes
We monitored individual flowering phenologies for a subsample of 6943 plants (51 to 1245 plants per species) by counting flowering inflorescences at up to three visits during the flowering seasons in 2011 (March to December) or 2012 (March to August, Schmid et al. 2015b). For a subsample of 850 plants in the core zones (4 to 80 plants per species; average 45 plants per species), we harvested two inflorescences, measured their size and the proportion
From these spatially explicit predictions, we derived sugar amount, purity and inflorescence quality at the neighbour-hood and site scales. At the neighbourneighbour-hood scale (within 40 m radius around each focal plant), we calculated sugar amounts using a neighbourhood index that accounts for the decline of neighbour effects with distance d from the focal plant (Uriarte et al. 2010): we summed the sugar amounts of all neighbours within 40 m weighted by 1/(1 d). At the site scale, we calculated the total sugar amount of all plants on the site (in g ha–1). Purity was calculated as the proportion of the sugar amount at the respective scale that is contributed by conspecifics of the focal plant. As a relative measure of inflorescence quality at the neighbourhood and site scale, we subtracted the focal plant’s sugar per inflorescence from the mean sugar per inflorescence at the respective scale.
Phenology was treated differently when characterizing sugar landscapes for analyses of pollinator visits and seed set (see below). For pollinator visits, we considered sugar landscapes at the respective day of observation. In contrast, seed set integrates over the entire flowering period of an inflorescence, thus seed set analyses included temporally averaged nectar sugar variables that were weighted by the of open florets, and extracted their nectar by centrifugation
(Armstrong and Paton 1990). We measured nectar volume with microsyringes (0.05 ml precision) and nectar concen-tration with a hand refractometer (Bellingham and Stanley, reading range: 0–50 Brix). Nectar concentration in Brix was then converted into grams of sugar per litre and multiplied by nectar volume to obtain sugar amount per inflorescence.
To predict sugar landscapes, we fitted trait-based models of sugar amount per inflorescence and number of inflores-cences per plant. As predictors for these trait-based models, we measured inflorescence size, cone mass, specific leaf area (SLA), and trunk length from the ground to the first branch for a subsample of 2580 plants in the core zone (25 to 502 plants per species). Additionally, the models included resprouting ability as a species-level trait (Rebelo 2001). The model for inflorescence number also included a date-derived covariate to describe species-specific flowering phenologies. With these trait-based models we then pre-dicted phenological variation in inflorescence number, sugar amount per inflorescence and their product, i.e. sugar amount per plant, for all 127 993 mapped plants (for details see Supplementary material Appendix 1).
Figure 2. Quantifying the spatiotemporal dynamics of sugar landscapes. (a) Location of 27 study sites in the Fynbos biome, South Africa (area extending from Bainskloof Pass (33°63′S, 18°83′E) to Gansbaai (34°61′S, 19°52′E)). (b) Map of 16 948 shrub individuals on study site 4 with colours indicating different Protea species (see legend in (c)). (c) Flowering phenologies of the nine Protea species on this site (shown as the number of flowering inflorescences of a median-sized plant). (d) Spatial distribution of nectar sugar on the site predicted for a given day (4 July). For a dynamic version of this figure see Supplementary material Appendix 1, Video A1.
the neighbourhood and site scale, we included interactions of purity and quality with sugar amounts at the respective scale. We did not include main effects of purity and quality since purity and quality are irrelevant when sugar amounts are zero. To facilitate the interpretation of purity effects, we used impurity (1-purity), which is zero for a purely con-specific neighbourhood. Hence, the main effects of sugar amounts describe effects of ‘pure’ sugar landscapes in which all sugar is provided by conspecifics. The statistical inter-action between impurity and sugar amount describes how the effect of sugar amount changes if this sugar is provided by heterospecific rather than conspecific plants. By adding this impurity-interaction effect to the main effect of sugar amount, one thus obtains the effect of sugar provided exclu-sively by heterospecifics with the same inflorescence quality. By further adding the quality-interaction effect one obtains the effect of sugar provided by heterospecifics with higher inflorescence quality.
Analyses of both pollinator visitation and seed set corrected for focal plant size and the seed set analysis addi-tionally controlled for direct plant–plant interactions (such as competition for nutrients) by including the density of con- and heterospecific neighbours (using again the 1/(1 d) distance-weighting index). Lastly, we accounted for variation in space, time and among species: for pollinator visits we included random effects of plant species and observation ses-sion (which encompasses site and day effects) and for seed set we included random effects of plant species and site.
To quantify the relevance of different aspects of sugar landscapes for pollinator visitation and seed set, we calcu-lated the AIC difference between the full models (see above) and control models (Supplementary material Appendix 1) without the respective aspect. Control models for different spatial scales were obtained by dropping all sugar variables at the respective scale, whereas control models for purity and inflorescence quality omitted the respective interac-tion terms. In the control model for phenology, we replaced all phenology-weighted sugar variables by their respective annual mean.
Finally, we examined the relationship between seed set (response variable) and pollinator visitation (explanatory variable) for the 279 plants for which both data were avail-able. We used a binomial GLMM with a fixed effect of visitation per inflorescence and random effects of species identity and site. Note that pollinator observations were conducted on single dates within the flowering season, but not necessarily at the plant’s peak flowering time. Pollinator visitation rates that were observed close to a plant’s peak flowering time can be expected to be more representative for the entire flowering period and thus more closely related to seed set than visitation rates observed towards the lim-its of the plant’s flowering period. We therefore weighted each data point by exp((–Δt²)/s), where Δt is the time dif-ference between the pollinator observation and the plant’s peak flowering time and s is the standard deviation of the plant’s flowering phenology (Supplementary material Appendix 1).
Data available from the BiK-F Repository: < http://
dataportal-senckenberg.de/database/metacat/bikf.10036.1/ bikf > (Nottebrock et al. 2016a).
phenology of the focal plant (Supplementary material Appendix 1).
Pollinator observations and seed set measurements Pollinator visitation and seed set were measured on focal plants located within the core zones of the study sites. These focal plants were selected to fully cover the existing varia-tion in the density and species composivaria-tion of neighbour-hoods. Moreover, we aimed to balance sampling effort by sampling disproportionally many focal plants of rare species and on low-density sites. On up to three visits per site we counted inflorescence visits by nectarivorous Cape sugarbirds
Promerops cafer and orange-breasted sunbirds Anthobaphes violacea. We recorded the number of inflorescences probed
by birds and the total number of visible inflorescences for 1333 plants (1 to 346 plants per species and 8 to 66 indi-viduals per site) during 45 min sessions in the morning. In the analysis, we only considered legitimate pollinator visits, in which birds had contact with stigmas and thus potentially transferred pollen. For further details on bird observations see Schmid et al. 2015b.
Seed set was measured for 1717 plants (22 to 378 plants per species and 9 to 141 individuals per site) by counting the number of fertile seeds (Wfertile) in up to five randomly harvested mature cones (Nottebrock et al. 2013). The seeds were cross-cut and then probed with a needle to identify fertile seeds containing a soft endosperm. Pre-dispersal seed predation rate was estimated as the proportion of the cross-sectional cone area consumed by predators. The total num-ber of ovules per plant that could potentially set seed (i.e. potential seeds) was calculated as Wpotential (1 – pp) AC/AS, where pp is the estimated predation rate, AC and AS are the cross-sectional areas of cones and seeds (AC was measured for each cone, AS was determined as the mean of up to 50 seeds per population).
Analysing effects of sugar landscapes on pollinator-mediated interactions
To analyse how pollinator visits and seed set respond to dif-ferent aspects of sugar landscapes, we used generalised linear mixed models (GLMMs, package lme4, Bates et al. 2014 in R 3.1.1, R Core Team). We used Poisson errors for the number of pollinator visitations and binomial errors for seed set expressed as the ratio of fertile seeds to potential seeds (Wfertile/Wpotential). The model for pollinator visitation controlled for the number of inflorescences per plant that were visible to the observer (included as an offset) in order to describe pollinator visitation rate per inflorescence. These per-inflorescence visitation rates are expected to be more directly related to seed set than the per-plant visitation rates analysed in Schmid et al. (2015b).
As explanatory variables, the models for both response variables included measures of floral resources at three spa-tial scales: the number of inflorescences and sugar per inflo-rescence at the focal plant scale, and sugar amount at the neighbourhood and site scales. To describe how purity and inflorescence quality modify the effects of sugar amount at
Effects of sugar landscapes on pollinator visits and seed set
The spatial structure, quality, purity and phenology of sugar landscapes influenced pollinator visitation and seed set differently (Fig. 3). For pollinator visitation, the relevance of sugar variables increased from the plant over the neighbour-hood to the site scale (Fig. 3a). Visitation rates depended strongly on the phenology of nectar sugar, and to a lesser extent on nectar quality, and to an even lesser extent on purity of the sugar landscape (Fig. 3a). In contrast, seed set was impacted on all scales, but was mostly driven by sugar variables at the neighbourhood scale (Fig. 3b). Moreover, seed set was strongly affected by the purity of sugar landscapes, whereas inflorescence quality had intermediate relevance and phenology had relatively minor relevance for seed set (Fig. 3b).
Significant effects of sugar landscapes on pollinator visitation were found only at the neighbourhood and site scales, but effects varied with inflorescence quality (Fig. 4a). Pollinator visitation increased with sugar amount at the neighbourhood scale if neighbouring inflorescences pro-vided more sugar than the focal inflorescence (positive quality-sugar-amount interaction, likelihood-ratio test, c2
1 df 4.33, p 0.05, Fig. 4a). Site-scale sugar amounts had a strong negative effect on pollinator visitation, which was particularly pronounced if site-scale sugar amounts were composed of higher-quality inflorescences (negative quality-sugar-amount interaction, c2
1 df 6.93, p 0.01, Fig. 4a). In contrast, the purity of the sugar landscape did not alter the effect of sugar amount on pollinator visitation at either scale (p 0.05).
Results
Spatiotemporal variation of sugar landscapes
Trait-based models of flowering phenology and sugar amount per inflorescence quantify the spatiotemporal dynamics of sugar landscapes in the 27 study communities (Fig. 2, Supplementary material Appendix 1, Video A1). At the plant scale, sugar per inflorescence varied between 0.01 and 1.94 g (mean: 0.56 g, SD: 0.69), and the annual maximum of the number of co-flowering inflorescences per focal plant ranged from 0 and 44 (mean: 0.82, SD: 1.77). The 19 study species showed considerable differ-ences in flowering phenology: their peak flowering time varied from March to October and they ranged from sea-sonally-restricted to flowering across almost the entire year (Fig. 2c, Supplementary material Appendix 1, Table A1). We calculated the average sugar landscape experienced by a flowering inflorescence by integrating sugar amounts and inflorescence numbers over these flowering phenologies (Supplementary material Appendix 1). At the site scale, this phenology-integrated sugar amount was on aver-age 388.9 g ha–1 (95% interquantile range: 11.1–1414.9 g ha–1) with a mean purity of 52% (0–99%). The mean sugar amount of co-flowering inflorescences from the same site differed from an inflorescence’s own sugar amount by an average quality difference of 0.008 g (–0.7– 0.8 g). The summed sugar amount in the neighbourhood of flowering inflorescences (weighted by 1/( 1 d)) was on average 18.3 g (0.4–103.3 g) with a mean purity of 63% (0–100%) and a mean nectar quality difference of –0.003 g (–0.6– 0.7 g).
Figure 3. Relevance of different aspects of sugar landscapes for (a) pollinator visitation per inflorescence and (b) seed set per inflorescence. The left panels show the relevance of sugar variables at three spatial scales, the right panels show the relevance of inflorescence quality, purity and phenology. The relevance of a given aspect of sugar landscapes is measured as the AIC difference difference between a control model without the respective aspect and the full model (a positive value indicates better performance of the full model).
consistently negative. The negative intraspecific density dependence of seed set was stronger than the negative inter-specific density dependence (replacing con- and heterospe-cific density by their sum yielded c2
1 df 57.8, p 0.001). This negative effect of conspecific density was almost exactly compensated by the positive effect of conspecific sugar amounts (standardized regression coefficients for conspecific density and sugar amount were –0.33 and 0.33, respec-tively, Fig. 4b). At the site scale, we found a strong positive effect of sugar amounts, which was stronger if site-scale sugar was provided by heterospecific plants rather than conspecifics (positive impurity-sugar-amount interaction, c2
1 df 100.3, p 0.001) and by lower-quality inflorescences (negative quality-sugar-amount interaction, c2
1 df 165.4, p 0.001, Fig. 4b).
Finally, we found a positive relationship between pol-linator visitation and seed set for the 279 focal plants on which both variables were measured. The seed set of these Seed set showed significant responses to all aspects of
sugar landscapes at all spatial scales (Fig. 4b). At the plant scale, seed set increased with sugar amount per inflores-cence (c2
1 df 22.6, p 0.001, Fig. 4b) and decreased with the number of inflorescences on the focal plant (c2
1 df 96.7, p 0.001, Fig. 4b). At the neighbourhood scale, seed set increased with conspecific sugar amounts (posi-tive main effect of neighbour sugar amount), but slightly decreased with entirely heterospecific sugar amounts (since the positive main effect of neighbour sugar amount was outweighed by the negative impurity-sugar-amount interac-tion, c2
1 df 262.0, p 0.001, Fig. 4b). This negative effect was particularly pronounced if neighbouring inflorescences had lower quality than the focal inflorescence (positive quality-sugar-amount interaction, c2
1 df 117.3, p 0.001, Fig. 4b). While sugar neighbourhoods had either positive or negative effects on seed set (depending on their purity and quality), the effects of neighbour plant density were
Figure 4. Effects of sugar landscapes at the plant, neighbourhood and site scale on (a) pollinator visitation and (b) seed set per inflorescence. Bars indicate standardized regression coefficients, whiskers the corresponding standard errors and stars the significance of effects (*: p 0.05, **: p 0.01, ***: p 0.001). At the plant scale, bars show the effect of inflorescence number (dark blue) and sugar amount per inflores-cence (pink). At the neighbourhood and site scale, light blue bars show main effects of sugar amount, green bars show interactions between impurity (proportion of sugar amount provided by heterospecific plants) and sugar amount, and brown bars show interactions between relative inflorescence quality (difference in sugar per inflorescence) and sugar amount. Light blue bars at the neighbourhood and site scale thus represent effects of purely conspecific sugar amounts, the addition of the corresponding green bars yields the effect of heterospecific sugar amounts with identical quality, and the addition of the corresponding brown bars shows how sugar effects are altered for heterospecif-ics with higher inflorescence quality.
because pollinator visitation depends on instantaneous sugar landscapes at the day of pollinator observation, whereas seed set integrates over phenological variation throughout the sea-son. These different temporal scales could also explain why the positive effect of the site-scale sugar amounts on seed set increased with impurity (Fig. 4b) so that heterospecific sugar had a stronger facilitative effect than conspecific sugar. Theses facilitative effects were favoured by the displacement of the flowering phenologies among our study species (Fig. 2b), which reduces interspecific competition for shared pol-linators (Devaux and Lande 2009) and can maintain large pollinator populations through the season (Moeller 2004, Riedinger et al. 2014). Overall, the balance between facili-tative and competitive effects on pollination visitation and seed set can thus be more positive for heterospecific nectar sugar than for conspecific nectar sugar.
The inflorescence quality (sugar per inflorescence) of focal plants had a positive effect on their own seed set (Fig. 4). Pollinator visitation and seed set of focal plants with lower-quality inflorescences benefitted from higher-quality neighbours, which suggests that these neighbours attracted pollinators and exerted a ‘magnet effect’ (Moeller 2004, Seifan et al. 2014). In contrast, it was disadvantageous for a plant to offer inflorescences of lower quality than the site-scale average. This possibly arises because the large-site-scale for-aging decisions of pollinators induce site-scale competition for pollination.
Floral resources and plant community dynamics The role of floral resources and pollinator-mediated interac-tions for the dynamics of plant communities has received increasing attention in recent years (Sargent and Ackerly 2008, Greenspoon and M’Gonigle 2013, Pauw 2013). We found that both conspecific and heterospecific sugar amounts at the site scale have strong positive effects on plant reproductive success. Previously, Nottebrock et al. (2013) found positive effects of large-scale community den-sity on seed set and lifetime fecundity of Protea repens. The present study of 19 Protea species in 27 communities sug-gests that such community-level Allee effects are a general feature of Protea communities and are mediated by nectar sugar. These community-level Allee effects can have pro-found consequences for plant population and community dynamics: decreased sugar amounts of certain plant species can increase the extinction risk of other plant species, thus increasing the susceptibility of communities to extinction cascades (Colwell et al. 2012).
Our findings also have interesting implications for species coexistence and the structure of diverse plant communities. We found that seed set in Protea communities is affected by negative direct effects of plant density and by predomi-nantly positive effects of sugar amounts (Fig. 4b). The direct density effects reveal that intraspecific density-dependence is more negative than interspecific density-dependence, which should cause rare species to experience less compe-tition than common species and should therefore stabilize coexistence (Chesson 2000). These stabilizing density effects are, however, counteracted by pollinator-mediated effects at the neighbourhood scale: heterospecific sugar has much plants showed a logistic response to pollinator visitation rate
(c2
1 df 9.7, p 0.01).
Discussion
The high-resolution description of sugar landscapes for 27 plant communities enabled us to quantify how floral resources (nectar sugar amounts) vary in space and time, and how their partitioning among plant species and inflores-cences translates into differences in purity and inflorescence quality. The relevance of these aspects of sugar landscapes differed for pollinator visitation and seed set: pollinator visitation largely depended on site-scale sugar variables, whereas seed set was determined jointly by all sugar variables at the plant, neighbourhood and site scale (Fig. 3 and 4). Below, we discuss potential mechanisms causing these floral resource effects, and their consequences for the dynamics of plant communities.
Floral resource effects on pollination and seed set Sugar amounts at the site scale had a strong negative effect on pollinator visitation per inflorescence, but a strong posi-tive effect on seed set (Fig. 4). While the negaposi-tive response of pollinator visitation may seem surprising, it can be explained by the behaviour of bird pollinators. On the same study sites, bird pollinator abundance increased more slowly than site-scale sugar amounts (Schmid et al. 2015b), possibly due to territoriality of bird pollinators. This negative effect does, however, not propagate into seed set (Fig. 4b). The positive and saturating response of seed set to site-scale sugar amounts could result from saturation of stigmas at relatively low levels of pollinator visits, above which more visits do not translate into higher seed set. We observed such a saturating effect in the logistic relationship between seed set and pollinator visitation. Importantly, any interpretation of the differential responses of pollinator visitation and seed set to site-scale sugar amounts must consider the different temporal scales at which pollinator-mediated interactions act: competition for pollination results mainly from the behavioural response of pollinators to instantaneous resource offers, whereas facili-tation mainly results from the numerical response of pol-linators to long-term resource availability (Ghazoul 2005, Riedinger et al. 2014). Facilitative effects caused by increased pollinator abundance thus likely dominate the positive effect of phenology-integrated sugar variables on seed set. In contrast, pollinator visitation was negatively related to sugar availability on the same day, which likely results from short-term competition for pollinator visits.
The purity of the sugar landscape had weak effects on visitation (Fig. 3a and 4a), which is consistent with the finding that the studied bird pollinators are generalists that visit all available Protea species (Schmid et al. 2015b). In contrast, seed set increased with the purity of neighbour-hoods and decreased with the number of inflorescences on the focal plant (Fig. 4b). Both effects are expected if seed set is limited by the availability of outcrossed conspecific pollen (but see Schmid et al. 2015a). The larger impact of phenol-ogy on pollinator visitation rather than seed set could arise
been possible. This work was supported by the German Research Foundation (grant numbers SCHU2259/3-1, SCHL 1934/1-1). For discussion and input we are grateful to Anton Pauw, Phoebe Barnard, Martina Treurnicht and Tony Rebelo. We also thank a large number of field and lab assistants. We were able to accomplish our study thanks to the support of private land-owners (Giel von Deventes, Flower Valley Conservation Trust; Mathia, Nayna and Walter Heidehof, Gansbaai; Bairie and Peter Gibson, Macially High Noon Farm G. and S. Moskovitz) and nature reserves (Grootbos, Fernkloof, Helderberg, Hottentots-Holland, Jonaskop, Limietberg, Mont-Rochelle). Field work was conducted under CapeNature permit AAA005-00213-0028. This is publication number ISEM 2016-207.
References
Armstrong, D. P. and Paton, D. C. 1990. Methods for measuring amounts of energy available from Banksia inflorescences. – Aust. J. Ecol. 15: 291–297.
Bates, D. et al. 2014. lme4: linear mixed-effects models using Eigen and S4. – R package ver. 1.1-7, URL: < http://CRAN.R-project. org/package = lme4 >, accessed 31 March 2015.
Calf, K. M. et al. 2003. Territoriality and breeding success in the Cape sugarbird (Promerops cafer). – Emu 103: 29–35. Carvalheiro, L. G. et al. 2014. The potential for indirect effects
between co-flowering plants via shared pollinators depends on resource abundance, accessibility and relatedness. – Ecol. Lett. 17: 1389–1399.
Charnov, E. 1976. Optimal foraging: the marginal value theorem. – Theor. Popul. Biol. 9: 129–136.
Chesson, P. 2000. General theory of competitive coexistence in spatially-varying environments. – Theor. Popul. Biol. 58: 211–237.
Chittka, L. and Thomson, J. D. (eds) 2001. Cognitive ecology of pollination – animal behavior and floral evolution. – Cambridge Univ. Press.
Collins, B. G. and Rebelo, T. 1987. Pollination biology of the Proteaceae in Australia and southern Africa. – Aust. J. Ecol. 12: 387–421.
Colwell, R. K. et al. 2012. Coextinction and persistence of depend-ent species in a changing world. – Annu. Rev. Ecol. Evol. Syst. 43: 183–203.
Devaux, C. and Lande, R. 2009. Displacement of flowering phenologies among plant species by competition for generalist pollinators. – J. Evol. Biol. 22: 1460–1470.
Devaux, C. et al. 2014. Constraints imposed by pollinator behav-iour on the ecology and evolution of plant mating systems. – J. Evol. Biol. 27: 1413–1430.
Elzinga, J. A. et al. 2007. Time after time: flowering phenology and biotic interactions. – Trends Ecol. Evol. 22: 432–439. Feldman, R. E. and McGill, B. J. 2014. How important is nectar
in shaping spatial variation in the abundance of temperate breeding hummingbirds? – J. Biogeogr. 41: 489–500. Ghazoul, J. 2005. Pollen and seed dispersal among dispersed plants.
– Biol. Rev. 80: 413–443.
Goldblatt, P. and Manning, J. C. 2002. Plant diversity of the Cape region of southern Africa. – Ann. Mo. Bot. Gard. 89: 281–302.
Goulson, D. 2000. Why do pollinators visit proportionally fewer flowers in large patches? – Oikos. 91: 485–492.
Greenspoon, P. B. and M’Gonigle, L. K. 2013. Can positive frequency-dependence facilitate plant coexistence? – Trends Ecol. Evol. 28: 317–318.
Gunton, R. M. and Kunin, W. E. 2009. Density-dependence at multiple scales in experimental and natural plant populations. – J. Ecol. 97: 567–580.
weaker effects than does conspecific sugar on the increase of seed set (Fig. 4b). These sugar effects thus tend to neutralize intraspecific density-dependence while leaving interspecific density-dependence unaffected. Hence, an individual plant immigrating into a neighbourhood dominated by another species will have strongly reduced seed set compared to a member of the dominant species. This ‘priority effect’ should promote the formation of monospecific stands (M’Gonigle and Greenspoon 2014) that are a prominent feature of Protea communities (cf. Fig. 2a). The emergence of such monospe-cific stands reduces neighbourhood-scale coexistence, but can facilitate larger-scale coexistence. Thus, stable stand boundaries decrease large-scale competitive exclusion and stabilize coexistence (M’Gonigle and Greenspoon 2014). In the classification of Chesson (2000), however, this effect is equalizing (reducing fitness differences between species) rather than stabilizing (favouring rare species). In contrast, the positive effects of site-scale sugar amounts on seed set (Fig. 4b) are stabilizing sensu Chesson (2000): site-scale facilitation is stronger between than within species, which favours species that are rare at the site scale.
Our results suggest that pollinator-mediated interac-tions contribute to the formation of monospecific stands, but cause interspecific facilitation across stand boundaries, which stabilizes site-scale coexistence. These effects can help to explain the typical spatial structure of plant communities in a biodiversity hotspot, which differs from other megad-iverse systems (such as tropical forests) through the existence of monospecific stands at small scales, but high species rich-ness at larger scales and thus high beta-diversity (Goldblatt and Manning 2002). Such multi-scale impacts of pollinator-mediated interactions on plant communities are not fully covered by existing single-scale theories (Sargent and Ackerly 2008, Greenspoon and M’Gonigle 2013, Pauw 2013). Conclusions
This study shows that nectar sugar can act as a common ‘interaction currency’ (Kissling et al. 2012) that determines how multiple plant species interact via their shared gener-alist pollinators. Inflorescence number and sugar amount per inflorescence are key quantities that convert the spatial structure and phenology of individual plant species into the spatiotemporal dynamics, purity and quality of this com-mon currency at the community level. Pollinator visitation and seed set respond to these multiple aspects of the ‘sugar currency’, with potentially important consequences for the dynamics and coexistence of plant species within commu-nities. The identification of such interaction currencies is crucial both for developing a more general understanding of community dynamics and for predicting community dynam-ics in changing environments (McGill et al. 2006, Kissling et al. 2012). It is timely to test whether resource landscapes play similar roles in plant communities with different degrees of pollinator-dependence and for other types of generalized trophic interactions, such as plant–herbivore and plant– frugivore interactions see for example Nottebrock et al. 2016b.
Acknowledgements – This paper is dedicated to the memory of the
Pyke, G. H. 1978. Optimal foraging in hummingbirds: testing the marginal value theorem. – Am. Zool. 18: 739–752.
Rathcke, B. 1983. Competition and facilitation among plants for pollination. – In: Real, L. (ed.), Pollination biology. Academic Press, pp. 305–329.
Rebelo, T. 2001. Proteas: field guide to the proteas of South Africa. – Fernwood Press.
Riedinger, V. et al. 2014. Early mass-flowering crops mitigate pollinator dilution in late-flowering crops. – Landscape Ecol. 29: 425–435.
Sargent, R. D. and Ackerly, D. D. 2008. Plant–pollinator interactions and the assembly of plant communities. – Trends Ecol. Evol. 23: 123–130.
Schmid, B. et al. 2015a. Reward quality predicts effects of bird-pollinators on plant reproduction in African Protea spp. – Perspect. Plant Ecol. Evol. Syst. 17: 209–217.
Schmid, B. et al. 2015b. Responses of nectar-feeding birds to floral resources atmultiple spatial scales. – Ecography doi: 10.1111/ ecog.01621
Schurr, F. M. et al. 2012. Fynbos Proteaceae as model organisms for biodiversity research and conservation. – S. Afr. J. Sci. 108: 11–12.
Seifan, M. et al. 2014. The outcome of shared pollination services is affected by the density and spatial pattern of an attractive neighbour. – J. Ecol. 102: 953–962.
Shore, J. S. and Barrett, S. C. H. 1984. The effect of pollination intensity and incompatible pollen on seed set in Turnera
ulmifolia (Turneraceae). – Can. J. Bot. 62: 1298–1303.
Tomlinson, S. et al. 2014. Applications and implications of ecological energetics. – Trends Ecol. Evol. 29: 280–290. Turner, R. C. et al. 2011. Evidence for rodent pollination in
Erica hanekomii (Ericaceae). – Bot. J. Linn. Soc. 166:
163–170.
Uriarte, M. et al. 2010. Trait similarity, shared ancestry and the structure of neighbourhood interactions in a subtropical wet forest: implications for community assembly. – Ecol. Lett. 3: 1503–1514.
Waser, N. M. 1978. Competition for hummingbird pollination and sequential flowering in two Colorado wildflowers. – Ecology 59: 934–944.
Williams, N. M. et al. 2012. Landscape-scale resources promote colony growth but not reproductive performance of bumble bees. – Ecology 93: 1049–1058.
Hegland, S. J. et al. 2009. How does climate warming affect plant–pollinator interactions? – Ecol. Lett. 12: 184–195. Heinrich, B. 1975. Energetics of pollination. – Annu. Rev. Ecol.
Syst. 6: 139–170.
Heinrich, B. and Raven, P. H. 1972. Energetics and pollination ecology. – Science 176: 597–602.
Heystek, A. et al. 2014. Pink flower preference in sunbirds does not translate into plant fitness differences in a polymorphic
Erica species. – Evol. Ecol. 28: 457–470.
Kandori, I. et al. 2009. An invasive dandelion unilaterally reduces the reproduction of a native congener through competition for pollination. – Oecologia 159: 559–569.
Kissling, W. D. et al. 2012. Towards novel approaches to modelling biotic interactions in multispecies assemblages at large spatial extents. – J. Biogeogr. 39: 2163–2178.
Kunin, W. E. 1997. Population size and density effects in pollina-tion: pollinator foraging and plant reproductive success in experimental arrays of Brassica kaber. – J. Ecol. 85: 225–234. MacArthur, R. H. and Pianka, E. R. 1966. On optimal use of a
patchy environment. – Am. Nat. 100: 603–609.
McGill, B. J. et al. 2006. Rebuilding community ecology from functional traits. – Trends Ecol. Evol. 21: 178–185.
M’Gonigle, L. K. and Greenspoon, P. B. 2014. Allee effects and species coexistence in an environment where resource abun-dance varies. – J. Theor. Biol. 361: 61–68.
Mitchell, R. J. et al. 2009. Ecology and evolution of plant–polli-nator interactions. – Ann. Bot. 103: 1355–1363.
Moeller, D. A. 2004. Facilitative interactions among plants via shared pollinators. – Ecology 85: 3289–3301.
Myers, N. et al. 2000. Biodiversity hotspots for conservation priorities. – Nature 403: 853–858.
Nottebrock, H. et al. 2013. Effects of intraspecific and community density on the lifetime fecundity of long-lived shrubs. – Perspect. Plant Ecol. Evol. Syst. 15: 150–161.
Nottebrock, H. et al. 2016a. Data from: Sugar landscapes and pollinator-mediated interactions in plant communities. – BiK-F Repository, < http://dataportal-senckenberg.de/ database/metacat/bikf.10036.1/bikf >.
Nottebrock, H. et al. 2016b. Coexistence of plant species in a biodiversity hotspot is stabilized by competition but not by seed predation. – Oikos doi: 10.1111/oik.03438.
Pauw, A. 2013. Can pollination niches facilitate plant coexistence? – Trends Ecol. Evol. 28: 30–37.
Supplementary material (Appendix ECOG-02441 at < www. ecography.org/appendix/ecog-02441 >). Appendix 1.