Design and Performance Evaluation of a
Biomimetic Flapping Foil
by
Craig Brian Martin
Submitted to the Department of Ocean Engineering
in partial fulfillment of the requirements for the degree of
Master of Science in Ocean Engineering
at the
MASSACHUSETTS INSTITUTE OF TECHNOLOGY
June 2001
@
Massachusetts Institute of Technology 2001. All rights reserved.
A uthor ...
...
...
...
..
...
Department of Ocean Engineering
May 11, 2001
C ertified by ... V .
..
...
...
Michael S. Triantafyllou
Professor of Ocean Engineering
Thesis Supervisor
Accepted by...
...
Chairman, Department Committee on
BARKER
Henrik Schmidt
Graduate Students
MASSACHUSETTS INSTITUTE OF TECHNOLOGYNOV
2 7 2001
Design and Performance Evaluation of a Biomimetic
Flapping Foil
by
Craig B. Martin
Submitted to the Department of Ocean Engineering on May 11, 2001, in partial fulfillment of the
requirements for the degree of Master of Science in Ocean Engineering
Abstract
In this thesis I designed and constructed an apparatus for the study of force produced
by a roll/pitch flapping wing and its associated three-dimensional flow. Provision was
made for advanced real-time feedback control using RTLinux and an integrated mo-tion control and data acquisimo-tion system. Tests were conducted at Reynolds number 20,000 to explore the maneuvering capabilities of a NACA 0012 foil by changing mean pitch angle under harmonic roll/pitch motion, and by non-harmonically driving the roll and pitch through change of a symmetry parameter. It was found that mean lift coefficients in excess of three are available at mean pitch angles of 30 degrees at low Strouhal number and low maximum angle of attack. It was also found that generation of maneuvering forces through change of mean pitch angle is superior to the use of asymmetric motion throughout the range tested.
Thesis Supervisor: Michael S. Triantafyllou Title: Professor of Ocean Engineering
Acknowledgments
This thesis would not have been possible without a number of people who supported me through wise advise, a necessary third hand, and timely distraction from the doldrums of "working in a basement".
I would like to thank Professor Triantafyllou for supporting my work here for two
years, and for putting me on this great project in the first place. Franz Hover was an invaluable resource to me through all stages of this project. Without him, the project would have spelled much more frustration and much less success.
I spent a great amount of time learning, laughing, exploring, and creating with my fellow graduate students in the tow tank. Thanks so much for making me look forward to coming to "work" everyday: Dave, Alex, Josh, Muriel, Anna, Michael, Albert, Jennifer, and John. A number of undergraduates helped make the tow tank fun and exciting. Among them Marisa and Karl directly contributed to this project my making the physical apparatus, thanks!
A number of visiting students came and went during my time in the tow tank.
Their fresh perspectives, dedication to research, and thirst for a good time helped make my time more enjoyable. Thank you: Oyvind, Harald, Martin, Andrin, and Frederick.
Finally, I would like to thank my wife Becky, for standing by me, for paying the bills, and for believing I could accomplish something like this. She sacrificed at least as much as I did for this thesis, I couldn't have done it without her.
Contents
1 Introduction
1.1 Literature Review . . . .
2 Design and Construction
2.1 Hull-Form and Principal Dimensions 2.2 General Arrangement . . . .
2.3 Flapping Mechanism Design... 2.4 Sensor Arrangement . . . . 2.5 Data Acquisition and Motion Control
2.5.1 Data Acquisition . . . .
2.5.2 Motion Control . . . .
2.6 Real-Time Software . . . .
3 Sensor System Calibration
3.1 Position-Dependent Offset Correction . . . .
3.2 Coupling Matrix Solution . . . . 4 Maneuvering Experiments
4.1 Dimensional Analysis . . . . 4.2 Bias Pitch Angle Experiments . . . . 4.2.1 Mean Performance Results . . . . 4.2.2 Time-Domain Results . . . .
4.3 Non-Harmonic Roll Motion Experiments . . . .
13 14 21 . . . . 22 . . . . 23 . . . . 25 . . . . 29 . . . . 30 . . . . 31 . . . . 32 . . . . 34 37 37 39 45 46 48 49 52 54
4.3.1 Mean Performance Results . . . . 55
5 Conclusions
A Pitch Bias Experiments Time-Domain Plots
B Asymmetric Roll Motion Experiments Time-Domain Plots
59
61
List of Figures
2-1 Hull Arrangement . . . . 24
2-2 Motor Arrangement . . . . 24
2-3 Waterproofing Details . . . . 25
2-4 Flapping Mechanism . . . . 27
2-5 Bevel Gear Detail . . . . 28
2-6 Roll/Pitch Coordinates . . . . 28
2-7 Sensor Arrangement . . . . 30
2-8 Data Acquisition System . . . . 32
2-9 Motion Control System. . . . . 33
2-10 Host Computer Software Setup. . . . . 36
3-1 Position Dependent Offsets . . . . 38
3-2 Force/Moment Coordinates . . . . 39
4-1 Kinematics at Various Pitch Bias Angles (Style #5) . . . . 48
4-2 Mean Performance Results for Pitch Bias Experiments . . . . 51
4-3 Lift Coefficient vs. Time for Various Pitch Bias Angles (Style #5) . . . . 53
4-4 Roll Moments vs. Time for Various Pitch Bias Angles (Style #5) . . . . . 54
4-5 Pitch Moments vs. Time for Various Pitch Bias Angles (Style #5) . . . . 55
4-6 Kinematics at Values of s (Style #15) . . . . 56
4-7 Mean Performance Results for Non-Harmonic Roll Experiments . . . . 57
A-1 Lift Coefficent vs. Time for Various Pitch Bias Angles (Style #5) . . . . . 61
A-3 Pitch Moments vs. Time for Various Pitch Bias Angles (Style #5)
A-4 Lift Coefficent vs. Time for Various Pitch Bias Angles (Style #15)
A-5 Roll Moments vs. Time for Various Pitch Bias Angles (Style #15)
A-6 Pitch Moments vs. Time for Various Pitch Bias Angles (Style #15)
A-7 Lift Coefficent vs. Time for Various Pitch Bias Angles (Style #118)
A-8 Roll Moments vs. Time for Various Pitch Bias Angles (Style #118)
A-9 Pitch Moments vs. Time for Various Pitch Bias Angles (Style #118)
A-10 Lift Coefficent vs. Time for Various Pitch Bias Angles (Style #113)
A-11 Roll Moments vs. Time for Various Pitch Bias Angles (Style #113)
A-12 Pitch Moments vs. Time for Various Pitch Bias Angles (Style #113)
B-1 Lift Coefficent vs. Time for Various Symmetry Parameter (Style #5) B-2 Roll Moments vs. Time for Various Symmetry Parameter (Style #5)
Pitch Moments vs Lift Coefficent vs. Roll Moments vs. Pitch Moments vs Lift Coefficent vs. Roll Moments vs. Pitch Moments vs Lift Coefficent vs. Roll Moments vs.
Time for Various Symmetry Parameter Time for Various Symmetry Parameter Time for Various Symmetry Parameter Time for Various Symmetry Parameter Time for Various Symmetry Parameter Time for Various Symmetry Parameter Time for Various Symmetry Parameter Time for Various Symmetry Parameter Time for Various Symmetry Parameter
62 63 64 64 65 66 66 67 68 68 69 70 71 72 73 73 74 75 75 76
77
77
(Style #5) (Style #15) Style #15) (Style #15) (Style #118) Style #118) (Style #118) (Style #113) Style #113) B-12 Pitch Moments vs. Time for Various Symmetry Parameter (Style #113)B-3 B-4 B-5 B-6 B-7 B-8 B-9 B-10 B-11
List of Tables
2.1 Principal Dimensions . . . . 23
3.1 Applied Calibration Loads, L . . . . 41
3.2 Calibration Test Measurements, 1 (bits) . . . . 42
3.3 Calibration Matrix, S . . . . 43
3.4 Percent Error of Maximum Load . . . . 43
Chapter 1
Introduction
Over two thirds of the earth's surface is covered by water, yet human exploration and utilization of the oceans' vast resources have been limited by our ability to create machines that can survive harsh conditions while remaining efficient and adaptable agents for human aspirations. While the challenges of operating in the ocean environ-ment are substantial, we find hope and inspiration in the variety of hugely successful species of animals whose existence has proven the possibility of efficient and adaptable systems suited to the ocean environment.
Clearly, nature's machines are not particularly suited for human directed mis-sions such as transportation, resource exploration and production, warfare, or other missions required of a man-made machine. Furthermore, biological systems such as marine animals are incredibly complex, and likely impractical to emulate to any fine level of detail. These systems involve intricate neural, chemical, and mechanical in-teractions that are well beyond human capabilities for design and construction. How-ever, these are the most elegant and well optimized marine systems, and they show a mastery of the marine environment beyond, perhaps, the hope of human marine system designers. The approach behind this research is to emulate these beautiful evolved machines in the hope that in the future we might apply our findings to the improvement of our own designs.
One type of marine design that is particularly important to human exploration of the oceans is that of the swimming and maneuvering vehicle. Examples of these
include ships, submarines, AUV's, and ROV's. Biological analogs of these designs include whales, dolphins, various fishes, and the penguin. One nearly universal char-acteristic of these biological systems is the use of thrust vortex generation for propul-sion and maneuvering. This characteristic stands in contrast to human designs which are largely based on the spinning propeller and rudder combination.
The focus of this particular work is to study the interactions between a mechanical swimming system and the surrounding fluid. The flapping penguin wing was chosen as the inspiration for this work due to the impressive observed maneuverability of pen-guins "flying" through the water. This maneuverability is astonishing considering the fact that penguin bodies are largely rigid while all maneuvering forces are generated
by the flapping of its wings, rotation of the head and beak, and small adjustments
of the tail. Such maneuverability of a rigid hull swimming in water is encouraging to engineers seeking to incrementally (or drastically) improve the maneuvering ca-pabilities of man-made rigid-hull vehicles. This thesis explores the possibility that flapping wings inspired by the penguin could be used to improve the maneuverability of existing designs.
1.1
Literature Review
Understanding of the hydrodynamics of flapping wings is limited by the fact that the vast majority of previous aerodynamic and hydrodynamic research has been focused on steady problems such as rigid wings at constant angles of attack. The flapping wing is an inherently unsteady problem where the instantaneous flow patterns about the wing are never the same over the course of a flapping cycle.
A number of researchers have looked at the dynamics of unsteady flow about
wings. A selection of these inquiries are described here with particular attention paid to those touching on vortex wakes and the generation of unsteady lift.
A number of parameters are refered to throughout the literature on flapping foils. A few of these are listed here for convenience:
9 Flapping radial frequency: w * Vortex-wake width: A
" Chord length: C
" Reynolds number: Re U Cavg
* Reduced velocity: k = 2c " Strouhal number: St = wA
Freymuth [6] performed experiments on a NACA 0015 profile airfoil in separate
heaving and pitching modes. These experiments were conducted in a low-speed wind tunnel, with foil-chord Reynolds numbers between 5200 and 12,000. Freymuth iden-tified the "propulsive signature" as a staggered vortex street which forms a jet-like velocity component away from the foil.
Flow visualizations are presented for pure plunging motion at k = 2.7, Re = 5200,
h/c
= 0.2, and mean angle of attack of 5 degrees. This combination of parametersresulted in the described propulsive signature. Similar results are shown for pure pitching about the quarter chord axis for k = 2.9, Re = 12000, pitch amplitude 20 degrees, and mean angle of attack 5 degrees.
Careful examination of the figures reveals asymmetry in the vortex wake, sug-gesting a mean lift as would be expected with a non-zero mean angle of attack. The asymmetry in these figures is characterized by the shedding of vortices in distinct pairs that tend to create a mushroom-shaped jet at an angle to the incoming flow. The deduced mean lift is most likely the result of this transverse acceleration of mass. Koochesfahani [12] presents a variety of visualization and laser doppler velocime-try (LDV) data for a NACA 0012 wing section pitching about its quarter chord point at Reynolds number about 12,000. These experiments were performed in a low speed water channel using a feedback control system to control the pitch of the wing for sinusoidal and non-sinusoidal profiles at amplitudes of 2 degrees and 4 degrees.
For sinusoidal oscillating pitch angle the author identifies a thrust/drag depen-dence on reduced frequency where above a certain threshold the oscillating wing produces thrust. This threshold value was shown to be different for the 2 degree and 4 degree cases. Flow visualizations for these cases showed that the result of drag or thrust production could be deduced by the arrangement of down-stream vortices. In particular, it was shown that the case of all vortices in line corresponds to zero thrust/drag, and that any staggering results in non-zero thrust/drag with a sign de-termined by the direction of rotation of the staggered vortices. Furthermore, a unique wake mode was identified with four vortices shed per cycle at high frequencies for 4 degree pitch amplitude.
Non-sinusoidal experiments were conducted by accelerating one of the strokes (half of the cycle) while decelerating the stroke moving in the opposite direction. This motion is described by a symmetry parameter, S, where S=50% corresponds to sinusoidal motion. For these experiments, Koochesfahani shows that typically one large vortex is shed during the fast portion of the cycle, while the slow portion of the cycle sheds multiple vortices of the same sign. Figures show that this often results in three vortices shed per cycle, in a clearly asymmetrical arrangement. Measured mean wake velocity profiles confirm this asymmetry, and suggest mean lift on the foil.
Gursul and Ho [8] performed experiments on a stationary two-dimensional NACA 0012 wing section at an angle of attack of 20 degrees to an unsteady stream. These experiments were performed in a vertical gravity-fed water channel equipped with variable position output slats for controlling the velocity of the flow in the test section. The velocity of the inflow is described as a steady state component plus an oscillating component where the amplitude of the oscillating component (R) is varied between
30% and 70% of the mean flow velocity.
Results show a peak in mean lift coefficient for all values of R at a reduced velocity, k, of about 0.8. It is also shown that mean lift coefficient increases with increasing R. Flow visualizations suggest that mean lift is primarily a function of the amount of the cycle for which the unsteady leading edge stall vortex remains attached to
the wing before shedding into the wake. They demonstrate that this behavior is maximized at around k = 0.8. The maximum mean lift coefficient shown is about 2.7
for R = 0.70 and k = 0.7 (tests with higher values of k are not presented presumably
due to limitations of the apparatus).
Gursul and Ho also present phase-averaged instantaneous lift-coefficients for three values of k. These curves show a strong peak midway through the cycle with maxi-mum values approaching 14 for k = 0.70. It is suggested that these transient forces
are a function of the intensity of the separation (leading edge) vortex as it passes the mid-chord of the wing.
Bandyopadhyay et al. [3] investigated the morphology of various fish species, and
identified common characteristics of both fast and maneuverable fishes. Maneuvering capabilities of fast and maneuverable fish (mackerel and bluefish) are quantified using video analysis. Comparison of this maneuverablity to that of man-made vehicles clearly shows the superiority of live-animal maneuvering to that of man-made vehicles. Experiments on an unsteady maneuvering device consisting of a controllable-camber dorsal fin are also discussed. Experiments show unsteady forces not predicted by airfoil lifting theory.
Anderson et al. [1] conducted extensive experiments with heaving and pitching NACA 0012 foil sections at zero mean angle of attack for a variety of harmonic
heave/pitch motions. The authors' experiments focused on a search for maximum propulsive efficiency using both force measurement and Particle Image Velocime-try (PIV). The force measurement experiments were conducted at Reynolds number 40,000, while the visualization was at Reynolds number 1100.
The search resulted in propulsive efficiency as high as 87%. Visualization shows that high efficiency corresponds to the synchronization of the shedding of same-sign leading edge and trailing edge vorticity resulting in a reverse Karman street. Further-more, it was shown that efficiency is highly dependent on the phase angle of motion between heave and pitch which effects the synchronization of leading and trailing
vorticity shedding.
Read [13] performed a number of experiments on an apparatus similar to that of
Anderson et al. [1]. Read's experiments were in four categories: Harmonic Propulsion, non-Harmonic Propulsion, Harmonic Maneuvering, and Starting Maneuvers.
Harmonic Propulsion experiments showed an efficiency plateau for high thrust coefficients on order of unity at about 45% efficiency. A drop-off in efficiency was identified for high Strouhal numbers and attributed to the kinematic breakdown of the angle of attack profile that results from harmonically driven heave and pitch motions.
Non-harmonic propulsion experiments corrected the deteriorating angle of attack profile by modulating the heave velocity in order to produce a nearly sinusoidal an-gle of attack profile. Read was able to apply this approach to a number of high Strouhal number runs, and showed that trends of increasing thrust-coefficient at low Strouhal numbers could be continued into higher Strouhal number ranges by using the corrected motion.
Harmonic maneuvering experiments consisted of harmonic heave/pitch motion with a non-zero mean pitch position. Read showed that this motion could be used to generate large mean lift coefficients and results in a general vectoring capability of flapping foils for possible application to surface and underwater vehicles. Interpolated results show a maximum mean lift coefficient with zero thrust of 4.34 at 100 degree phase angle and 30 degree maximum angle of attack, and bias angle of 24 degrees.
Haugsdal
[9]
conducted experiments on the same apparatus as Read [13]. The experiments of interest were those visualizing the flow in the wake of the flapping foil. Haugsdal did a number of experiments contrasting the wake behind harmonically oscillating foils, and non-harmonically oscillating foils. The most interesting of these were cases similar to those conducted by Read. For these cases, Haugsdal shows that the wake behind a harmonically driven foil at high Strouhal number is relatively unorganized with multiple "drag" vortices shed per cycle. In contrast, visualizationsshow that, for the same Strouhal number and heave-to-chord ratio, fixing the angle of
attack with a sinusoidal profile results in an ordered wake with vortices staggered in
a standard two vortex-per-cycle configuration resulting in markedly better efficiency
and thrust production.
Chapter 2
Design and Construction
Most any design project requires the effective balance of competing design objectives. Typically the process of design involves an iteration through the objectives, where a decision made to improve the meeting of one objective affects the design's ability to satisfy the others. The design of the Sea-Lion was achieved through just such a process. As such, the discussion presented in this chapter shows the role that each of the primary objectives played in the various design decisions. The discussion does not attempt to narrate the actual iterative design process complete with all of the dead-ends that are revealed through such a process. The design and construction of the Sea-Lion apparatus were driven by the following objectives:
" testing in the MIT Towing Tank
" measure all six forces and moment generated in time by foil motion during a constant speed run as well as foil position in order to calculate propulsive efficiency and force and moment coefficients
* two degree-of-freedom flapping motion (roll/pitch) * maximize motion controllability
" minimize free surface effects and non-uniform inflow effects
. provide for the possibility of real-time feedback control
* maximize ease of testing by a single operator
* construction by a student using MIT facilities with moderate outside assistance
2.1
Hull-Form and Principal Dimensions
More than any other design component, the hull-form best shows the general concept of a flapping wing attached to a vehicle. The final design of this hull-form resembles the typical tubular underwater vehicle. However, the hull-form design required sig-nificant balance of the design objectives before a workable final design was complete
A streamlined submarine-like hull form was chosen as the platform to attach a
flapping wing for testing. This decision was reached as a result of the balance of previously stated design objectives. In order to minimize free surface effects and maximize the uniformity of the input flow to the foil, the apparatus is located in the vertical middle of the tow-tank. An underwater body is required to house the mechanism required to create the flapping motion of an external wing and to simulate the existence of the vehicle or animal that the wing is typically attached to.
The principal dimensions of the hull-form were chosen to be the maximum size that would remain workable for one person to move and lift alone. Proximity of the flapping wing to the free-surface and tank floor were also considerations, but the limiting factor was the single operator limitation. In fact, though it is possible for a single person to move the apparatus from stowed position to testing position and vice versa, nearly any other movement of the device requires two people. Another consideration for the principal dimensions was the bulk of the internal sensors and flapping mechanism. This bulk proves to be a limiting factor in maintaining small overall length.
The wing is located on the bottom of the hull opposite the carriage attachment mast. This placement minimizes any effect of the fixed mast on the fluid flow around the wing, as well as minimizing any vertical accelerations of fluid which would be
Table 2.1: Principal Dimensions
Length
5.25 ft
Hull Diameter 8 in
Wing Span 30 cm
Wing Plan-form Area 1135m
Average Chord 5.51 cm
most likely to dissipate energy through the generation of surface wave energy. The wing dimensions are limited by the torque capacity of the servo gear-motors. The wing-span to chord ratio is similar to that of a penguin, and the length was chosen based on 2-D flapping foil experiments conducted in [13]. The final dimensions are
listed in table 2.1.
2.2
General Arrangement
With the general external hull form and wing placement determined, the internal arrangement of sensors and actuators is possible. The factors of primary impor-tance during this design phase are the environmental requirements of various sensors and actuators. Economical electric motors and sensors are rarely water-proof. Un-derstandably, this creates difficulty when coupled with the fact that the vehicle is required to operate primarily under water.
The design requires that at least a portion of the hull that contains the primary motors and force sensors remain dry. The awkward attachment of the flapping wing to the hull makes the possibility of a reliable water-proof seal at the point of wing attachment unlikely. The final design does not attempt such a questionable arrange-ment. Rather, the final design employs the usee of a proven rotary shaft seal for the primary moving seal (see figure 2-3). All other seals required in the final design are static seals that can be constructed with ease.
The final arrangement consists of a horizontally split central hull machined from a solid Delrin cylinder (see figure 2-1). This central Delrin portion is extended at the
Carriage Attachment
Upper Central Strut
Nose Cone Section Tail Cone
Wing Attachment
Forward Acrylic Lower Central Point Aft Acrylic
Section Section Section
Figure 2-1: Hull Arrangement
O-ring
O-ring
Seals Seals
Pitch Motor Beam Couplings Roll Motor
Figure 2-2: Motor Arrangement
nose and tail by transparent acrylic tubes which are further capped by a wooden nose and tail cones. The interfaces between the acrylic hulls and the central Delrin section are sealed by a double o-ring seal. The carriage attachment mast attaches to the top
of the central Delrin section, while the wing attaches at the bottom of this section. For reasons mentioned above, the bottom central hull is designed to be flooded
during normal operation. This section houses the flapping mechanism which is
di-rectly inside of the external wing attachment point. This lower central section also houses two water-proof torque sensors. The top of this section is capped by a
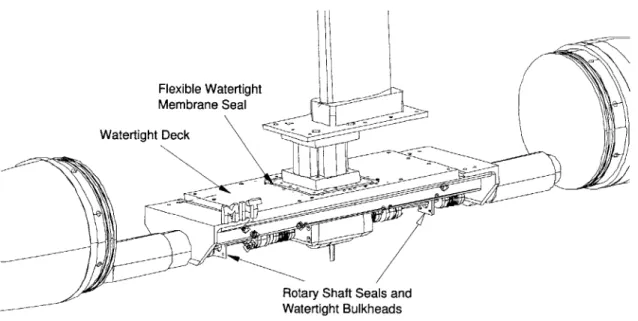
re-movable anodized aluminum sealing plate fitted with an o-ring gasket seal and easily removable stainless steel fasteners. This sealing plate contains a cut-out for the force-dynamometer, and is fitted with a flexible membrane seal so that the dynamometer
Flexible Watertight Membrane Seal Watertight Deck
Rotary Shaft Seals and Watertight Bulkheads
Figure 2-3: Waterproofing Details
Teflon v-ring rotary shaft seals that allow shafts attached to the motors to actuate the flooded flapping mechanism.
The two servo-motors are housed within the tubular acrylic sections, and are mounted on two aluminum angles embedded in the central hull. The top sealing plate and the rotary shaft seals of the lower central Delrin section, and the double o-ring seals between the acrylic and Delrin sections allow the acrylic sections of the hull to remain dry and maintain suitable environmental conditions for standard economical servo-motors.
2.3
Flapping Mechanism Design
The design approach to the flapping mechanism is dominated by the required roll/pitch wing kinematics and the objective of maximizing controllability. However, consider-ations of watertight sealing and sensor arrangement affected the design considerably, resulting in design compromises that often hindered the satisfaction of the primary objectives of controllability and proper kinematics.
The kinematic requirements of the design are to independently control the roll and pitch positions and velocities in time to create the flapping-wing-like motion observed
in penguins and other marine animals. The design requires that the mechanism be capable of a wide range of motion amplitudes, frequencies, and motion shapes. In particular, the design must be capable of phase shifted harmonic motion where the roll angle leads the pitch angle by a specified phase lag. The mechanism must also be capable of non-sinusoidal motion profiles within reasonable physical limits
(continuous, differentiable, without excessive velocity or acceleration, etc.).
In order to achieve the variety of different amplitudes, frequencies, and motion profiles, computer controlled servo-motors were chosen to drive the flapping mecha-nism. Servo-motors are ideal for this type of application because nearly any motion profile is achievable through computer control without any physical change such as changing linkage points or changing out gears or cams. Changes in motion profiles require only small software changes that can be accomplished in the middle of a single run if required.
The controllability of the above kinematic requirements is the second primary de-sign objective and can be described as the accuracy with which the mechanism can create the required kinematics. For any physical system, one-hundred percent accu-racy is likely impossible, therefore the goal is to minimize any error, while satisfying all other design objectives.
The main obstacles to the controllability of this flapping mechanism design are the torque capabilities of the servo-motors, mechanical backlash, transmission com-pliance, and proximity of feedback sensors to the objective output of the mechanism.
All of these factors lead to increased error in the desired roll and pitch motion of the
wing. The final design attempts to balance the sources of kinematic error:
* Torque capability of the servo motors: minimal error because of gear-boxes, but increases backlash.
* Mechanical backlash: moderate error due to motor gear-box backlash and pitch bevel-gear, reduces required motor torque.
" Transmission compliance: moderate error, steel shafts are stiff, but somewhat
mis-alignments.
* Error coupling: coupling between the two motor inputs for the wing pitch
output results in the addition of roll error into the pitch error.
" Proximity of feedback sensors to output: moderate error because the above
sources of error are not measured at the motor encoder. Design is limited due
to lack of availability of small water-proof position sensors.
Pitch Input ShaftRoll Input Shaft Bearing Housing Bevel Gear
Wing Attachment Housing
Figure 2-4: Flapping Mechanism
The final flapping mechanism design uses the unique bevel-gear arrangement
illus-trated in figures 2-4 and 2-5. This design allows for a direct connection from the roll
control motor to the roll input of the mechanism. This direct connection minimizes
backlash and compliance. The pitch transmission includes a bevel-gear arrangement
that allows the pitch control motor to be placed horizontally which is ideal
consider-ing the 8 inch hull diameter limitation. This does, however, introduce some backlash
into the pitch transmission. Furthermore, this arrangement couples the control of the
wing pitch. This coupling is a result of the fact that the bevel-gear housing actually
rolls with the same angle of the wing. The coupling between the roll and pitch motors
that results in the wing pitch position is described in equations 2.1 and 2.2. The roll
and pitch coordinates are shown in figure 2-6.
Bevel Gears
Pitch Input
Shaft
Wing Attachment Point
Figure 2-5: Bevel Gear Detail
#
= wing roll position0 = wing pitch position
4D = roll motor position
E
= pitch motor position# = <D (2.1)
0 =E) - 4D (2.2)
pitch,
0
Fu 2oll, (}
The coupling of input motion to pitch angle output is accounted for by adding the commanded roll position to the desired pitch position when calculating the motion profiles for a given run. This corrects for the coupling, giving the desired pitch profile. Unfortunately, this method does not account for the roll positioning error which is added to the pitch error due to the coupling.
2.4
Sensor Arrangement
In order to accomplish the objective of measuring forces, power input, and power output, force and position sensors are a required element of the system design. Fur-thermore, the three dimensional nature of the flow about a rolling and pitching wing all but guarantees large forces and moments in directions other than pure thrust, side-force, roll, and pitch. In all likelihood the forces and moments generated by the wing in the fluid will consist of a full combination of all six possible forces and mo-ments. It is desirable to know the characteristics of these forces in order to describe the generated forces, as well as to correct for force coupling in a typical force sensing system.
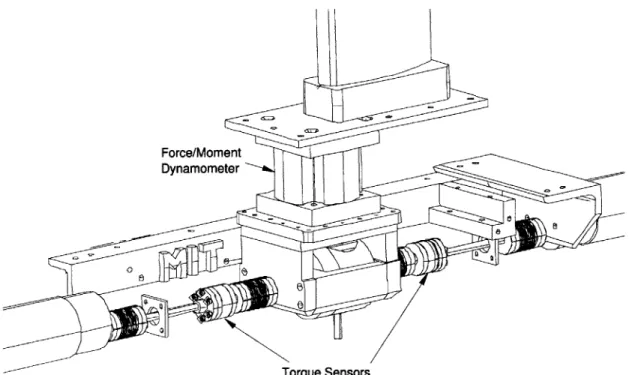
The final sensor arrangement measures all of the applied forces and moments through the use of a six degree-of-freedom force/moment dynamometer and two torque sensors. This arrangement is illustrated in figure 2-7. The force dynamometer is anchored to the mast attachment point, and absorbs the load carried by the main bearing housing of the flapping mechanism. The torque sensors measure the torque applied to the roll and pitch input shafts to the flapping mechanism. The axial and transverse forces carried by the input shafts are expected to be small, yet affect the overall sensitivity of the dynamometer measurement. These effects are to be taken into account in the sensor system calibration described in chapter 3.
Roll and pitch position and velocity measurements are made using the servo-motor encoder feedback sensors. Use of these sensors eliminates the need for specialized water-proof position sensors, and needless sensor duplication.
Force/Moment Dynamometer
Torque Sensors
Figure 2-7: Sensor Arrangement
2.5
Data Acquisition and Motion Control
The process of doing an experiment with the Sea-Lion apparatus involves both
con-trolling the motion of the wing, and recording the physical measurements made by
the force and position sensors. In other similar robotic systems these two tasks are
typically delegated to totally separate systems. This approach of separating the two
systems is driven by a desire to modularize the process making it simpler to
trouble-shoot and easier to understand. This typical approach, however, limits the flexibility
of control feedback and requires unnecessary sensor duplication in order to maintain
full modularization.
The Sea-Lion Data Acquisition and Motion Control systems are integrated into
one single system. While this tends to make the single integrated system more
com-plex than the two modular systems, it makes elaborate feedback control a possibility
and requires no duplication of sensors. There remain, however, two distinct tasks to
be accomplished by the system: record data for later analysis and actively control
the flapping of the wing.
2.5.1
Data Acquisition
Measuring and recording physical quantities requires measuring the physical quantity with a sensor which outputs an electrical signal somehow related to the value of the measured quantity. Often this sensor must be powered by an external unit which supplies power to the sensor, and converts its electrical output into another electrical output which typically relates the value of the measured quantity proportionally to the output voltage. This output voltage is then recorded using some type of logging machine.
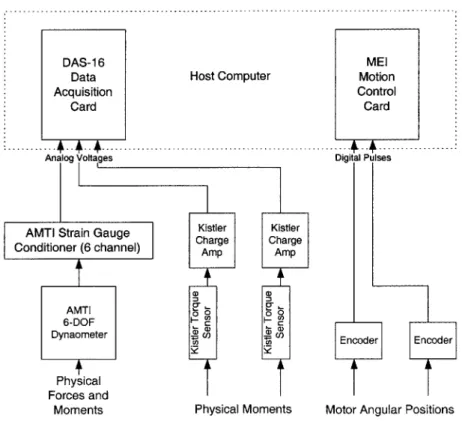
The sensors used in the Sea-Lion are the force/moment dynamometer, the shaft torque sensors, and the motor angular position encoders. The force/moment dy-namometer is based on strain-gage technology and was purchased from AMTI along with the required external power supply and signal conditioning unit. The shaft torque sensors were purchased from Kistler Instruments and rely on the piezo-electric properties of the Quartz crystal embedded inside the sensors. This technology re-quires the use of a specialized charge amplifier to convert the minute amounts of charge produced by the Quartz into a reasonable voltage signal proportional to the shaft torque. These charge amplifiers were also acquired from Kistler Instruments. The motor angular position encoders are distinct from the other sensors because they make direct digital measurements by emitting a pulse whenever a slot in a spinning disk passes a stationary reading head. These digital pulses are fed directly to a computer and counted to determine angular position.
In order to record the voltage signals output by the sensor signal conditioners, a data acquisition system is needed to maintain a log of all the data for the experi-ments. Digital sampling and recording is by far the simplest and easiest method for logging finely spaced time-domain measurements for use in later analysis. For this purpose a Computer Boards DAS-16 analog-to-digital (A/D) sampling board was used to record the voltage data output from the dedicated sensor signal conditioners. The position measurement does not require A/D conversion because the encoders on the servo motors make digital measurements directly. The position measurement is
DAS-16 MEl
Data Host Computer Motion
Acquisition Control
Card Card
Analog Voltages Digital Pulses
AMTI Strain Gauge Kistler Kistler
Conditioner (6 channel) Charge Charge
AMTI 0 0
6-DOF
Dynaometer Encoder Encoder
Physical Forces and
Moments Physical Moments Motor Angular Positions
Figure 2-8: Data Acquisition System
obtained directly from the motion control board circuitry which is described later in this chapter.
The DAS-16 board used has 12 bit resolution (4096 increments) set to measure between 5 Volts. The encoders used 500 line disks which give 1,000 increments of
measurement per revolution of the motor. Since the motor has a 5.9:1 reduction gear-set, the position resolution at the motor output is 5,900 increments per revolution. These measurements are recorded at 200 samples/second, allowing digital filtering of frequencies below 100 Hz.
2.5.2
Motion Control
Servo control of the motors requires an active feedback controller that continuously compares a commanded position signal to the actual motor position as measured
by the encoder. The error between these two signals is then used to generate a commanded torque sent to the motor in the form of electrical current. The system
used in the Sea-Lion includes a DC brushed servo-motor, a current control amplifier, and a digital control card integrated into the data acquisition and motion control computer. The motors, purchased from Pittman, are simple DC motors which output torque roughly proportional to the amount of current applied to the motor coils, and include integral encoders to measure the angular position of the rotor. A Copley Controls current amplifier is used to control the current applied to the motor. The digital control card was purchased from Motion Engineering Inc. (MEI), and uses digital circuitry to provide continuous control.
DC Power o
Supply
, Copley Controlsly__
MEl
Voltage Current Amplifier Control Card at Copley Controls r s LPCurrent Amplifier ue t DC Motor Encoder Torque Output==DC
Motor EnojderFigure 2-9: Motion Control System
The MEI control card uses encoder interfaces, analog voltage outputs, and a ded-icated digital signal processor (DSP) to calculate commanded positions, measure position error, and execute a discrete PID control algorithm to generate an analog torque command to send to the Copley Controls amplifier. Because the MEI board uses a dedicated DSP, the host computer is not burdened with any of the PID com-putational load and is free to execute other tasks such as data acquisition or driving the user interface.
2.6
Real-Time Software
In order to integrate the data acquisition and motion control tasks into one computer, real-time software is required. The software must be able to make use of the various sensor inputs for logging data from the experiment and also make use of the motor control card for managing the motion of the wing. The primary challenge of this integration is to create and use software that can collect and feed data to and from the proper sensors and controllers in a timely and reliable manner. This challenge is overcome by the use of real-time software.
By integrating the motion control and data acquisition systems into one system,
it is possible to log motor position information collected by the control card, or to use sensor information collected by the data acquisition card as feedback for use in the control system. In order for this integration to succeed, the host computer and its software must be capable of shuffling the information where it is needed, when it is needed. The standard data acquisition rate for Sea-Lion experiments is 200 samples/second, resulting in a time increment of 0.005 seconds. In order to properly log synchronized data between the control card's encoder inputs and the data acquisition card's A/D converters, the software must be able to collect the data in intervals smaller than .005 seconds, and do so repeatedly without delaying or skipping any of the scheduled increments. Good performance feedback control for this system could require reliable scheduling increments an order of magnitude smaller than those required for simple data logging.
Today's standard operating systems are not capable of providing this level of scheduling guarantee. Most modern operating systems including Windows and Linux are based on a preemptive multi-tasking scheduler that does not give any hard schedul-ing guarantees for any of the various tasks runnschedul-ing on the system. This design is ideal for applications where no guarantee is required, and the system is required to balance a number of computing tasks simultaneously. Unfortunately, controlling an appara-tus such as the Sea-Lion requires tight scheduling guarantees that standard systems cannot offer.
Fortunately, many engineers in various industries have the need for such scheduling capability, and a small but dedicated market exists for software that can perform these non-standard tasks. Among these specialized alternative exists a free and open extension to the equally free and open Linux operating system called Real-Time Linux (RTLinux). This extension allows a few specially coded process threads to rely on a real-time scheduler that can provide hard guarantees about when processes are started and repeated. The scheduling accuracy for this system is limited by the computer hardware rather than by the system software. In the case of the commodity Intel hardware used in the Sea-Lion, scheduling accuracy is within an error of about 15pas. An advantage to this approach is that the rest of the Linux operating system remains, along with its capability for system maintenance, disk i/o, network communication, etc.. These operating system functions cannot be used with the real-time scheduler, but this is not necessary for application in the Sea-Lion.
The real-time software system design for the Sea-Lion uses RTLinux to control the timing of the data acquisition samples. This design requires hardware drivers to be modified for use with the real-time scheduler. Since the data acquisition requires data from both the data acquisition and motor control hardware, drivers had to be modified for both pieces of hardware. Fortunately, source code is available for the drivers for both pieces of hardware, and only minor changes are required to allow their compilation and use with the real-time extensions. With these changes, the integrated software and hardware system is fully capable of logging the data from the
A/D converters as well as the encoder feedbacks in regular increments. Figure 2-10
illustrates the real-time software design.
This system is also easily extensible to use custom control algorithms using any of the sensors attached to the computer as feedback. While this is not yet imple-mented in the system, very few modifications are required to use the apparatus as a platform for experimenting with force-feedback control in biomimetics and marine vehicle maneuvering and propulsion.
- - - - -- ---- - - -- Ir - - - - - - - - - - - - - - - - -
-High Priority Tasks i I Low Priority Tasks
(RTLinux) 1 (Linux User-Space)
U- Data Logging
Periodic Data Acquisition Da
Hardware Initialization Safety Monitoring Network Services Advanced Feedback (SSHd, FTPd, HTTPd) Control User Interface Custom Drivers
Shared Resources Non-Real-Time Access Only
DA-6User
Data MEI Disk Network Interface
Control (keyboard,
Acq. I Storage (Ethernet) mue
Cad Card mose
C r display)
- -
Chapter 3
Sensor System Calibration
After an experiment is completed, and the outputs from the sensors have been recorded, these outputs must be translated into real units of force and position. This translation is accomplished through the use of a calibration which consists of a series of experiments conducted under controlled conditions with known loads and positions. If these calibration experiments are complete, their results, in combination with the known loads, are used to create the sensor system calibration.
Often, for a simple apparatus with a single sensor which is known to have linear response a single experiment can give a reliable calibration. For complex systems, however, a number of factors can complicate this process. The factors complicating the Sea-Lion sensing system are cross-coupling and position-dependent offsets. These two complicating factors are handled independently and sequentially.
3.1
Position-Dependent Offset Correction
An unfortunate consequence of the design discussed in section 2.4 is that minor mis-alignments in the flapping mechanism and external shafts and bearings result in a non-linear position-dependent offset at the dynamometer output channels. This is best shown by removing the wing from the apparatus while in air and observing the dynamometer measurements while rotating the motor shafts. The dynamometer mea-surements show significant changes in force, while it is known that there is negligible
change in external load while the vehicle is in air with no wing attached.
These forces measured by the dynamometer are real forces caused by the lack of perfect alignment in the various shafts, seals, bearings, and couplings in the flapping mechanism and external transmission. These forces, however, are not of interest in the study of the forces generated by wing/fluid interactions. It is important, therefore, to understand the nature of these internal forces so that they can be distinguished from the forces of interest.
The internal forces can be eliminated from the dynamometer measurement by describing the offset of each of the dynamometer channels as a two-parameter function of the two motor positions. Because the motors are computer controlled, it is simple to finely sample points on these two parameter functions, and later interpolate between these points to calculate the offset corrections to subtract from the dynamometer measurements for all of the combinations of motor positions encountered during the run. 200, 0, -200, 00 _400-9 (rad) 4 (rad) d4 200 -Z100_ 5)05-, 0 9 (rad) 0 (rad) Fig 20- -10- W-20- 30-9 (rad) cD(rad) 40 0 -~ -20
re 3-1: Position Dependent Offsets
Figure 3-1 shows the result of a typical set of zero external load experiments for various combinations of motor positions. These samples are taken at 25 pitch motor positions for each of 25 roll motor positions. All positions are evenly incremented
-40, 0. - .5 -0 D (rad) 0 (rad) d6
0
- 01-01 -0 0 5 -2 (D (rad) E) (rad)between the extremes of available motion. The result is the interpolation of a grid of
625 samples describing a surface that is a function of the two motor positions.
Once a run is completed, the recorded motor position profiles are used to calculate the offset of each of the dynamometer channels. These offsets are then subtracted from the recorded dynamometer signals. After the subtraction the remaining signals are the result of external forces exclusively.
3.2
Coupling Matrix Solution
Due to the design of the force sensing system it is not possible to merely use the output of the dynamometer as representative of the actual external forces, even when applying the position dependent correction. This is a result of the fact that the dy-namometer is integrated into a structure that includes two input shafts that carry loads to the surrounding structure that cannot be measured by the dynamometer. In fact, given the nature of the integrated structure, it is difficult to make any as-sumptions about what types and magnitudes of forces are absorbed by these input shafts. Therefore, it is necessary to execute a complete set of calibration tests that can identify any possible coupling between sensor measurements and applied external loads. Furthermore, it is necessary to make these measurements at a number of load magnitudes in order to show linearity of the coupled system.
x
Figure 3-2: Force/Moment Coordinates
For simple systems with minor coupling it is possible to approach the problem in a manual fashion by identifying coupling parameters individually while isolating the
exact source of the coupling. For sensing systems as large as the Sea-Lion, however, this painstaking process can spiral into a system of too many coupling parameters to understand individually. As a result of this complexity a more general method was developed that increases the simplicity of the process, perhaps at the expense of detailed understanding of the cause of each of the individual parameters.
The general system that was used was to identify a series of calibration tests with known loads that exercise the sensing system in a complete series of linearly independent modes. Each of these modes is exercised with varying load magnitudes. The results of these tests are used as two matrices: the matrix of known loads in each of the primary directions for each test (L), and the matrix of measured voltages for each of the sensor outputs for each test (R). The relationship between these two matrices is a matrix (S) that contains the calibration and coupling parameters needed to interpret the sensor data recorded for any run. The relation is as follows:
R x S = L (3.1)
S
=R\L
(3.2)
where the backslash (\) operator solves the over-determined linear system in the least-squares sense. The system is over-determined because tests were conducted with three sets of weights, giving more information than is required for a unique solution. This calculation gives the calibration matrix (S) such that the actual external loads (1) are determined by right multiplying the sensor measurements (r) by S.
I= i x S (3.3)
T=T
1i= [Fx , Fy , Fz , Mx, My, Mz , Mpitchl
S= [di, d2, d3, d4, d5 , d6, 71, T21
Tables 3.1-3.3 show the calibration data and solution for a typical set of cali-bration tests. Notice that identical modes are tested at different magnitudes, and that the 24 tests in seven principal axes create a full-rank loading matrix. It is also
Test
#
Fx Fy Fz Mx My Mz Mpitch(N)
(N)
(N)
(N-m)
(N-m)
(N-m)
(N-m)
12
3
4
5
67
8
9 10 1112
13
14 15 16 17 18 19 20 21 22 23 240
0
0
0
0
0
0
0
0
-3.1 -5.67 -8.09 -3.1 -5.67 -8.090
0
0
0
0
0
0
0
0
-2.57
-2.57-2.57
-5.26 -5.26 -5.26 -7.79 -7.79 -7.790
0
0
0
0
0
0
0
0
-2.57
-2.57
-2.57
-5.26
-5.26
-5.26
0
0
0
0
0
0
0
0
0
0 0 0 0 0 03.1
5.67
8.090
0
0
0
0
0
-0.207 -0.204 -0.427 -0.423 -0.416 -0.873 -0.627 -0.617 -1.290
0
0
0
0
0
0
0
0
-0.213 -0.21 -0.396 -0.491-0.485
-0.8650
0
0
0
0
0
0
0
0
0.241 0.441 0.629 0.4650.849
1.21 -0.109 -0.198-0.283
0
0
0
0
0
0
-0.00967
0.208 -0.0057 -0.0198 0.426 -0.0117 -0.0293 0.631 -0.0173 0.01580.0288
0.0411 0.01580.0288
0.04110
0
0
-0.00967 0.208-0.0057
-0.01980.426
-0.0117
-0.00967
0.208 -0.0057 -0.0198 0.426 -0.0117 -0.0293 0.631 -0.0173 0.0158 0.0288 0.0411 0.01580.0288
0.04110
0
0
-0.00804
0.173 -0.00474 -0.0165 0.354 -0.00969Table 3.1: Applied Calibration Loads, L
important to note that the resulting measurements also form a full-ranked matrix. The final calibration matrix S shows that the system is very coupled. In order to calculate a single external load, the measurement of more than one sensor is needed. Furthermore, the existence of a dependence of the load calculation on the shaft torque sensor data implies that the shafts carry non-torque loads that are proportional to the torque measured by the sensor.
Table 3.4 shows the accuracy of the least squares solution. Numbers shown in the table are percent error of R x S based on the maximum load applied for each principle direction for all 24 calibration runs. A brief look at the errors found shows
1 2 3 4 5 6 7