HAL Id: inserm-00090461
https://www.hal.inserm.fr/inserm-00090461
Submitted on 31 Aug 2006
HAL is a multi-disciplinary open access
archive for the deposit and dissemination of
sci-entific research documents, whether they are
pub-lished or not. The documents may come from
teaching and research institutions in France or
abroad, or from public or private research centers.
L’archive ouverte pluridisciplinaire HAL, est
destinée au dépôt et à la diffusion de documents
scientifiques de niveau recherche, publiés ou non,
émanant des établissements d’enseignement et de
recherche français ou étrangers, des laboratoires
publics ou privés.
computational approach.
Audrey Sabbagh, Pierre Darlu
To cite this version:
Audrey Sabbagh, Pierre Darlu. Inferring haplotypes at the NAT2 locus: the computational approach..
BMC Genetics, BioMed Central, 2005, 6, pp.30. �10.1186/1471-2156-6-30�. �inserm-00090461�
Open Access
Research article
Inferring haplotypes at the NAT2 locus: the computational approach
Audrey Sabbagh* and Pierre Darlu
Address: Unité de Recherche en Génétique Epidémiologique et Structure des Populations Humaines, INSERM U535, Villejuif, France Email: Audrey Sabbagh* - [email protected]; Pierre Darlu - [email protected]
* Corresponding author
Abstract
Background: Numerous studies have attempted to relate genetic polymorphisms within the
N-acetyltransferase 2 gene (NAT2) to interindividual differences in response to drugs or in disease susceptibility. However, genotyping of individuals single-nucleotide polymorphisms (SNPs) alone may not always provide enough information to reach these goals. It is important to link SNPs in terms of haplotypes which carry more information about the genotype-phenotype relationship. Special analytical techniques have been designed to unequivocally determine the allocation of mutations to either DNA strand. However, molecular haplotyping methods are labour-intensive and expensive and do not appear to be good candidates for routine clinical applications. A cheap and relatively straightforward alternative is the use of computational algorithms. The objective of this study was to assess the performance of the computational approach in NAT2 haplotype reconstruction from phase-unknown genotype data, for population samples of various ethnic origin.
Results: We empirically evaluated the effectiveness of four haplotyping algorithms in predicting
haplotype phases at NAT2, by comparing the results with those directly obtained through molecular haplotyping. All computational methods provided remarkably accurate and reliable estimates for NAT2 haplotype frequencies and individual haplotype phases. The Bayesian algorithm implemented in the PHASE program performed the best.
Conclusion: This investigation provides a solid basis for the confident and rational use of
computational methods which appear to be a good alternative to infer haplotype phases in the particular case of the NAT2 gene, where there is near complete linkage disequilibrium between polymorphic markers.
Background
N-acetylation polymorphism is one of the earliest discov-ered and most intensively studied pharmacogenetic traits that underlie interindividual and interethnic differences in response to xenobiotics. In humans, acetylation is a major route of biotransformation for many arylamine and hydrazine drugs, as well as for a number of toxins and known carcinogens present in the diet, cigarette smoke
and the environment [1-3]. Genetically determined differ-ences in N-acetylation capacity have been proved to be important determinants of both the effectiveness of ther-apeutic response and the development of adverse drug reactions and toxicity during drug treatment [4]. In the last decades, numerous investigations have been made to elucidate the genetic basis of N-acetylation polymor-phism in various ethnic groups in order to develop Published: 02 June 2005
BMC Genetics 2005, 6:30 doi:10.1186/1471-2156-6-30
Received: 02 February 2005 Accepted: 02 June 2005
This article is available from: http://www.biomedcentral.com/1471-2156/6/30 © 2005 Sabbagh and Darlu; licensee BioMed Central Ltd.
This is an Open Access article distributed under the terms of the Creative Commons Attribution License (http://creativecommons.org/licenses/by/2.0), which permits unrestricted use, distribution, and reproduction in any medium, provided the original work is properly cited.
efficient genotyping tests and to adapt therapies to specific patients and populations in accordance with their genetic makeup. Some of the drugs excreted by acetylation are indeed crucial in the treatment of diseases representing a worldwide concern, such as tuberculosis and AIDS-related complex diseases [5,6]. Moreover, a number of epidemio-logical studies have suggested possible associations between the N-acetylator phenotype and a variety of com-plex human diseases, the most consistent findings being those regarding urinary bladder cancer and familial Par-kinson's disease [7-10].
The gene coding for the arylamine N-acetyltransferase 2 (NAT2) enzyme has been established as the site of the classic human acetylation polymorphism [11-13] and the molecular basis of individual and interethnic variation in acetylation capacity is now well documented [14,15]. All mutations reported to date are found within the 870-bp coding region of the NAT2 gene. Among the seven single nucleotide polymorphisms (SNPs) that are commonly found in human populations, four result in an amino acid substitution that leads to a significant decrease in acetyla-tion capacity (single base-pair substituacetyla-tions at posiacetyla-tions 191, 341, 590, 857). The other three are either silent mutations (C282T, C481T) or a non-synonymous substi-tution that does not alter phenotype (A803G).
In the consensus gene nomenclature of human NAT2 that encompasses all currently recognized alleles [16,17], sets
of SNPs located throughout the coding region are linked in terms of haplotypes, that is they are organized as they segregate together on one individual's chromosome at the NAT2 locus. Each combination of SNPs identified so far constitutes a distinct haplotype that is treated as an allele of the haplotype system. The consideration of multilocus haplotypes seems more desirable since there is growing evidence that for genes containing multiple SNPs in high linkage disequilibrium (LD) such as NAT2 [18], haplo-type structure rather than individual SNPs can be the prin-cipal determinant of phenotypic consequences [19-21]. A functional polypeptide is indeed the product of a haplo-type, covering the entire coding region and coded by a sin-gle chromosome.
The NAT2 alleles described so far contain up to four of the acknowledged mutations in various combinations. Each allele is associated with an acetylator phenotype depend-ing on which mutations they contain: for instance, substi-tutions at positions 191, 341, 590, and 857 are diagnostic for defective NAT2 function and hence for the slow acetylator phenotype (Table 1). Three NAT2 phenotypes have been described: subjects with two low activity alleles are classified as slow acetylators, while those with two functional alleles are considered rapid acetylators. If only one allele is of the slow type, an intermediate phenotype is observed. Many early studies did not distinguish between fast and intermediate acetylators, categorizing both types of subjects as fast acetylators.
Table 1: The major human NAT2 alleles and their associated phenotypea.
Allele Nucleotide change b Phenotype
G191A C282T T341C C481T G590A A803G G857A
NAT2*4 rapid NAT2*5A x x slow NAT2*5B x x x slow NAT2*5C x x slow NAT2*6A x x slow NAT2*6B x slow NAT2*7A x slow NAT2*7B x x slow NAT2*12A x rapid NAT2*12B x x rapid NAT2*13 x rapid NAT2*14A x slow NAT2*14B x x slow
Nucleotide substitutions shown in bold have a functional consequence on enzyme activity. Bold-faced alleles contain functional polymorphisms and are hence associated with the slow acetylator phenotype. Classification of NAT2 alleles into different clusters is based on the most functionally significant nucleotide substitution present: the NAT2*5, NAT2*6, NAT2*7 and NAT2*14 clusters possess signature nucleotide substitutions at positions 341, 590, 857 and 191, respectively and are hence all decreased function alleles ('slow alleles'). The others display enzymatic activity comparable to the rapid acetylator allele NAT2*4. There are significant interethnic differences in NAT2 allele distribution and frequency [14, 15].
a Adapted from Hein et al. [3]. NAT2 nomenclature is accessible on the internet at website http://www.louisville.edu/medschool/pharmacology/
NAT.html
Problems may occur when individual multi-site NAT2 genotypes have to be assigned correctly to a particular combination of two multilocus haplotypes. Indeed, cur-rent routine genotyping and sequencing methods typi-cally do not provide haplotype information in diploid organisms such as humans, and the gametic phase of hap-lotypes is inherently ambiguous when individuals are het-erozygous at more than one locus. As illustrated in Figure 1, a subject carrying two inactivating mutations can be either rapid or slow acetylator depending on whether these mutations are located in the same or different chro-mosome, respectively. It is thus crucial to unequivocally assess mutation linkage patterns, this step being a prereq-uisite to obtain accurate haplotype frequency estimates in populations and reliable genotype-phenotype predictions.
However, in spite of its high relevance, this issue has not been handled properly by most past studies investigating
NAT2 polymorphisms. Early genotyping studies only screened for the presence of three polymorphisms (C481T, G590A, G857A), and a subject was defined as a slow acetylator if he was homozygous for one, or hetero-zygous for two (each located on one DNA strand), of this three nucleotide changes. Such a definition assumed that there could be no single allele with two or more of the tested mutations. In other studies that screened a larger number of SNPs within NAT2, patterns of LD between point mutations were often assumed, in reference to the haplotypes previously described and which are com-monly found in populations of European origin. For instance, the designation of NAT2 alleles is usually based on the assumption that 481T and 803G are strongly linked to 341T, and 590A and 857A are linked to 282T [22]. However, in rare cases the typical allelic linkage pat-tern of mutations may be disrupted because of genetic recombination and this may result in misclassification of alleles. Indeed, although such assumed linkage patterns are very strong, other allelic variants carrying either unu-sual combinations of mutations or mutations in isolation have been described in a few cases [23]. Furthermore, the designation of NAT2 alleles in such a way that it necessar-ily conforms to the existing consensus nomenclature of acknowledged haplotypes precludes the disclosure of unexpected combinations of mutations, different from the established allelic variants, and hence, the discovery of new alleles. Such a manner of inferring haplotypes from unphased multilocus genotypes may introduce biases in NAT2 allele designation and individual phenotype pre-diction, and these potential biases are of higher magni-tude when non-European populations are concerned. Most studies assumed particular patterns of linkage previ-ously described in populations of European origin, but which may not hold in other ethnic groups. Indeed, recent works have shown that patterns of LD can differ markedly among populations with different ethnic and demo-graphic backgrounds. As an example, Loktionov and col-leagues [24] pointed out the high occurence of isolated mutations 803G and 282T (defining alleles NAT2*12A and NAT2*13, respectively) in Black South Africans, while these nucleotide changes are almost always tightly linked to other mutations in European populations [25]. Like-wise, Dandara et al. [26] recently identified a novel muta-tion linkage pattern (NAT2*6E) that appeared to be common in three African populations and that had not yet been reported in Europeans. As well, Anitha et al. [27] revealed a new combination of acknowledged mutations (NAT2*5G) in the Malapandaram tribe of South India that has not been described so far in any other world pop-ulation. The genotype-phenotype discordance observed in many ethnic groups where mutation linkages have not been extensively proven experimentally might result from such unexpected compound alleles. It is thus necessary to systematically verify the postulated allelic combinations.
The ambiguous gametic phase of haplotypes for a given multi-locus genotype
Figure 1
The ambiguous gametic phase of haplotypes for a given multi-locus genotype. To illustrate the relevance of linkage phase ascertainment, let us consider the following case of a four-site heterozygous individual at positions 191, 341, 481 and 803 within the NAT2 coding sequence. Eight possible combi-nations of haplotypes can be inferred from this multilocus genotype, two of whom are shown here. Depending on the location of mutations to either DNA strand, the individual's NAT2 genotype composed of two multilocus haplotypes will not be the same. Moreover, an incorrect resolution of muta-tion linkage patterns may entail an error in individual pheno-type prediction: the subject will be classified either as a slow or as a rapid acetylator depending on the haplotypic combi-nation chosen. Symbol (*) points at mutations leading to a decrease in NAT2 enzyme activity, while symbol (×) indicates those with no impact on the acetylator phenotype.
*5B *14A *14C *4
191 191or
341 341 481 481 803 803Individual with a rapid acetylator genotype NAT2*4 / NAT2*14C (one ‘rapid’ allele)
Individual with a slow acetylator genotype NAT2*14A / NAT2*5B
To avoid such potential problems, many authors designed special analytical techniques to unequivocally determine the allocation of mutations to either DNA strand. Molec-ular methods using combinations of mutation-specific polymerase chain reaction (PCR) reamplification coupled to restriction mapping of the PCR products have been developed; these allow the separate analysis of each allele in order to obtain a complete map of both genes in every individual. Some studies applied these procedures to all multiply heterozygous subjects [24,28-31], while others limited their application to particular cases as those where an alternative linkage pattern of mutations would lead to a change in phenotype [5,27,32-36]. However, these experimental methods of molecular haplotyping are not entirely satisfying because they entail an additional cost and are currently labour-intensive, time-consuming, prone to experimental errors and difficult to automate. Therefore, they do not appear to be good candidates for routine clinical applications and for a generalization at a large scale.
A cheap and relatively straightforward alternative for hap-lotype reconstruction based on genotype data from unre-lated individuals is the use of computational algorithms. The most widely used algorithms developed so far are based either on a parsimony, a maximum-likelihood, or a Bayesian approach (see [37] for a review). In the last dec-ade, numerous investigations based on empirical data and extensive simulation studies have demonstrated that such in silico haplotype-inference methods could give effective and accurate prediction of haplotype phases, especially in regions with high LD values between polymorphic sites and small probabilities of recombination events [18,38,39]. Therefore, they could be fairly efficient alter-natives to molecular-haplotyping methods when applied to NAT2 gene data. Surprisingly, to our knowledge, only three studies have used computational methods to recon-struct NAT2 haplotypes and estimate allele frequencies in population samples [40-42]. One explanation for such limited use may be the lack of evidence documenting the performance of in silico approaches when applied to actual NAT2 data. Indeed, the accuracy of these strategies, compared with molecular methods, needs to be assessed before their applications can be advocated at a large scale. A recent study provided preliminary results on this issue: Xu and colleagues [18] empirically evaluated and com-pared the accuracy of the Clark's algorithm [43], the expectation-maximisation (EM) algorithm and a Bayesian method implemented in the PHASE program [44] in phase inference at NAT2, taken as an example of a locus with pronounced LD over a 850-bp region. In this study, NAT2 haplotypes (consisting of five genotyping SNPs at position 282, 341, 481, 590, and 803 nt) were experimen-tally determined through cloning and sequencing in 81 individuals of European ancestry. They found that all
three computational methods provided remarkably accu-rate and reliable estimates for NAT2 haplotype frequen-cies and individual haplotype phases.
The objective of the present study was to extend this inves-tigation to more precisely assess the performance of the computational approach. We conducted an extensive study based on experimental data from a larger number of samples, issued from populations of various ethnic origin, and tested for haplotypes involving the seven major poly-morphic loci of NAT2. Furthermore, the larger population samples investigated are of greater significance: as the sample size grows, there is more opportunity to observe rare haplotypes that are the most difficult to infer statisti-cally. This comparative study is designed to evaluate the performance of different haplotyping algorithms and to assess the consistency of their estimates. In addition, it provides information on the impact of various data-set characteristics (sample size, haplotype frequency distribu-tion, haplotype frequencies, deviation from Hardy-Wein-berg (HW) equilibrium, ...) on estimation accuracy; we then explore the utility of data-based diagnostics for assessing probable accuracy.
Results
Molecular haplotyping of the NAT2 locus revealed between eight and twelve distinct haplotypes in each of the five population samples investigated. The theoretical maximum number of haplotypes for a set of seven bial-lelic variable sites is 128 (27) if there is random associa-tion between polymorphic sites, whereas it is only 8 in the absence of recombination, recurrent and back mutation. Hence, the small number of haplotypes observed at NAT2 suggests strong LD over the short physical distance span-ning this gene. Indeed, we observed complete or near complete LD for all pairs of SNPs with sufficiently high frequencies (only alleles with frequencies in the range 0.05–0.95 were included in the analysis because estimates of LD for low-frequency alleles in small samples are not informative): 85% of all pairwise r2 values were highly sig-nificant (Exact p-value <0.0001). Although LD patterns were rather similar among the different population sam-ples, substantial differences in LD levels were observed (Figure 2): the Korean sample, and especially the South African sample, displayed much smaller values of average pairwise r2 (0.27 and 0.20, respectively) than the two European and the Nicaraguan samples (values between 0.39 and 0.57), for which a strong haplotypic structure was observed.
Among the 1608 individuals investigated over the five data sets, 45.5% (732/1608) were either homozygous for all SNP sites or heterozygous at only one SNP site; thus, their haplotype pairs could be assigned directly. Besides, 35.7% (574), 10.0% (160), 0.9% (15), and 7.9% (127)
individuals were heterozygous at two, three, four and five SNP sites, respectively. We inferred their haplotype phases with four computational haplotyping methods, and compared the results with those obtained through molec-ular haplotyping.
Since the Hapar program often provided several equally parsimonious solutions for a given multilocus genotype, it could not resolve a relatively large fraction of hetero-zygous individuals in each sample and hence, we could not deduce frequency estimates for the haplotypes
Linkage disequilibrium (r2 value) between SNP markers in the NAT2 locus
Figure 2
Linkage disequilibrium (r2 value) between SNP markers in the NAT2 locus. Graphical representation of the disequilibrium matrices obtained through computation of the r2 coefficient between each pair of markers, for the Spanish, Korean and Black South African samples. The British and Nicaraguan samples provided patterns and levels of LD comparable to those of the Spanish data. For each marker pair, GOLD [60] plotted the color-coded pairwise r2 statistics at the Cartesian coordinates cor-responding to marker location, and the plots were completed by interpolation. These graphs point out the strong level of LD between markers at positions 341, 481, and 803, as well as between SNPs located at 282 and 590: these markers are thus strongly predictive of one another. In Black South Africans, LD patterns are less pronounced and more diffuse across marker pairs.
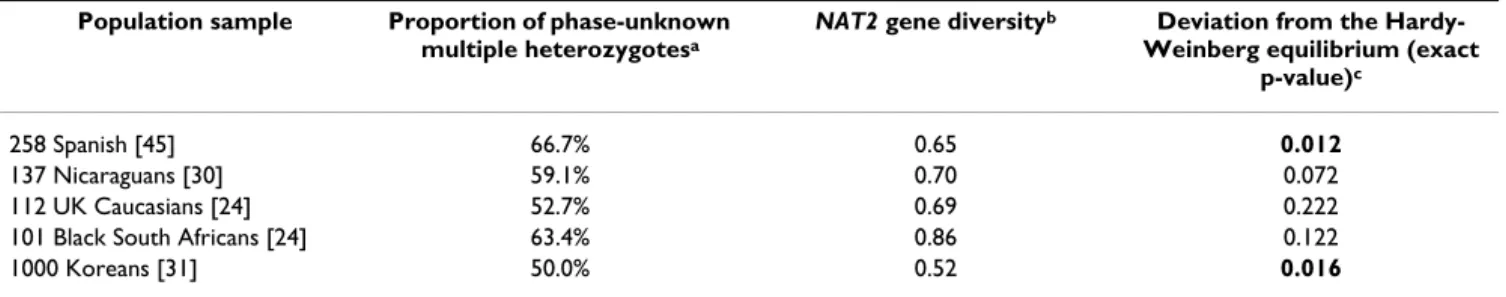
Table 2: The five phase-resolved NAT2 molecular data sets investigated.
Population sample Proportion of phase-unknown
multiple heterozygotesa
NAT2 gene diversityb Deviation from the
Hardy-Weinberg equilibrium (exact
p-value)c
258 Spanish [45] 66.7% 0.65 0.012
137 Nicaraguans [30] 59.1% 0.70 0.072
112 UK Caucasians [24] 52.7% 0.69 0.222
101 Black South Africans [24] 63.4% 0.86 0.122
1000 Koreans [31] 50.0% 0.52 0.016
All population samples were genotyped for the same seven nucleotide changes (G191A, C282T, T341C, C481T, G590A, A803G, G857A), except Koreans where the C190T mutation was investigated instead of G191A.
aProportion of multiply heterozygous individuals with ambiguous genotype whose phase has been resolved molecularly.
bExpected heterozygosities for the NAT2 haplotyped system were estimated as where n is the number of gene copies in the
sample, and pi is the sample frequency of the i-th haplotype.
cThe significance of deviations from Hardy-Weinberg equilibrium was tested for genotypic data with known gametic phase using the
random-permutation procedure implemented in the Arlequin package [51]: a Fisher's exact test using a Markov chain random walk algorithm was performed for each data set. The resulting p-values were considered significant if inferior to 0.05 (significant p-values are shown in bold).
101 Black South Africans 1000 Koreans 258 Spanish n n-1 pi 2 1−
(
∑
)
observed. Therefore, we evaluated Hapar only on its abil-ity to identify the set of haplotypes present in a sample.
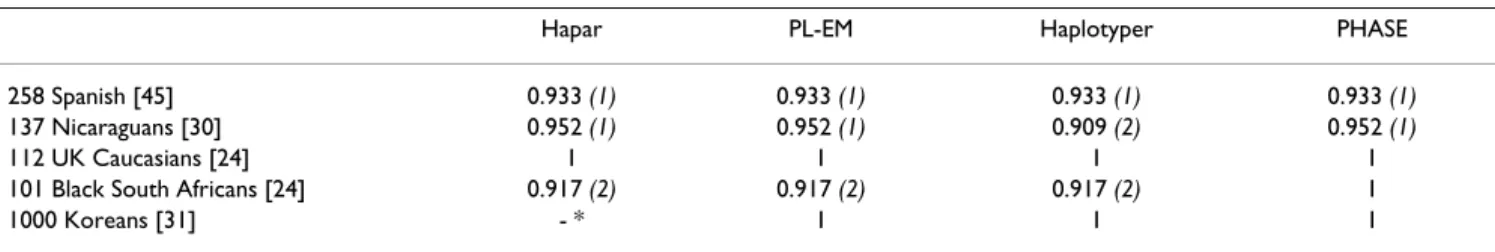
Haplotype identification
Hapar found for each sample the smallest set of haplo-types that could explain the genotype data, and PL-EM, Haplotyper and PHASE provided the list of all the haplo-types selected to appear in at least one of the subjects in the "best" reconstruction, that is when the most likely pair of haplotypes is selected for each individual. The IH indi-ces of the four programs are displayed for each population sample in Table 3. For the British and Korean samples, all computational methods identified exactly the same hap-lotypes as those determined experimentally. In contrast, in the other three samples, the algorithms sometimes inferred one additional haplotype, that was not actually present, and/or missed one haplotype that was shown to be present by means of molecular haplotyping. Neverthe-less, these prediction errors always concerned rare haplo-types of frequency <0.75% (singletons in most cases). The PHASE algorithm performed the best.
Prediction of individual haplotype phases
We also evaluated and compared the effectiveness of the computational methods in reconstructing haplotype pairs for individuals. Table 4 gives, for each data set and for each algorithm, the individual error rate. Whatever the method, the number of incorrectly reconstructed individ-uals was remarkably low, with error rates always under
4%. The largest number of mistakes were observed for the African sample and, among the three algorithms tested, PHASE yielded the lowest error rates. Furthermore, it is interesting to note that, in all cases of incorrectly predicted phases, there was no impact on phenotype prediction. Thus, despite these errors, the proportions of slow, inter-mediate and rapid acetylators in each population sample
Table 3: Performance of the four computational methods in haplotype identification, as measured by the IH index.
Hapar PL-EM Haplotyper PHASE
258 Spanish [45] 0.933 (1) 0.933 (1) 0.933 (1) 0.933 (1) 137 Nicaraguans [30] 0.952 (1) 0.952 (1) 0.909 (2) 0.952 (1)
112 UK Caucasians [24] 1 1 1 1
101 Black South Africans [24] 0.917 (2) 0.917 (2) 0.917 (2) 1
1000 Koreans [31] - * 1 1 1
Numbers in brackets indicate the number of haplotypes for which an error of prediction was made. * The size of the Korean sample was too large to be correctly handled by the Hapar program.
Table 4: Individual error rate in haplotype reconstruction
PL-EM Haplotyper PHASE
258 Spanish [45] 0.39% 0.39% 0.39%
137 Nicaraguans [30] 2.19% 3.65% 2.19%
112 UK Caucasians [24] 0.89% 0% 0%
101 Black South Africans [24] 3.96% 3.96% 2.97%
1000 Koreans [31] 0.30% 0.30% 0.30%
The individual error rate is defined as the ratio of erroneous phase calls to the total number of phase calls (see text).
Table 5: Index of similarity (IF) between haplotype frequencies estimated with and without molecular haplotyping information.
PL-EM PHASE
258 Spanish [45] 0.996 0.996 137 Nicaraguans [30] 0.986 0.986 112 UK Caucasians [24] 0.994 0.998 101 Black South Africans [24] 0.981 0.988 1000 Koreans [31] 0.997 0.998
Computations of IF indices were based on the haplotype frequency
estimates obtained by considering all possible haplotype
configurations (with a nonzero probability) inferred for each subject, weighted by their estimated probability. Note that such estimates can be rather different from those obtained by gene counting on the basis of the "best" reconstruction (that is, when only the most probable pair of haplotype is selected for each sampled individual). Since Haplotyper only provides a summary of the frequency with which each haplotype occurred in the "best" reconstruction, it was excluded from the comparison.
were in 100% agreement with those deduced from molec-ular haplotyping.
Estimation of haplotype frequencies
A comparison of the haplotype frequencies determined molecularly with those estimated computationally showed very high concordance. Both PL-EM and PHASE methods provided similarity index (IF) values very close to the maximal value of 1 in all investigated data sets (Table 5). Such high values may be explained by the fact that the IF index gives more weight to common haplotypes whose frequencies are the most accurately estimated by compu-tational algorithms. To investigate the effect of haplotype frequency on estimation accuracy, we plotted the change coefficient (C) against the larger of the two haplotype frequencies (Max [ , p0i]), for all possible haplotypes with nonzero frequency estimates determined by either analysis in any of the five population samples. As shown
in Figure 3, substantial percentage changes >30% occur only at the lowest haplotype frequencies (<0.007). Even the moderate changes (range 10%–30%) occur only when the frequency estimates are <0.03, and any change in per-centage value >5% concerns only haplotype frequencies <0.035. Two-thirds (67%) of the haplotype frequency estimates showed either no change or a small change (< 3%). In Table 6, we compared the relative estimation accuracy of PL-EM and PHASE programs by computing the average change coefficient for three classes of haplo-type frequencies. The two methods perform similarly for haplotypes with frequencies >0.05, whereas PHASE pro-vides more accurate estimates when rarer haplotypes are concerned.
Partially resolved data sets
We also performed similar analyses on six other previ-ously published data sets, in which linkage phase patterns were only partially resolved by molecular haplotyping. These data concerned 844 German [32], 248 Polish [33], 303 Turkish [34], 50 non-caste Dogons from Mali, 52 Gabonese and 60 Caucasians [5]. Haplotype phase infor-mation was available for 41%–74% individuals in these six population samples (including phase-resolved geno-types as well as non ambiguous homozygous or simply heterozygous genotypes). The PHASE algorithm was applied on the unphased genotype multilocus data of each of these samples, and a 100% concordance was observed between individual haplotype phase reconstruc-tion through the computareconstruc-tional method and the empiri-cally determined linkage patterns, for all investigated data sets (data not shown). This means that, despite the efforts invested, in terms of work, time and money, to resolve mutation linkage phase in a part of each sample, no more information was added by molecular haplotyping than what could be extracted from computational algorithms applied to these data.
Discussion
This empirical study demonstrates how closely the fre-quencies computationally estimated from phase-unknown data approximate those from gene-counting estimates based on phase-known data. In the particular case of the NAT2 gene, where there is near complete LD between SNPs within the coding region, all in silico approaches provided highly effective and accurate esti-mates for haplotype frequencies and individual haplotype phases. Estimated frequencies of common haplotypes were nearly identical to those empirically determined, whereas rare haplotypes were occasionally miscalled when their presence/absence had to be inferred. As already pointed out by Stephens et al. [44] and Lin et al. [39] and confirmed in this study, lower-frequency variants are less easily estimated statistically; indeed, there is less contextual information about phase for singletons versus
The change coefficient (C) as a function of haplotype frequency
Figure 3
The change coefficient (C) as a function of haplotype fre-quency. The change coefficient reflects the discrepancy between haplotype frequencies deduced from phase-known data and those estimated computationally (here with the PHASE program). All haplotypes occurring in any of the five population samples are considered.
Table 6: Average change coefficients of PL-EM and PHASE programs computed for three classes of haplotype frequency.
Haplotype frequency < 1% 1–5% > 5% PL-EM 30.6% 8.3% 1.2% PHASE 17.4% 6.8% 1.2% Haplotype frequency C h a n g e co ef fi ci en ti 0 1 .9 .8 .7 .6 .5 .4 .3 .2 .1 0 .1 .2 .3 .4 .5 .6 .7 .8 ˆpi
nonsingletons. Thus, for those research questions for which the NAT2 common haplotypes are most important, frequency estimates based on the unphased SNP-typing results from unrelated individuals will be sufficient. How-ever, accurate identification of rare haplotypes may be critical for many researchers, such as population geneticists interested in detecting features of recent demo-graphic history that are population-specific or signatures of selective effects in NAT2 sequences; as well as for epide-miologists and clinicians concerned with the possibility that rare haplotypes may be important for disease risk or for predicting drug response. In such cases, molecular haplotyping will be necessary to determine linkage phase unambiguously [57].
For a locus such as NAT2 where a strong haplotypic struc-ture is observed, all algorithms provided highly effective and accurate results for haplotype reconstruction. Thus, such "ideal" data for statistical inference did not permit to properly discriminate between the different methods investigated. Nevertheless, despite roughly similar per-formances, slightly better results were observed with the PHASE program. In particular, PHASE outperformed the other programs when frequencies of rare haplotypes have to be inferred. This is consistent with the results of some previous studies which evaluated and compared the per-formance of several algorithms on both empirical and simulated data [44,54,61]. PHASE provided the most accurate reconstructions, probably because the true hap-lotypes conformed more closely to the assumptions of the approximate coalescent prior than to those of the Dirich-let prior.
Many factors may influence the estimation accuracy of computational approaches. They can be assessed empiri-cally within a dataset, to be further used as "diagnostics" for predicting potential inaccuracies in estimation caused by features in the relevant data set [38].
Sample size did not appear to have a large effect on the haplotype frequency estimates comparing phase-known and phase-unknown results for the five data sets included in this study. Perhaps the low error rate observed in Kore-ans is partly due to the huge size of this sample (1000 individuals): an improvement in accuracy of the estima-tion procedure with increased sample size is indeed expected since information redundancy in the form of multiple copies of the same haplotype in the data set is required for the statistical algorithms to work properly [38,48]. On the other hand, computational methods may also perform best in small samples, in which there is little chance to observe rare haplotypes that are the most diffi-cult to infer statistically. Nevertheless, since the number of new haplotypes is not expected to increase linearly with sample size, the analysis of sufficiently large samples
should guarantee a good reliability in the resulting estimates.
Although most of the tested algorithms assume HW equi-librium, significant departures from HW proportions did not seem to have any impact on the accuracy of their pre-dictions. HW equilibrium holds well for the Nicaraguan, UK Caucasian, and Black South African samples (nonsignificant results), whereas the genotype distribution in the Spanish and Korean samples show sig-nificant departures from HW proportions (Table 2). The data sets investigated are not the most suitable to evaluate the effect of a deviation from HW equilibrium: significant results for tests of HW ratios are quite close to the thresh-old value (5%), and in the case of the Korean sample, an excess homozygosity is observed, which should not com-promise the algorithm performance. Indeed, in such a case, there is a balance between loss of accuracy caused by violation of HW equilibrium and gain of accuracy caused by the decrease in missing phase information through an excess of homozygotes [38,62].
Among the five data sets investigated in this study, Black South Africans displayed the highest error rate in haplo-type computational inference. One possible explanation may be the presence in this sample of a large number of different multiple heterozygotes with ambiguous multilocus genotypes, occurring at roughly similar fre-quencies (this is reflected in the high NAT2 gene diversity displayed by this population sample (Table 2)). Indeed, both the number of different ambiguous multiple hetero-zygous genotypes and their relative frequencies have been shown to be of high importance in the assessment of hap-lotype estimation accuracy [57]: both would be good indi-cators of the difficulty level of a given data set for haplotyping algorithms. The existence of many different multilocus genotypes uniformly distributed implies that many different haplotypes occur at low frequency, and that, consequently, greatest error and uncertainty occur in the estimation of haplotype frequencies (since no single haplotype is overwelmingly frequent). In contrast, the presence of a small number of multiple heterozygous genotypes at proportionately high frequencies implies that some individual haplotypes exist at high frequencies, and the estimation of those haplotype frequencies will be easier and accomplished with greater accuracy [38,57]. In such cases, molecular haplotyping may add little informa-tion for the resoluinforma-tion of haplotype phases.
The amount of LD between SNP markers may be another determining factor for the prediction of estimation relia-bility since when multiple polymorphic sites display little disequilibrium, as was observed in the African sample compared to the others, a large proportion of the chromo-somes may occur as uncommon or rare haplotypes,
implying a greater difficulty level in the statistical infer-ence of haplotypes.
Therefore, we advocate to examine beforehand the unphased NAT2 genotype data for both the frequency dis-tribution of multiply heterozygous genotypes and the level of LD between polymorphic markers; this will allow to assess the difficulty level displayed by the data set for statistical inference, and hence, to predict the ability and accuracy with which computational algorithms would infer haplotype phases from such data.
Of course, statistical methods can be used in conjunction with experimental methods to provide more accurate esti-mates of individual haplotypes. It has been claimed that the ability of certain computational methods to accurately assess the uncertainty associated with each phase call gives them the substantial practical advantage of allowing experimental effort to be directed at sites and/or individu-als whose phases are most difficult to reconstruct statisti-cally or that are critical to the conclusions of the study [20,44,61]. However, in our study, we observed that most erroneous phase calls inferred at the individual level were strongly supported, with a probability close to the maxi-mal value of 1. Thus, these errors could not have been avoided since they would not have been selected for the molecular targeting. This stresses why, in the case of the discovery of a novel NAT2 allele through computational haplotyping methods, the unusual linkage pattern should always be confirmed by cloning and sequencing the allele under question, as advocated by Cascorbi and Roots [25] for novel allelic combinations detected by molecular techniques.
Throughout this study, we assumed that the NAT2 linkage patterns molecularly determined were the "true" ones, and hence, that there was no error in the haplotype assig-ments based on experimental methods. However, molec-ular techniques may have experimental error rates as high as the rate of statistical error associated with the computa-tional haplotype determination algorithms [19]. Indeed, molecular haplotyping bears the risk of false positive or false negative allele-specific amplification (because of the nucleotide-dependent specificity of that technique) as well as uncomplete or non-specific digestions with the enzymes used in restriction analyses [25]. In the present study, we have estimated the computational error rates to be of no more than 3–4% for all investigated algorithms. This is not higher than the corresponding error rate from molecular haplotyping techniques, on the order of 2–3% [20]. Therefore, it is difficult to determine whether the dis-crepancies observed between experimental and computa-tional estimates are actually due to statistical errors from algorithms; they may be due to technical errors during
manipulations and the molecular data used as a reference for comparisons might be wrong.
The disadvantage of in silico approaches is that algorith-mic techniques are statistical and require the analysis of a population rather than a single individual. This is not a limitation in clinical trials and epidemiological surveys, which are always performed on a cohort basis. In clinical pharmacy, however, if a specific individual's haplotypes are of interest to predict his response to drug treatment, his unphased multilocus genotype must be combined with a standard reference set of haplotypes to infer the phasing [20]. This implies a thorough knowledge of the NAT2 genotypic distribution in the ethnic population from which this individual was drawn.
Conclusion
This study demonstrates that computational methods can provide an effective and accurate prediction of haplotype phases, in the particular case of the NAT2 gene which dis-plays high values of LD between polymorphic sites. The objective of this study is not to advocate the systematic use of computational approaches for NAT2 haplotype inference at the expense of molecular haplotyping meth-ods. We are convinced that these last ones remain the most reliable and effective way to resolve linkage phase patterns and that they can produce, for a fixed sample size, much more precise estimates of haplotype frequencies than other approaches [63]. However, the considerable effort required to obtain and analyse individual chromo-somes make alternative designs preferable; and the in sil-ico approach appears to be the most practical one. Thus, for researchers not willing to invest time and money in the preliminary step of NAT2 haplotype reconstruction, the use of computational algorithms constitutes a safe and effective way to get reliable haplotypic data on which fur-ther analyses could be carried on. Once haplotypes are constructed, various statistical methods can be applied on NAT2 haplotype data to detect allele-disease associations or to classify patients according to their acetylation status.
Methods
NAT2 molecular data sets
To evaluate the performance of in silico approaches in NAT2 haplotype reconstruction, we based our study on data collected from the literature, for which linkage phase was resolved directly through molecular haplotyping. Molecular data from five previously published data sets were analysed: they concerned 258 Spanish from Central Spain [45], 137 Nicaraguans with a Central American Indian-European mixed origin [30], 112 British from the Cambridge area [24], 101 Black South Africans (mostly Tswana-speaking people) [24], and 1000 Koreans [31]. All subjects included in these studies were randomly selected, unrelated healthy volunteers whose ethnic origin
had been clearly defined. In each population sample, seven SNPs were typed at NAT2 for all individuals (no missing data), and mutation linkage phase of all multiply heterozygous individuals was resolved molecularly through allele-specific PCR and restriction mapping. A summary description of the data sets is given in Table 2. These data provide an opportunity to compare haplotype frequencies estimated by direct gene counting on experi-mentally haplotyped data with haplotype frequencies esti-mated by haplotyping algorithms when phase information is ignored.
Throughout this report, we will use the term «phase-known» to refer to the individual's genetic constitution for the NAT2 haplotyped system, including the linkage phase of the component SNP alleles. Whereas we will use the term "phase-unknown" to refer to an individual's multilo-cus genotype in the absence of phase information.
Computational haplotyping methods
We evaluated the ability of four population-based haplo-type inference methods to reconstruct NAT2 haplohaplo-types from the phase-unknown genotype data.
Hapar
The first method is based on maximum parsimony: it searches for a set of minimum number of haplotypes that explain the observed genotype samples. Clark's method, the first developed algorithm for haplotype reconstruc-tion [43] which can be viewed as a sort of parsimony approach, requires homozygote or single-site heterozy-gote in the sample to start its inferential cascade. Wang and Xu [46] overcame this limitation by designing an algorithm with a global optimization goal. This method, recently implemented in the Hapar program [46], was tested at its default settings on the phase-unknown NAT2 data.
PL-EM
We also applied the EM algorithm [47] to obtain the max-imum-likelihood estimates of haplotype frequencies in the samples, given the observed data [48-50]. This algo-rithm starts with initial arbitrary values of haplotype fre-quencies and iteratively updates the frequency estimates, to maximize the log-likelihood function, until conver-gence is reached. Several EM-based algorithms have been developed. We used three different implementations, Arlequin [51], HAPLO [49] and PL-EM [52], that all gave us identical results on comparable analyses (data not shown). Thus, we presented only the results obtained with the PL-EM program: this software implements an algorithm derived from the standard EM but incorporat-ing the computational strategy of partition-ligation [53] to handle a larger number of loci. We performed 50 inde-pendent runs with different initial conditions to
mini-mize chances of local convergence so as to ensure finding the global maximum likelihood estimates. For a given unphased genotype pattern, the probability of each possi-ble haplotype configuration was calculated by using the estimated population haplotype frequencies, and all com-patible haplotype phases with nontrivial probabilities were generated. The haplotype pair with the greatest prob-ability was considered to be the haplotype phase for each individual, and population haplotype frequencies were estimated as a function of each inferred haplotype pair, weighted by their estimated probability.
Haplotyper and PHASE
Finally, two Bayesian statistical methods based on Gibbs sampling procedure were applied to the phase-unknown NAT2 data. Such methods treat the unknown haplotypes as random quantities and combine prior information -beliefs about what sorts of patterns of haplotypes are expected to be observed in population samples- with the likelihood -the information in the observed data [54]. The conceptual difference between the two investigated Baye-sian algorithms lies in the prior information incorporated into the statistical model. The algorithm implemented in the Haplotyper program [53] uses a Dirichlet prior distribution, which assumes that the genetic sequence of a mutant offspring does not depend on the progenitor sequence [54]. Instead, the algorithm implemented in the PHASE program [44] uses a prior approximating the coa-lescent, which is one of the evolutionary models most commonly used in population genetics (see [55] for a review): it assumes that unresolved haplotypes will tend to be the same as, or similar to, known haplotypes. We employed the lastest version of PHASE (PHASE v 2.1 [54]) to evaluate the performance of this method, using the default parameter values in the Markov chain Monte Carlo simulations. For each data set investigated, we applied the algorithm ten times with different seeds for the random number generator, and checked for consistency of the results across the independent runs in order to verify that the algorithm did not converge to a local, rather than global, mode of the posterior distribution. We chose the results from the run displaying the best average goodness-of-fit of the estimated haplo-types to the underlying coalescent model. Besides, to eval-uate the Bayesian algorithm implemented in Haplotyper, we performed 20 independent runs of the program on each sample. This software could not be run directly on the 1000-Korean sample as it can only handle 500 indi-viduals at most per data set. To circumvent this limitation, we randomly generated ten pairs of complementary data sets, each composed of 500 individuals, and we ran Hap-lotyper on each of them. Results were averaged over the ten complete data sets. Both programs Haplotyper and PHASE provide a list of the most likely pairs of haplotypes for each subject. They also quantify the uncertainty
associated with each phase call by outputting an estimate of the probability that each call is correct. This prevents inappropriate overconfidence in statistically recon-structed haplotypes.
Measures of estimation accuracy
Computational algorithms of haplotype reconstruction may be used for many different purposes. We focus here on three particular tasks: finding the list of all haplotypes present in a sample, inferring the most likely pair of lotypes for each sampled individual, and estimating hap-lotype frequencies in the population. Thus, three different measures of accuracy were used to evaluate the perform-ance of the tested algorithms.
-haplotype identification
To assess accuracy in terms of haplotype identification, we used the IH index introduced by Excoffier and Slatkin [48]. It compares the number of different haplotypes detected experimentally with the number of different haplotypes inferred by the computer programs. We considered that a given haplotype is identified as being present in the true sample if its estimated frequency is above the threshold value of 1/(2n) in a population sample of n individuals. IH is given by:
where ktrue is the number of haplotypes in the true sample, kest is the number of estimated haplotypes with frequency above the threshold, and kmissed is the number of true hap-lotypes not identified in the sample.
Values of IH can vary between 1 (when the computational identified haplotypes are exactly the same as those deter-mined experimentally) to 0 (when none of the true hap-lotypes are identified computationally).
- reconstruction of the haplotypes of each sampled individual We specified the haplotype pair for an individual by choosing the most probable haplotype pair consistent with the individual's multilocus genotype. We measured performance by the individual error rate, which is the pro-portion of individuals whose haplotype pairs were incor-rectly inferred by the program [53].
- estimation of sample haplotype frequencies
To examine how close the computationally estimated haplotype frequencies are to the observed frequencies in the phase-known data, we used the similarity index IF of Renkonen [56], defined as the proportion of haplotype frequencies in common between the estimated and observed frequency distributions [18,48].
where and p0i denote, respectively, the estimated and observed sample frequency of the i-th haplotype. This measure incorporates all h haplotype frequencies and thus captures the overall difference between estimated and observed frequencies for a particular data set. It varies between zero, when true haplotypes have estimated fre-quencies tending to zero, and one, when observed and estimated frequencies are identical.
Since this index gives more weight to the high-frequency haplotypes, we used a second criterion to assess the accuracy of computational algorithms in haplotype fre-quency estimation: the change coefficient C, defined in Tishkoff et al. [57] as
where Max [ , p0i] indicates the maximum value of or p0i.
This coefficient measures the percentage change in haplo-type frequencies across the two information conditions (phase-known versus phase-unknown data). C coeffi-cients were computed for each possible haplotype in each population. The value of C ranges from 0 to 1, with 0 indi-cating that the estimated and observed frequency are iden-tical. The maximal value of 1 indicates that molecular haplotyping showed either the presence of a haplotype that was assigned a zero through computational haplotyp-ing, or vice versa.
Measure of pairwise LD between SNP markers
We used the phase-known data to quantify the amount of LD between all pairs of polymorphic sites by computing the correlation coefficient r2 [58] for each population sample separately. These statistics are expected to be 1 (perfect LD) when the variation is segregating in a popu-lation as only two distinct haplotypes. Statistical signifi-cance of LD between pairs of sites was assessed by Fisher's exact tests. Computations were performed with the soft-ware PowerMarker v3.21 [59], and a graphical summary of disequilibrium matrices was displayed by the GOLD program [60].
Abbreviations
Single nucleotide polymorphism (SNP) Expectation-Maximisation (EM) algorithm
I k k k k H true missed true est = − + 2( ) IF p pi i pi p i i h i h = = − − = =
∑
∑
min( , 0) | 0 |, 1 1 1 1 2 ˆpi C p p Max p p i i i i = | ( − ) | [ , ], 0 0 ˆpi ˆpiLinkage disequilibrium (LD) N-acetyltransferase 2 (NAT2)
Authors' contributions
AS participated in the conception and design of the study, in collection of data, in performing all the computational analyses, and in drafting the manuscript. PD participated in the design of the study, in interpretation of data and in revising the article critically for important intellectual con-tent. All authors read and approved the final manuscript.
References
1. Minchin RF, Reeves PT, Teitel CH, McManus ME, Mojarrabi B, Ilett KF, Kadlubar FF: N-and O-acetylation of aromatic and
hetero-cyclic amine carcinogens by human monomorphic and poly-morphic acetyltransferases expressed in COS-1 cells. Biochem Biophys Res 1992, 185:839-844.
2. Hein DW, Doll MA, Rustan TD, Gray K, Feng Y, Ferguson RJ, Grant DM: Metabolic activation and deactivation of arylamine
car-cinogens by recombinant human NAT1 and polymorphic NAT2 acetyltransferases. Carcinogenesis 1993, 14:1633-1638.
3. Hein DW: Molecular genetics and function of NAT1 and
NAT2: role in aromatic amine metabolism and carcinogenesis. Mutat Res 2002, 506–507:65-77.
4. Meisel P: Arylamine N-acetyltransferases and drug response.
Pharmacogenomics 2002, 3:349-366.
5. Delomenie C, Sica L, Grant DM, Krishnamoorthy R, Dupret JM:
Gen-otyping of the polymorphic N-acetyltransferase (NAT2*) gene locus in two native African populations. Pharmacogenetics
1996, 6:177-185.
6. Asprodini EK, Zifa E, Papageorgiou I, Benakis A: Determination of
N-acetylation phenotyping in a Greek population using caf-feine as a metabolic probe. Eur J Drug Metab Pharmacokinet 1998, 23:501-506.
7. Cartwright RA, Glashan RW, Rogers HJ, Ahmad RA, Barham-Hall D, Higgins E, Kahn MA: Role of N-acetyltransferase phenotypes in
bladder carcinogenesis: a pharmacogenetic epidemiological approach to bladder cancer. Lancet 1982, 2:842-845.
8. Risch A, Wallace DM, Bathers S, Sim E: Slow N-acetylation
geno-type is a susceptibility factor in occupational and smoking related bladder cancer. Hum Mol Genet 1995, 4:231-236.
9. Bialecka M, Gawronska-Szklarz B, Drozdzik M, Honczarenko K, Stankiewicz J: N-acetyltransferase 2 polymorphism in sporadic
Parkinson's disease in a Polish population. Eur J Clin Pharmacol
2002, 57:857-862.
10. Chan DK, Lam MK, Wong R, Hung WT, Wilcken DE: Strong
asso-ciation between N-acetyltransferase 2 genotype and PD in Hong Kong Chinese. Neurology 2003, 60:1002-1005.
11. Blum M, Grant DM, McBride W, Heim M, Meyer UA: Human
arylamine N-acetyltransferase genes: isolation, chromo-somal localization, and functional expression. DNA Cell Biol
1990, 9:193-203.
12. Ohsako S, Deguchi T: Cloning and expression of cDNAs for
pol-ymorphic and monomorphic arylamine N-acetyltransferases from human liver. J Biol Chem 1990, 265:4630-4634.
13. Blum M, Demierre A, Grant DM, Heim M, Meyer UA: Molecular
mechanism of slow acetylation of drugs and carcinogens in humans. Proc Natl Acad Sci 1991, 88:5237-5241.
14. Grant DM, Hughes NC, Janezic SA, Goodfellow GH, Chen HJ, Gae-digk A, Yu VL, Grewal R: Human acetyltransferase
polymorphisms. Mutat Res 1997, 376:61-70.
15. Upton A, Johnson N, Sandy J, Sim E: Arylamine
N-acetyltrans-ferases – of mice, men and microorganisms. Trends Pharmacol Sci 2001, 22:140-146.
16. Vatsis KP, Weber WW, Bell DA, Dupret JM, Evans DA, Grant DM, Hein DW, Lin HJ, Meyer UA, Relling MV, et al.: Nomenclature for
N-acetyltransferases. Pharmacogenetics 1995, 5:1-17.
17. Hein DW, Grant DM, Sim E: Update on consensus arylamine
N-acetyltransferase gene nomenclature. Pharmacogenetics 2000, 10:291-292.
18. Xu CF, Lewis K, Cantone KL, Khan P, Donnelly C, White N, Crocker N, Boyd PR, Zaykin DV, Purvis IJ: Effectiveness of computational
methods in haplotype prediction. Hum Genet 2002, 110:148-156.
19. Judson R, Stephens JC, Windemuth A: The predictive power of
haplotypes in clinical response. Pharmacogenomics 2000, 1:15-26.
20. Judson R, Stephens JC: Notes from the SNP vs. haplotype front.
Pharmacogenomics 2001, 2:7-10.
21. McDonald OG, Krynetski EY, Evans WE: Molecular haplotyping of
genomic DNA for multiple single-nucleotide polymorphisms located kilobases apart using long-range polymerase chain reaction and intramolecular ligation. Pharmacogenetics 2002, 12:93-99.
22. Zschieschang P, Hiepe F, Gromnica-Ihle E, Roots I, Cascorbi I: Lack
of association between arylamine N-acetyltransferase 2 (NAT2) polymorphism and systemic lupus erythematosus. Pharmacogenetics 2002, 12:559-563.
23. Agundez JA, Ladero JM, Olivera M, Lozano L, Fernandez-Arquero M, de laConcha EG, Diaz-Rubio M, Benitez J: N-acetyltransferase 2
polymorphism is not related to the risk of advanced alco-holic liver disease. Scand J Gastroenterol 2002, 37:99-103.
24. Loktionov A, Moore W, Spencer SP, Vorster H, Nell T, O'Neill IK, Bingham SA, Cummings JH: Differences in N-acetylation
geno-types between Caucasians and Black South Africans: impli-cations for cancer prevention. Cancer Detect Prev 2002, 26:15-22.
25. Cascorbi I, Roots I: Pitfalls in N-acetyltransferase 2 genotyping.
Pharmacogenetics 1999, 9:123-127.
26. Dandara C, Masimirembwa CM, Magimba A, Kaaya S, Sayi J, Sommers de K, Snyman JR, Hasler JA: Arylamine N-acetyltransferase
(NAT2) genotypes in Africans: the identification of a new allele with nucleotide changes 481C>T and 590G>A. Pharma-cogenetics 2003, 13:55-58.
27. Anitha A, Banerjee M: Arylamine N-acetyltransferase 2
poly-morphism in the ethnic populations of South India. Int J Mol Med 2003, 11:125-131.
28. Martinez C, Agundez JA, Olivera M, Martin R, Ladero JM, Benitez J:
Lung cancer and mutations at the polymorphic NAT2 gene locus. Pharmacogenetics 1995, 5:207-214.
29. Agundez JA, Olivera M, Martinez C, Ladero JM, Benitez J:
Identifica-tion and prevalence study of 17 allelic variants of the human NAT2 gene in a white population. Pharmacogenetics 1996, 6:423-428.
30. Martinez C, Agundez JA, Olivera M, Llerena A, Ramirez R, Hernandez M, Benitez J: Influence of genetic admixture on
polymor-phisms of drug-metabolizing enzymes: analyses of mutations on NAT2 and C gamma P2E1 genes in a mixed Hispanic population. Clin Pharmacol Ther 1998, 63:623-628.
31. Lee SY, Lee KA, Ki CS, Kwon OJ, Kim HJ, Chung MP, Suh GY, Kim JW: Complete sequencing of a genetic polymorphism in
NAT2 in the Korean population. Clin Chem 2002, 48:775-777.
32. Cascorbi I, Drakoulis N, Brockmoller J, Maurer A, Sperling K, Roots I: Arylamine N-acetyltransferase (NAT2) mutations and
their allelic linkage in unrelated Caucasian individuals: corre-lation with phenotypic activity. Am J Hum Genet 1995, 57:581-592.
33. Mrozikiewicz PM, Cascorbi I, Brockmoller J, Roots I:
Determina-tion and allelic allocaDetermina-tion of seven nucleotide transiDetermina-tions within the arylamine N-acetyltransferase gene in the Polish population. Clin Pharmacol Ther 1996, 59:376-382.
34. Aynacioglu AS, Cascorbi I, Mrozikiewicz PM, Roots I: Arylamine
N-acetyltransferase (NAT2) genotypes in a Turkish population. Pharmacogenetics 1997, 7:327-331.
35. Meisel P, Schroeder C, Wulff K, Siegmund W: Relationship
between human genotype and phenotype of N-acetyltrans-ferase (NAT2) as estimated by discriminant analysis and multiple linear regression:1. Genotype and N-acetylation in
vivo. Pharmacogenetics 1997, 7:241-246.
36. Kukongviriyapan V, Prawan A, Tassaneyakul W, Aiemsa-Ard J, War-asiha B: Arylamine N-acetyltransferase-2 genotypes in the
Thai population. Br J Clin Pharmacol 2003, 55:278-281.
37. Niu T: Algorithms for inferring haplotypes. Genet Epidemiol 2004, 27:334-347.
38. Fallin D, Schork NJ: Accuracy of haplotype frequency
estima-tion for biallelic loci, via the expectaestima-tion-maximizaestima-tion algo-rithm for unphased diploid genotype data. Am J Hum Genet
Publish with BioMed Central and every scientist can read your work free of charge "BioMed Central will be the most significant development for disseminating the results of biomedical researc h in our lifetime."
Sir Paul Nurse, Cancer Research UK
Your research papers will be:
available free of charge to the entire biomedical community peer reviewed and published immediately upon acceptance cited in PubMed and archived on PubMed Central yours — you keep the copyright
Submit your manuscript here:
http://www.biomedcentral.com/info/publishing_adv.asp
BioMedcentral
39. Lin S, Cutler DJ, Zwick ME, Chakravarti A: Haplotype inference in
random population samples. Am J Hum Genet 2002, 71:1129-1137.
40. Tanaka E, Taniguchi A, Urano W, Nakajima H, Matsuda Y, Kitamura Y, Saito M, Yamanaka H, Saito T, Kamatani N: Adverse effects of
sulfasalazine in patients with rheumatoid arthritis are asso-ciated with diplotype configuration at the N-acetyltrans-ferase 2 gene. J Rheumatol 2002, 29:2492-2499.
41. Jorge-Nebert LF, Eichelbaum M, Griese EU, Inaba T, Arias TD:
Anal-ysis of six SNPs of NAT2 in Ngawbe and Embera Amerindi-ans of Panama and determination of the Embera acetylation phenotype using caffeine. Pharmacogenetics 2002, 12:39-48.
42. Barrett JH, Smith G, Waxman R, Gooderham N, Lightfoot T, Garner RC, Augustsson K, Wolf CR, Bishop DT, Forman D: Investigation
of interaction between N-acetyltransferase 2 and heterocy-clic amines as potential risk factors for colorectal cancer. Carcinogenesis 2003, 24:275-282.
43. Clark AG: Inference of haplotypes from PCR-amplified
sam-ples of diploid populations. Mol Biol Evol 1990, 7:111-122.
44. Stephens M, Smith NJ, Donnelly P: A new statistical method for
haplotype reconstruction from population data. Am J Hum Genet 2001, 68:978-989.
45. Agundez JA, Olivera M, Ladero JM, Rodriguez-Lescure A, Ledesma MC, Diaz-Rubio M, Meyer UA, Benitez J: Increased risk for
hepa-tocellular carcinoma in NAT2-slow acetylators and CYP2D6-rapid metabolizers. Pharmacogenetics 1996, 6:501-512.
46. Wang L, Xu Y: Haplotype inference by maximum parsimony.
Bioinformatics 2003, 19:1773-1780.
47. Dempster AP, Laird NM, Rubin DB: Maximum likelihood from
incomplete data via the EM algorithm. J R Stat Soc 1977, 39:1-38.
48. Excoffier L, Slatkin M: Maximum-likelihood estimation of
molecular haplotype frequencies in a diploid population. Mol Biol Evol 1995, 12:921-927.
49. Hawley ME, Kidd KK: HAPLO: a program using the EM
algo-rithm to estimate the frequencies of multi-site haplotypes. J Hered 1995, 86:409-411.
50. Long JC, Williams RC, Urbanek M: An E-M algorithm and testing
strategy for multiple-locus haplotypes. Am J Hum Genet 1995, 56:799-810.
51. Schneider S, Roessli D, Excoffier L: Arlequin ver. 2.000: a
soft-ware for population genetics data analysis. Genetics and
Biom-etry Laboratory, University of Geneva, Switzerland; 2000.
52. Qin ZS, Niu T, Liu JS:
Partition-ligation-expectation-maximiza-tion algorithm for haplotype inference with single-nucle-otide polymorphisms. Am J Hum Genet 2002, 71:1242-1247.
53. Niu T, Qin ZS, Xu X, Liu JS: Bayesian haplotype inference for
multiple linked single-nucleotide polymorphisms. Am J Hum Genet 2002, 70:157-169.
54. Stephens M, Donnelly P: A comparison of bayesian methods for
haplotype reconstruction from population genotype data. Am J Hum Genet 2003, 73:1162-1169.
55. Hudson RR: Gene genealogies and the coalescent process. In
Oxford surveys in evolutionary biology Volume 7. Edited by: Futuyma D,
Antonovics J. Oxford University Press, Oxford; 1991:1-44. 56. Renkonen O: Statisch-ökologische Untersuchungen über die
terrestiche Kaferwelt der finnishen Bruchmoore. Ann Zool Soc Bot Fenn Vanamo 1938, 6:1-231.
57. Tishkoff SA, Pakstis AJ, Ruano G, Kidd KK: The accuracy of
statis-tical methods for estimation of haplotype frequencies: an example from the CD4 locus. Am J Hum Genet 2000, 67:518-522.
58. Devlin B, Risch N: A comparison of linkage disequilibrium
measures for fine-scale mapping. Genomics 1995, 29:311-322.
59. Liu K, Muse S: PowerMarker: new genetic data analysis
soft-ware. Version 3.0. Free program distributed by the author over the internet [http://www.powermarker.net].
60. Abecasis GR, Cookson WO: GOLD – graphical overview of
link-age disequilibrium. Bioinformatics 2000, 16:182-183.
61. Stephens M, Smith NJ, Donnelly P: Reply to Zhang etal. Am J Hum
Genet 2001, 69:912-914.
62. Osier M, Pakstis AJ, Kidd JR, Lee JF, Yin SJ, Ko HC, Edenberg HJ, Lu RB, Kidd KK: Linkage disequilibrium at the ADH2 and ADH3
loci and risk of alcoholism. Am J Hum Genet 1999, 64:1147-1157.
63. Zhao H, Pfeiffer R, Gail MH: Haplotype analysis in population
genetics and association studies. Pharmacogenomics 2003, 4:171-178.