catalysts
ArticleNanostructured Ceria-Based Materials: Effect of the
Hydrothermal Synthesis Conditions on the Structural
Properties and Catalytic Activity
Marco Piumetti, Samir Bensaid *, Tahrizi Andana, Melodj Dosa, Chiara Novara, Fabrizio Giorgis, Nunzio Russo and Debora Fino
Department of Applied Science and Technology, Politecnico di Torino, Corso Duca degli Abruzzi 24, 10129 Turin, Italy; marco.piumetti@polito.it (M.P.); tahrizi.andana@polito.it (T.A.); melodj.dosa@polito.it (M.D.);
chiara.novara@polito.it (C.N.); fabrizio.giorgis@polito.it (F.G.); nunzio.russo@polito.it (N.R.); debora.fino@polito.it (D.F.)
* Correspondence: samir.bensaid@polito.it; Tel.: +39-011-090-4662
Academic Editors: Agustín Bueno-López, Enrique Rodríguez-Castellón and Elisa Moretti Received: 7 April 2017; Accepted: 27 May 2017; Published: 2 June 2017
Abstract: In this work, several nanostructured ceria catalysts were prepared by means of a hydrothermal procedure, in which the synthesis conditions (i.e., temperature and pH values) were varied. CeO2samples of different shapes and structural properties were obtained, namely
cubes, rods, cube and nanorod mixtures, and other polyhedra. The prepared materials were tested using four probe catalytic reactions: CO oxidation, NO oxidation, NOx-free soot oxidation,
and NOx-assisted soot oxidation. The physicochemical properties of the prepared catalysts
were studied by means of complementary techniques (i.e., XRD, N2-physisorption at −196 ◦C,
CO-TPR (temperature-programmed reduction), field emission scanning electron microscopy (FESEM), micro-Raman spectroscopy). The abundance of defects of the catalysts, measured through in-situ Raman spectroscopy at the typical temperatures of each catalytic process, was correlated to the CO and NO oxidation activity of the prepared catalysts, while the soot oxidation reaction (performed in loose conditions), which was hindered by a poor soot-catalyst contact, was found to be less sensitive to the observed structural defects.
Keywords: ceria; nanostructures; hydrothermal; basicity; aging temperature; defect; catalytic oxidations; high temperature Raman spectroscopy
1. Introduction
Diesel and gasoline-type engines are important sources of outdoor air pollutants, such as volatile organic compounds (VOCs), NOx, and particulate matter (PM) [1–4]. Diesel particulate is suspected of
causing several health problems, including lung cancer, and as a result studies on diesel engine exhaust have received a great deal of interest over the last few years [1–8]. As a whole, the soot that forms diesel exhaust particulates can be burnt off above 600◦C, and diesel engine exhaust temperatures fall within the 200 to 500◦C range [9]. Thus, many solid catalysts have been developed to carry out oxidation processes at moderate temperatures. In this scenario, ceria-based catalysts have been used for several catalytic processes, i.e., diesel soot combustion, CO oxidation, and VOC abatement [1,4]. Among the physicochemical properties that favor the reactivity of ceria-based materials, both the redox capacity and the availability of surface oxygen species (oxygen storage capacity, OSC) are probably the most important ones [1]. Moreover, recent studies have shown that nanostructured ceria with (100) and (110) planes are usually more active for oxidation processes than conventional (polycrystalline) ceria nanoparticles (NPs) with the preferred exposure of (111) planes [10]. Thus, over the last few decades,
Catalysts 2017, 7, 174 2 of 18
there has been significant progress in the controlled synthesis of CeO2-based nanomaterials. Different
shapes and structures of CeO2-based catalysts have been synthesized using methods designed by
various research groups. In general, CeO2-NPs can be mentioned, because of their small (featured) size,
which endows them with size- and shape-dependent properties, due to the high surface-to-volume ratio (=high fraction of coordinatively unsaturated sites) and unique electronic features (quantum size effects) [11–16]. Therefore, the surface reactivity of CeO2-NPs depends not only on the crystal size,
but also on their shape and thus on their exposed planes. Moreover, the structural defects (i.e., anion Frenkel pairs and oxygen vacancies) can favor the mobility of charged species, such as electrons or oxygen anions in the solid, and they can therefore be considered pivotal for the generation of catalytic active centers [17,18].
On the other hand, soot-catalyst contact points also affect the soot oxidation activity, and it is therefore necessary to maximize the interaction between the soot particles and the catalyst surface [19].
In the present work, ceria nanomaterials, with different geometric and textural features (i.e., nanocubes, nanorods, high-surface area CeO2), were synthesized to investigate the relationship
between the synthesis conditions and their structural features, as well as their catalytic activities towards CO, NO, soot, and NOx-assisted soot oxidations. The physicochemical properties of the
prepared catalysts were studied by means of complementary techniques (i.e., XRD, N2-physisorption at −196◦C, CO-TPR (temperature-programmed reduction), field emission scanning electron microscopy (FESEM), micro-Raman spectroscopy).
2. Results
The nanostructured ceria samples were synthesized via a hydrothermal synthesis, using NaOH as the precipitating agent. In the present work, two synthesis parameters, namely basicity and aging temperature, were varied to obtain ceria with different shapes, i.e., nanocubes and nanorods.
2.1. Textural Properties
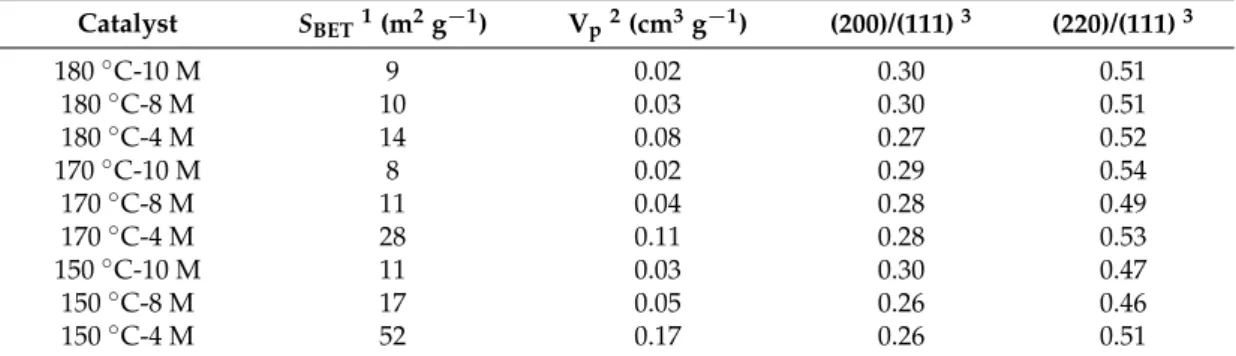
Some of the main physical features of the prepared samples, derived from N2physisorption at −196◦C and X-ray diffraction (XRD), are reported in Table1.
Table 1. Textural properties of the samples obtained from N2 physisorption at−196◦C and X-ray diffraction (XRD) analysis. Catalyst SBET1(m2g−1) Vp2(cm3g−1) (200)/(111)3 (220)/(111)3 180◦C-10 M 9 0.02 0.30 0.51 180◦C-8 M 10 0.03 0.30 0.51 180◦C-4 M 14 0.08 0.27 0.52 170◦C-10 M 8 0.02 0.29 0.54 170◦C-8 M 11 0.04 0.28 0.49 170◦C-4 M 28 0.11 0.28 0.53 150◦C-10 M 11 0.03 0.30 0.47 150◦C-8 M 17 0.05 0.26 0.46 150◦C-4 M 52 0.17 0.26 0.51
1Specific surface area measured by the Brunauer-Emmett-Teller (BET) method;2total pore volume;3XRD peak
intensity ratio.
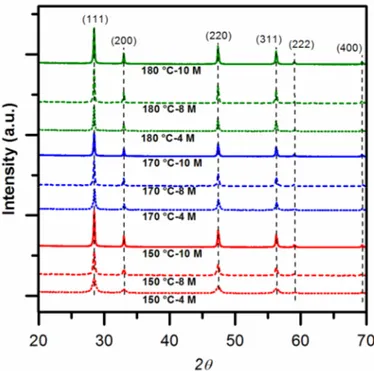
Figure1shows the XRD diffractograms of the catalysts. These samples exhibit similar patterns, as far as the cubic fluorite structure is concerned, and are marked by (the existence of) (111), (200), (220), (311), (222), and (400) planes [20,21]. The relative amount of the (110), (100), and (111) surfaces was estimated from the XRD peak intensity ratios. As reported in Table1, the (200)/(111) ratios have a tendency to increase as a function of the temperature (from 150 to 180◦C) and of the basicity values (NaOH concentration: from 4 to 10 M) adopted during the synthesis; this trend does not appear for the (220)/(111) ratios. On the other hand, the specific surface area (SBET) and the total pore volume (Vp)
Catalysts 2017, 7, 174 3 of 18
of the samples both decrease as the temperature and the NaOH concentration values grow. In other words, it appears that the worse textural properties of the catalysts are associated with more abundant (100) planes, unlike the (110) planes.
150 °C-8 M 17 0.05 0.26 0.46
150 °C-4 M 52 0.17 0.26 0.51
1 Specific surface area measured by the Brunauer-Emmett-Teller (BET) method; 2 total pore volume; 3
XRD peak intensity ratio.
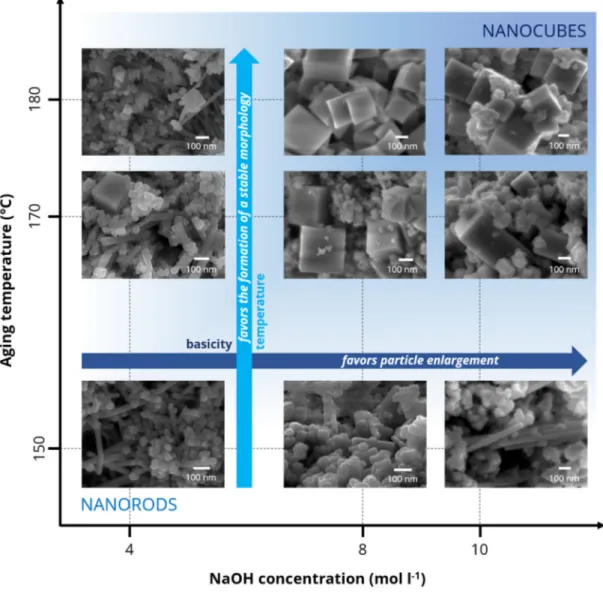
Figure 2 shows the FESEM micrographies of the samples prepared at different synthesis conditions: x-axis = aging temperature (150–180 °C); y-axis = NaOH concentration (4–10 M). As expected, both the aging temperature and the basicity influence the structural and textural properties of the nanostructured CeO2. It has in fact been observed that, the presence of nanorods (length = 300–500 nm) at lower NaOH concentrations (i.e., 4 M) prevails over the formation of nanocubes (length = 30–50 nm), regardless of the temperature used during the aging step. However, higher temperatures (i.e., 180 °C) seem to favor the creation of larger rods along with a few well-defined nanocubes (side ≈ 100 nm). Conversely, the higher basicity favors the development of well-defined cubes when the temperature ranges from 170 to 180 °C. Moreover, both the temperature and the basicity lead to larger and more stable CeO2 cubes, with sizes of up to 200–300 nm. On the other hand, a low aging temperature (i.e., 150 °C) leads to a mixture of polyhedra with different shapes and sizes (rods, truncated cubes, etc.). Finally, it should be pointed out that the hydrothermal conditions used for catalyst preparation are not very selective, in terms of morphology, as a multimodal distribution of the cube sizes even appears for samples synthesized at 10 M NaOH and 180 °C.
Figure 1. X-ray diffraction (XRD) patterns of the prepared samples. Figure 1.X-ray diffraction (XRD) patterns of the prepared samples.
Figure2shows the FESEM micrographies of the samples prepared at different synthesis conditions: x-axis = aging temperature (150–180 ◦C); y-axis = NaOH concentration (4–10 M). As expected, both the aging temperature and the basicity influence the structural and textural properties of the nanostructured CeO2. It has in fact been observed that, the presence of nanorods (length = 300–500 nm)
at lower NaOH concentrations (i.e., 4 M) prevails over the formation of nanocubes (length = 30–50 nm), regardless of the temperature used during the aging step. However, higher temperatures (i.e., 180◦C) seem to favor the creation of larger rods along with a few well-defined nanocubes (side≈100 nm). Conversely, the higher basicity favors the development of well-defined cubes when the temperature ranges from 170 to 180◦C. Moreover, both the temperature and the basicity lead to larger and more stable CeO2cubes, with sizes of up to 200–300 nm. On the other hand, a low aging temperature (i.e.,
150◦C) leads to a mixture of polyhedra with different shapes and sizes (rods, truncated cubes, etc.). Finally, it should be pointed out that the hydrothermal conditions used for catalyst preparation are not very selective, in terms of morphology, as a multimodal distribution of the cube sizes even appears for samples synthesized at 10 M NaOH and 180◦C.
Catalysts 2017, 7, 174 4 of 18
Catalysts 2017, 7, 174 4 of 19
Figure 2. Field emission scanning electron microscopy (FESEM) images of the prepared samples as a function of the synthesis conditions (namely, aging temperature and NaOH concentration).
2.2. Reducibility and Defective Sites
The reducibility of the catalysts was investigated by means of CO-TPR analysis. CO was selected as the reducing agent, instead of H2, due to its abundant presence in diesel exhaust. During the analysis, CO reacts with the oxygen atoms that originate solely from the solid catalyst, and CO2 is formed as a product. The nature of the oxygen species on the catalyst surface can be understood by considering the reduction peak temperature, which is estimated via deconvolution, since the oxygen release is highly temperature-dependent. As a whole, a good catalyst for CO and soot oxidation should be able to release oxygen at a temperature that is compatible with the expected field of application.
Figure 3 shows the CO-TPR curves of the prepared samples, all of which seem to conform to the usual trend for pure ceria: an early emergence of CO2 at around 300–400 °C and a steady production of CO2 up to the end of the test. The early formation of CO2 signifies the consumption of labile oxygen species on the catalyst surface. Constriction points can be observed above 500 °C in some samples, and these indicate a change in the oxygen source for the reaction, which possibly comes from the bulk phase of the sample. Table 2 summarizes the peak temperatures and their corresponding estimated quantities of surface oxygen (mmol) obtained from the curve deconvolution. The earliest catalyst reduction was demonstrated for the 170 °C-4 M and 150 °C-4 M samples (reduction peak temperatures at 388 °C and 373 °C, respectively). The samples synthesized with high aging temperatures and basicity, namely, the 180 °C-10 M and 180 °C-8 M samples, exhibit
Figure 2.Field emission scanning electron microscopy (FESEM) images of the prepared samples as a function of the synthesis conditions (namely, aging temperature and NaOH concentration).
2.2. Reducibility and Defective Sites
The reducibility of the catalysts was investigated by means of CO-TPR analysis. CO was selected as the reducing agent, instead of H2,due to its abundant presence in diesel exhaust. During the
analysis, CO reacts with the oxygen atoms that originate solely from the solid catalyst, and CO2is
formed as a product. The nature of the oxygen species on the catalyst surface can be understood by considering the reduction peak temperature, which is estimated via deconvolution, since the oxygen release is highly temperature-dependent. As a whole, a good catalyst for CO and soot oxidation should be able to release oxygen at a temperature that is compatible with the expected field of application.
Figure3shows the CO-TPR curves of the prepared samples, all of which seem to conform to the usual trend for pure ceria: an early emergence of CO2at around 300–400◦C and a steady production
of CO2up to the end of the test. The early formation of CO2signifies the consumption of labile oxygen
species on the catalyst surface. Constriction points can be observed above 500◦C in some samples, and these indicate a change in the oxygen source for the reaction, which possibly comes from the bulk phase of the sample. Table2summarizes the peak temperatures and their corresponding estimated quantities of surface oxygen (mmol) obtained from the curve deconvolution. The earliest catalyst reduction was demonstrated for the 170◦C-4 M and 150◦C-4 M samples (reduction peak temperatures at 388◦C and 373◦C, respectively). The samples synthesized with high aging temperatures and basicity, namely,
Catalysts 2017, 7, 174 5 of 18
the 180◦C-10 M and 180◦C-8 M samples, exhibit lower reducibility (reduction peak temperatures at 399◦C and 424◦C, respectively). The results suggest that CO reduction on ceria catalysts depends to a great extent on the textural properties. The high surface area of the ceria nanorods synthesized at low aging temperature leads to more exposure of the catalyst surface to CO, thus enabling early CO2
production. Despite the lower reducibility, the 180◦C-8 M sample appears to release a much higher quantity of oxygen (about 0.029 mmol). It has been surmised that, while the surface area determines the degree of reducibility, the structure of the catalyst is responsible for the amount of oxygen that can be exploited for the reaction.
lower reducibility (reduction peak temperatures at 399 °C and 424 °C, respectively). The results suggest that CO reduction on ceria catalysts depends to a great extent on the textural properties. The high surface area of the ceria nanorods synthesized at low aging temperature leads to more exposure of the catalyst surface to CO, thus enabling early CO2 production. Despite the lower reducibility, the 180 °C-8 M sample appears to release a much higher quantity of oxygen (about 0.029 mmol). It has been surmised that, while the surface area determines the degree of reducibility, the structure of the catalyst is responsible for the amount of oxygen that can be exploited for the reaction.
Table 2. Estimated quantity of surface oxygen and specific reaction rate (calculated at 300 °C) obtained from the CO-TPR (temperature-programmed reduction) curve deconvolution.
Catalyst Estimated Quantity of surface Oxygen (Mmol) Specific Reaction Rate (mmolCO g cat−1 h−1) 180 °C-10 M 0.023 164 180 °C-8 M 0.029 42.6 180 °C-4 M 0.013 142 170 °C-10 M 0.021 207 170 °C-8 M 0.025 309 170 °C-4 M 0.024 402 150 °C-10 M 0.018 393 150 °C-8 M 0.019 220 150 °C-4 M 0.022 473
Figure 3. CO2 production as a function of temperature over all the samples derived from CO-TPR
(temperature-programmed reduction) analysis.
The samples were further analysed by means of micro-Raman spectroscopy to study how the synthesis parameters affect their structural features and thus their catalytic activity. Raman scattering is a powerful tool that can be used to directly probe the defect sites in doped and undoped ceria particles [22–24]. In order to improve the reliability of the characterization, in-situ Raman measurements were performed at several temperatures, starting from room temperature (r.t.) to 700 °C, in order to cover the range in which catalytic phenomena take place.
Figure 4a reports the typical behavior of the vibrational modes of a representative ceria NP sample (180 °C-8 M) at different temperatures. Four features can be identified in the room temperature spectra: the main Ce-O8 crystal unit vibration around 464 cm−1, which is the characteristic F2g mode of the fluorite lattice [25], and three weaker Raman peaks at 261 cm−1, 598
Figure 3.CO2production as a function of temperature over all the samples derived from CO-TPR (temperature-programmed reduction) analysis.
Table 2.Estimated quantity of surface oxygen and specific reaction rate (calculated at 300◦C) obtained from the CO-TPR (temperature-programmed reduction) curve deconvolution.
Catalyst Estimated Quantity of Surface Oxygen (Mmol)
Specific Reaction Rate (mmolCOg cat−1h−1) 180◦C-10 M 0.023 164 180◦C-8 M 0.029 42.6 180◦C-4 M 0.013 142 170◦C-10 M 0.021 207 170◦C-8 M 0.025 309 170◦C-4 M 0.024 402 150◦C-10 M 0.018 393 150◦C-8 M 0.019 220 150◦C-4 M 0.022 473
The samples were further analysed by means of micro-Raman spectroscopy to study how the synthesis parameters affect their structural features and thus their catalytic activity. Raman scattering is a powerful tool that can be used to directly probe the defect sites in doped and undoped ceria particles [22–24]. In order to improve the reliability of the characterization, in-situ Raman measurements were performed at several temperatures, starting from room temperature (r.t.) to 700◦C, in order to cover the range in which catalytic phenomena take place.
Figure4a reports the typical behavior of the vibrational modes of a representative ceria NP sample (180◦C-8 M) at different temperatures. Four features can be identified in the room temperature spectra: the main Ce-O8crystal unit vibration around 464 cm−1, which is the characteristic F2gmode of the
Catalysts 2017, 7, 174 6 of 18
fluorite lattice [25], and three weaker Raman peaks at 261 cm−1, 598 cm−1, and 1165 cm−1. The first and the third ones can be assigned to the higher order modes of ceria, namely to the second order transverse acoustic mode, that is, 2TA [24] (although a different assignment to a Ce-OH related vibration has recently been suggested [26]), and to the second overtone of the longitudinal optical band (2LO) [26]. The Raman peak at 598 cm−1is instead a disorder induced mode arising from Frenkel-type anion defects, consisting of a vacancy, originated by the motion of an O2−ion to an interstitial octahedral
site [17,23]. Defect related bands around 550 cm−1, due to oxygen vacancies at a Ce3+site [23], cannot be resolved, thus pointing out that this set of ceria NPs mainly contains oxidized Ce4+.
Catalysts 2017, 7, 174 6 of 19
cm−1, and 1165 cm−1. The first and the third ones can be assigned to the higher order modes of ceria, namely to the second order transverse acoustic mode, that is, 2TA [24] (although a different assignment to a Ce-OH related vibration has recently been suggested [26]), and to the second overtone of the longitudinal optical band (2LO) [26]. The Raman peak at 598 cm−1 is instead a disorder induced mode arising from Frenkel-type anion defects, consisting of a vacancy, originated by the motion of an O2− ion to an interstitial octahedral site. [17,23]. Defect related bands around 550 cm−1, due to oxygen vacancies at a Ce3+ site [23], cannot be resolved, thus pointing out that this set of ceria NPs mainly contains oxidized Ce4+.
Upon increase in temperature, the most significant Raman spectral changes are observed for the peak position, linewidth, and intensity of the F2g mode. An enlarged view of the temperature dependent spectra in the F2g region is shown in Figure 4b. A red-shift of the F2g mode occurs, together with an asymmetric broadening of its line shape and an intensity decrease, when the samples are heated. This phenomenon has been observed for several materials [27–29] as well as for ceria nanocrystals [30,31], and has been explained considering two different contributions: thermal expansion and lattice anharmonicity [29]. While the former only influences the peak position, both Raman shift and linewidth variations are consequences of the phonons anharmonic decay at higher temperatures, which may involve three- or four-phonon interactions [31].
Figure 4c provides a zoomed view of the region of the defect peaks. Similarly to the F2g mode, the defect band at 598 cm−1 is subjected to a red shift and to a relevant linewidth broadening when the temperature is increased.
Figure 4. (a) Raman spectra of the 180 °C-10 M sample acquired from room temperature to 700 °C. (b) Enlarged F2g band region. (c) Enlarged Ov band region.
According to the existing literature, the defect density in the catalyst can be estimated on the basis of the intensity ratio between the Ov and F2g bands, Ov/F2g (the cumulative Raman band areas ascribed to the different defect sites are usually considered) [22,32].
Such a parameter is particularly useful, as it has been shown to correlate well with the catalytic performances of the analyzed materials [32,33]. Nevertheless, the room temperature Raman spectra of the catalysts are usually analyzed, while more reliable information could be provided by high temperature Raman measurements. Table 3 reports the calculated Ov/F2g ratio at 300 °C, 400 °C, and
Figure 4. (a) Raman spectra of the 180◦C-10 M sample acquired from room temperature to 700◦C. (b) Enlarged F2gband region. (c) Enlarged Ovband region.
Upon increase in temperature, the most significant Raman spectral changes are observed for the peak position, linewidth, and intensity of the F2gmode. An enlarged view of the temperature
dependent spectra in the F2g region is shown in Figure 4b. A red-shift of the F2g mode occurs,
together with an asymmetric broadening of its line shape and an intensity decrease, when the samples are heated. This phenomenon has been observed for several materials [27–29] as well as for ceria nanocrystals [30,31], and has been explained considering two different contributions: thermal expansion and lattice anharmonicity [29]. While the former only influences the peak position, both Raman shift and linewidth variations are consequences of the phonons anharmonic decay at higher temperatures, which may involve three- or four-phonon interactions [31].
Figure4c provides a zoomed view of the region of the defect peaks. Similarly to the F2gmode,
the defect band at 598 cm−1is subjected to a red shift and to a relevant linewidth broadening when the temperature is increased.
According to the existing literature, the defect density in the catalyst can be estimated on the basis of the intensity ratio between the Ovand F2gbands, Ov/F2g(the cumulative Raman band areas
ascribed to the different defect sites are usually considered) [22,32].
Such a parameter is particularly useful, as it has been shown to correlate well with the catalytic performances of the analyzed materials [32,33]. Nevertheless, the room temperature Raman spectra
of the catalysts are usually analyzed, while more reliable information could be provided by high temperature Raman measurements. Table3reports the calculated Ov/F2gratio at 300◦C, 400◦C, and
500◦C. Because of the intensity decrease in the F2gand defect bands during heating, the ratios can
only be compared at a fixed temperature. The influence of anharmonicity on a collective vibrational mode, such as the F2gone, is in fact stronger than that observed for localized modes, such as defect
induced vibrations, and as a result, the ratio generally increases at higher temperatures.
Table 3. Intensity ratios between the F2gand Ovbands derived from micro-Raman spectroscopy. Spectra recorded at 300, 400, and 500◦C.
Catalysts Ov/F2g 300◦C Ov/F2g 400◦C Ov/F2g 500◦C 150◦C-10 M 0.038 0.041 0.039 170◦C-10 M 0.031 0.035 0.036 180◦C-10 M 0.029 0.035 0.040 150◦C-8 M 0.040 0.044 0.048 170◦C-8 M 0.036 0.037 0.037 180◦C-8 M 0.031 0.031 0.032 150◦C-4 M 0.080 0.093 0.100 170◦C-4 M 0.052 0.052 0.063 180◦C-4 M 0.035 0.036 0.038
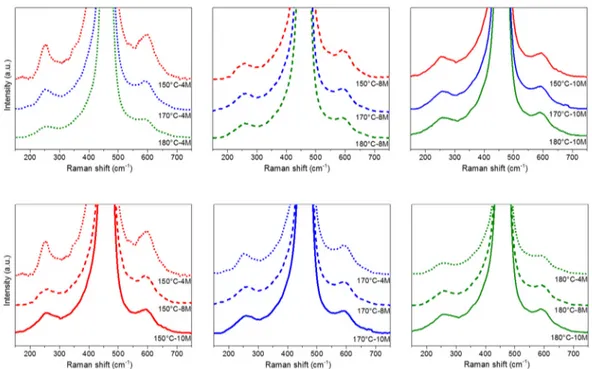
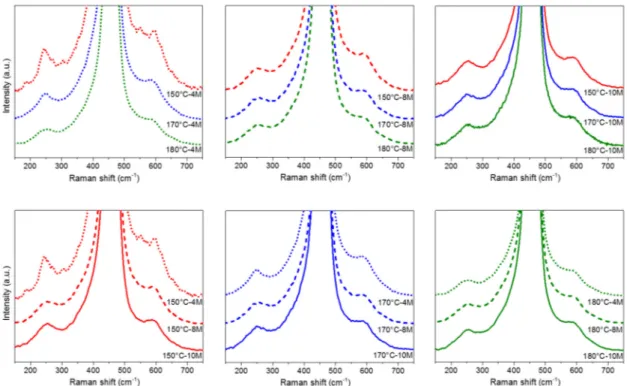
Figure5shows the Raman spectra of the catalysts collected at 300◦C. The best discrimination of the catalytic performances towards the CO oxidation is in fact expected around that temperature window. The spectra are normalized to the F2gpeak and grouped according to the main synthesis parameters:
NaOH concentration (top) and aging temperature (bottom). It can be inferred from the figure, which is the graphical equivalent of the Ov/F2gratio, that an increase in the NaOH concentration or aging
temperature tends to reduce the number of defects, and the influence of the synthesis temperature is greater. Additionally, as shown in Table3, when specimens with different NaOH concentrations are compared, the highest variability is observed for the samples synthesized at 150◦C, while the ratios are closer for the NPs prepared at 180◦C. Figure5also highlights that highly defective surfaces are characterized by the broadest F2glinewidth. These results can clearly be correlated to the morphological
and textural features of the NPs. Actually, smaller nanoparticles usually show larger F2glinewidths,
due to the combination of phonon confinement and strain effects [24]. Accordingly, the linewidth of the F2gband decreases moving from lower (small rods and cubes) to higher aging temperatures, the
latter of which produce larger nanoparticles. Moreover, the comparative analysis of the FESEM images and of the Raman spectra reveals that as the NPs dimension increases, the defect density measured by the Ov/F2gratio is reduced. Such behavior was previously observed for samples of different sizes,
but with the same composition and morphology [24,32]. In the present study, a direct correlation has been found between the Ov/F2gratio and the specific surface area of the CeO2NPs (Figure6), as the
latter parameter decreases when the size of the NPs increases. In contrast to previous works, the defect density measured by Raman spectroscopy is weakly influenced by the exposed crystal planes, while the dependence on the specific surface area is dominant.
Catalysts 2017, 7, 174Catalysts 2017, 7, 174 8 of 188 of 19
Figure 5. Raman spectra of the CeO2 samples at 300 °C. The spectra are grouped according to the
synthesis conditions: NaOH concentration (top); aging temperature (bottom).
Higher temperatures should be considered for the soot conversion reaction. For this reason, the normalized spectra at 500 °C are reported in Figure 7. Although the defect bands are significantly broader and differences between the samples are partially mitigated, the Ov/F2g trend is analogous to the one detected for the 300 °C measurements. It should be noted that no evident shoulder can be detected at 550 cm−1, due to the formation of oxygen vacancies associated to the reduction of Ce4+, during heating. Moreover, after the thermal cycle from r.t. to 700 °C, a reversibility of the spectral features can be observed for all the CeO2 NPs, not only for the F2g peak, as already reported for CeO2 nanoparticles with a size >20 nm [24], but also for the defect band. This suggests that the spectral changes revealed at high temperatures are due more to temperature effects on the vibrational properties of the samples than to an evolution of the microstructure of the samples. The observed reversibility is also in agreement with the reported stability of Frenkel-type anion defects, for which the onset of recombination phenomena was shown to be over 700 °C [34].
Figure 5. Raman spectra of the CeO2samples at 300◦C. The spectra are grouped according to the synthesis conditions: NaOH concentration (top); aging temperature (bottom).
Catalysts 2017, 7, 174 9 of 19
Figure 6. Logarithmic plot of the Ov/F2g ratio versus the specific surface area of each CeO2 sample,
showing a good correlation between the two parameters. The red line is a linear fit of the experimental data.
Figure 7. Raman spectra of the CeO2 samples at 500 °C. The spectra are grouped according to the
synthesis conditions: NaOH concentration (top); aging temperature (bottom).
2.3. Catalytic Activity
The catalytic activity for CO oxidation was studied in the 75–500 °C temperature range. Figure 8 shows the CO conversion to CO2 as a function of the reaction temperature of the prepared catalysts
Figure 6. Logarithmic plot of the Ov/F2g ratio versus the specific surface area of each CeO2 sample, showing a good correlation between the two parameters. The red line is a linear fit of the experimental data.
Higher temperatures should be considered for the soot conversion reaction. For this reason, the normalized spectra at 500◦C are reported in Figure7. Although the defect bands are significantly broader and differences between the samples are partially mitigated, the Ov/F2gtrend is analogous
to the one detected for the 300◦C measurements. It should be noted that no evident shoulder can be detected at 550 cm−1, due to the formation of oxygen vacancies associated to the reduction of Ce4+, during heating. Moreover, after the thermal cycle from r.t. to 700◦C, a reversibility of the
Catalysts 2017, 7, 174 9 of 18
spectral features can be observed for all the CeO2NPs, not only for the F2gpeak, as already reported
for CeO2nanoparticles with a size >20 nm [24], but also for the defect band. This suggests that the
spectral changes revealed at high temperatures are due more to temperature effects on the vibrational properties of the samples than to an evolution of the microstructure of the samples. The observed reversibility is also in agreement with the reported stability of Frenkel-type anion defects, for which the onset of recombination phenomena was shown to be over 700◦C [34].
Figure 6. Logarithmic plot of the Ov/F2g ratio versus the specific surface area of each CeO2 sample,
showing a good correlation between the two parameters. The red line is a linear fit of the experimental data.
Figure 7. Raman spectra of the CeO2 samples at 500 °C. The spectra are grouped according to the
synthesis conditions: NaOH concentration (top); aging temperature (bottom).
2.3. Catalytic Activity
The catalytic activity for CO oxidation was studied in the 75–500 °C temperature range. Figure 8 shows the CO conversion to CO2 as a function of the reaction temperature of the prepared catalysts
Figure 7. Raman spectra of the CeO2samples at 500◦C. The spectra are grouped according to the synthesis conditions: NaOH concentration (top); aging temperature (bottom).
2.3. Catalytic Activity
The catalytic activity for CO oxidation was studied in the 75–500◦C temperature range. Figure8 shows the CO conversion to CO2as a function of the reaction temperature of the prepared catalysts
along with the uncatalyzed reaction. All the catalysts exhibit positive conversion trends for increasing temperature, and total oxidation of CO is reached at about 250 ◦C for the 150 ◦C-4 M sample. This sample in fact exhibited the best results in terms of T10%-50%-90% values (197, 218, and 231◦C,
respectively) (Table4), thus confirming the beneficial role of the textural properties on the overall activity of this set of CeO2nanostructures. In other words, a higher surface area means more abundant
surface defects (i.e., oxygen vacancies) which in turn are accessible to the reactants. According to the literature [35], CO molecules reach the Cen+-O species and form CO
2, and then the O vacancy is
readily refilled by subsurface (lattice) oxygen. As expected, poor textural properties lead to lower catalytic performances (i.e., in terms of CO2conversion), and the least performing catalyst was found
to be the ceria 180◦C-10 M, which exhibits low SBETand Vp. These catalytic results are moderately
correlated to the CO-TPR profiles, thus suggesting that the presence of molecular oxygen plays a role in this reaction.
Catalysts 2017, 7, 174 10 of 18
Catalysts 2017, 7, 174 10 of 19
along with the uncatalyzed reaction. All the catalysts exhibit positive conversion trends for increasing temperature, and total oxidation of CO is reached at about 250 °C for the 150 °C-4 M sample. This sample in fact exhibited the best results in terms of T10%-50%-90% values (197, 218, and 231 °C, respectively) (Table 4), thus confirming the beneficial role of the textural properties on the overall activity of this set of CeO2 nanostructures. In other words, a higher surface area means more abundant surface defects (i.e., oxygen vacancies) which in turn are accessible to the reactants. According to the literature [35], CO molecules reach the Cen+-O species and form CO2, and then the O vacancy is readily refilled by subsurface (lattice) oxygen. As expected, poor textural properties lead to lower catalytic performances (i.e., in terms of CO2 conversion), and the least performing catalyst was found to be the ceria 180 °C-10 M, which exhibits low SBET and Vp. These catalytic results are moderately correlated to the CO-TPR profiles, thus suggesting that the presence of molecular oxygen plays a role in this reaction.
Figure 8. CO to CO2 conversion (%) versus temperature over the prepared catalysts.
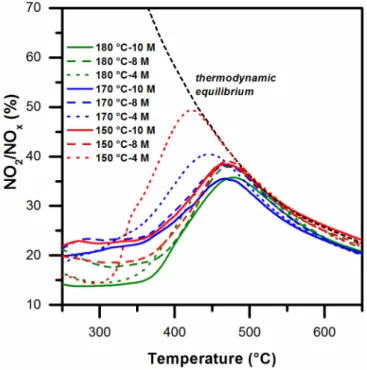
Figure 9 summarizes the results derived from the NO oxidation tests, in which the NO2 percentage in the NOx mixture is represented as a function of the temperature. The catalysts synthesized at 180 °C (green curves) generally demonstrate lower NO oxidation activity. A maximum NO conversion of about 35% was reached over these catalysts at about 475 °C. The catalysts synthesized at 170 °C and 150 °C at a higher basicity (namely, 8 M and 10 M) exhibit a similar conversion trend: the maximum conversion values are centered at ≈475 °C, with the intensity narrowly varying between 35% and 38%. Surprisingly, the 170 °C-4 M and 150 °C-4 M samples give the highest conversion of NO to NO2. The peak of the former sample is centered at 447 °C (conversion ≈ 40%), while that of the latter is centered at 421 °C (conversion ≈ 49%). The catalytic performance of the 150 °C-4 M sample is in fact rather similar to that of several Pt-based catalysts reported in the literature [4,36]. The high activity of the last two catalysts may be attributed to their relatively high surface area (28 and 52 m2 g−1 for 170 °C-4 M and 150 °C-4 M, respectively). The other samples in the set, irrespective of the morphology and particle size, exhibit similar oxidation activities, most likely because they exhibit comparable surface areas (8–14 m2 g−1). Moreover, the NO oxidation trend is similar to that of the CO-TPR profiles in the 200–450 °C range, and a good correlation is thus shown between the NO oxidation reaction and the surface reducibility of ceria.
Figure 8.CO to CO2conversion (%) versus temperature over the prepared catalysts.
Table 4.Results from the soot oxidation tests in the absence and (the) presence of NOx.
In the Absence of NOx(10%-v O2in N2) Catalyst Tconversion( ◦C) T10% T50% T90% 180◦C-10 M 499 576 618 180◦C-8 M 476 564 614 180◦C-4 M 500 590 639 170◦C-10 M 512 599 640 170◦C-8 M 526 593 631 170◦C-4 M 504 583 629 150◦C-10 M 512 591 637 150◦C-8 M 474 535 618 150◦C-4 M 490 588 635 No catalyst 526 615 656
In the Presence of NOx(550 ppmv-NO + 10%-v O2in N2)
Catalyst Tconversion( ◦C) T10% T50% T90% 180◦C-10 M 480 576 624 180◦C-8 M 442 530 598 180◦C-4 M 468 558 610 170◦C-10 M 471 570 622 170◦C-8 M 469 554 602 170◦C-4 M 461 546 597 150◦C-10 M 468 554 609 150◦C-8 M 412 490 552 150◦C-4 M 440 517 565 No catalyst 526 615 656
Figure9summarizes the results derived from the NO oxidation tests, in which the NO2percentage
(green curves) generally demonstrate lower NO oxidation activity. A maximum NO conversion of about 35% was reached over these catalysts at about 475◦C. The catalysts synthesized at 170◦C and 150◦C at a higher basicity (namely, 8 M and 10 M) exhibit a similar conversion trend: the maximum conversion values are centered at≈475◦C, with the intensity narrowly varying between 35% and 38%. Surprisingly, the 170◦C-4 M and 150◦C-4 M samples give the highest conversion of NO to NO2.
The peak of the former sample is centered at 447◦C (conversion≈40%), while that of the latter is centered at 421◦C (conversion≈49%). The catalytic performance of the 150◦C-4 M sample is in fact rather similar to that of several Pt-based catalysts reported in the literature [4,36]. The high activity of the last two catalysts may be attributed to their relatively high surface area (28 and 52 m2g−1for 170◦C-4 M and 150◦C-4 M, respectively). The other samples in the set, irrespective of the morphology and particle size, exhibit similar oxidation activities, most likely because they exhibit comparable surface areas (8–14 m2g−1). Moreover, the NO oxidation trend is similar to that of the CO-TPR profiles in the 200–450◦C range, and a good correlation is thus shown between the NO oxidation reaction and the surface reducibility of ceria.Catalysts 2017, 7, 174 11 of 19
Figure 9. NO oxidation versus temperature over the prepared catalysts.
Figure 10 shows the soot conversion to CO2 as a function of the temperature obtained with the catalysts in the absence Figure 10 (Sections A–C) and in the presence of NOx Figure 10 (Sections D–F) along with Printex-U (no catalyst). Similarly, Table 4 summarizes the data of the temperatures at which 10%, 50%, and 90% soot conversions are reached, extracted from soot conversion curves in the absence and the presence of NO. In the former case, the CeO2-containing catalysts exhibit positive soot conversion trends Figure 10 (Section A) for increasing temperature, and soot combustion was completed at about 650 °C for the less reactive materials. On the other hand, uncatalyzed soot combustion takes place at higher temperatures, thus confirming the beneficial role of ceria in this reaction (see Table 4).
The 150 °C-8 M sample appears to be the most promising catalyst, and this shows that small polyhedra (≈50 nm in size) with abundant (111) planes (see Table 1) can be much more effective than larger cubes (i.e., samples calcined at 170–180 °C, with a basicity of 8–10 M). It has in fact been confirmed in other studies [19], that the soot-catalyst contact conditions play a key role in this solid-solid reaction mediated by gas phase oxygen. On the other hand, the textural properties of the soot oxidation catalysts (i.e., specific surface area, total pore volume) have less effect on the overall oxidation activity.
The multimodal distributions of the CO2 and CO formations are reported in Sections B and C, respectively. In agreement with the literature [19], the “low-temperature peak” (centered at ca. 500 °C) would seem to reflect the COx produced by surface redox-type mechanisms, whereas the peak centered at ca. 600 °C can be attributed to the formation of COx by radical mechanisms that take place at higher temperatures (an almost uncatalyzed reaction). As expected, an intense low-temperature peak appears for the most effective catalyst (peak centered at ca. 500 °C) along with a shoulder at ca. 610 °C, due to the production of COx via radical (almost non-catalytic) processes.
Figure 10 (Sections D–F) and Table 4 summarize the results obtained from the soot oxidation tests in the presence of NO. Interestingly, all the catalysts exhibit better performances (in terms of T10%, T50% and T90%) for NO-assisted soot combustion than in the absence of NO. The co-presence of NOx and soot on the ceria surface promotes the oxidation activity via multiple (synergistic) effects. Ceria acts as a storage means of NOx under the form of nitrate at moderate temperatures (below 400 °C). Above these temperatures, NO oxidation would be limited, due to thermodynamic equilibrium, while the stored NO2 can be released from the ceria to the soot oxidation site [9]. As shown in Scheme 1, NOx-assisted and active oxygen mechanisms (O* derived from spillover phenomena,
Figure 9.NO oxidation versus temperature over the prepared catalysts.
Figure10shows the soot conversion to CO2as a function of the temperature obtained with the
catalysts in the absence Figure10(Sections A–C) and in the presence of NOxFigure10(Sections D–F)
along with Printex-U (no catalyst). Similarly, Table4summarizes the data of the temperatures at which 10%, 50%, and 90% soot conversions are reached, extracted from soot conversion curves in the absence and the presence of NO. In the former case, the CeO2-containing catalysts exhibit positive
soot conversion trends Figure10(Section A) for increasing temperature, and soot combustion was completed at about 650 ◦C for the less reactive materials. On the other hand, uncatalyzed soot combustion takes place at higher temperatures, thus confirming the beneficial role of ceria in this reaction (see Table4).
Catalysts 2017, 7, 174 12 of 18
Catalysts 2017, 7, 174 13 of 19
Figure 10. Soot oxidation catalytic tests: (A–C) in the absence; and (D–F) in the presence of NOx.
Scheme 1. Schematization of the ceria-catalyzed soot combustion under NOx/O2.
NO, O
2NO
2O*
CO
xCeO
2soot
Figure 10.Soot oxidation catalytic tests: (A–C) in the absence; and (D–F) in the presence of NOx.
The 150◦C-8 M sample appears to be the most promising catalyst, and this shows that small polyhedra (≈50 nm in size) with abundant (111) planes (see Table1) can be much more effective than larger cubes (i.e., samples calcined at 170–180 ◦C, with a basicity of 8–10 M). It has in fact been confirmed in other studies [19], that the soot-catalyst contact conditions play a key role in this solid-solid reaction mediated by gas phase oxygen. On the other hand, the textural properties of the soot oxidation catalysts (i.e., specific surface area, total pore volume) have less effect on the overall oxidation activity.
The multimodal distributions of the CO2and CO formations are reported in Sections B and C,
respectively. In agreement with the literature [19], the “low-temperature peak” (centered at ca. 500◦C) would seem to reflect the COxproduced by surface redox-type mechanisms, whereas the peak centered
at ca. 600◦C can be attributed to the formation of COxby radical mechanisms that take place at higher
Catalysts 2017, 7, 174 13 of 18
for the most effective catalyst (peak centered at ca. 500◦C) along with a shoulder at ca. 610◦C, due to the production of COxvia radical (almost non-catalytic) processes.
Figure10(Sections D–F) and Table4summarize the results obtained from the soot oxidation tests in the presence of NO. Interestingly, all the catalysts exhibit better performances (in terms of T10%,
T50%and T90%) for NO-assisted soot combustion than in the absence of NO. The co-presence of NOx
and soot on the ceria surface promotes the oxidation activity via multiple (synergistic) effects. Ceria acts as a storage means of NOxunder the form of nitrate at moderate temperatures (below 400◦C).
Above these temperatures, NO oxidation would be limited, due to thermodynamic equilibrium, while the stored NO2can be released from the ceria to the soot oxidation site [9]. As shown in Scheme1,
NOx-assisted and active oxygen mechanisms (O* derived from spillover phenomena, nitrate, and
lattice oxygens) may occur simultaneously during the soot/NO/O2oxidation reaction. The beneficial
role of NOxon soot combustion over ceria appears greater for catalysts with a higher specific surface
area, as shown in Figure11.
Figure 10. Soot oxidation catalytic tests: (A–C) in the absence; and (D–F) in the presence of NOx.
Scheme 1. Schematization of the ceria-catalyzed soot combustion under NOx/O2.
NO, O
2NO
2O*
CO
xCeO
2soot
Scheme 1.Schematization of the ceria-catalyzed soot combustion under NOx/O2.
Catalysts 2017, 7, 174 14 of 19
Figure 11. Summary of T50% obtained during the test with NOx-free and NOx-assisted soot oxidations.
Finally, the correlation between the catalyst defects measured through the Ov/F2g ratio in the Raman spectra (presented in Table 3) and the onset temperature of the investigated reactions is reported in Figure 12. The catalysts are grouped according to the molarity of the NaOH used during the synthesis procedure, while the x-axis reports the aging temperature.
The CO oxidation activity, expressed as T10%, is compared with the structural defect abundance profile obtained with Raman spectroscopy at 300 °C, which is an average value of the representative temperature window for CO oxidation with these materials. As can be seen, a direct correlation exists between activity and defects: the more defective the catalyst structure is, the higher the activity (and therefore the lower the T10%). This evidence applies to the entire group of catalysts (4 M, 8 M, and 10 M). Moreover, it can be observed that an increase in molarity leads to a number of defects that are progressively independent of the aging temperature. As a result, T10% shows a considerable variability at 4 M, according to the aging temperature, while it is almost constant at 10M, where neither the defects nor the CO oxidation activity are influenced by the aging temperature.
A similar trend can be observed for the NO oxidation activity. In this case, T30% (that is, the temperature at which NO2/NOx is equal to 30%) is compared with the number of vacancies at 400 °C, which is a value that falls within the range of plotted representative temperatures for NO oxidation. The same conclusions that were previously reported for CO can be drawn, although the slope of T30% is lower than that of T10%, with reference to CO oxidation (at an equal ΔT scale in the two sets of graphs).
Finally, the third set of plots refers to soot oxidation: both O2- and NOx-mediated reactions, expressed as T10% in Table 4, are reported, and are compared with the abundance of defects at 500 °C. The relationship between activity and defects is much weaker than in the other two cases (CO and NO, which are gaseous reactants), presumably because of the poor contact between the catalyst and soot in loose conditions. In this regard, it is known that the morphology of a catalyst plays a relevant role in the degree of contact between the catalyst itself and soot, although this effect is not easy to predict [19] or optimize [37,38]. However, it is interesting to note that when NO is introduced, the slope of the T10% curve generally increases, although marginally, as the NO oxidation promotes a reduction in T10% which, as previously mentioned, is influenced by the abundance of defects.
576 564 590 599 598 583 591 535 588 576 530 559 570 555 546 554 490 517 9 10 14 8 11 28 11 17 52 180 °C–10 M 180 °C–8 M 180 °C–4 M 170 °C–10 M 170 °C–8 M 170 °C–4 M 150 °C–10 M 150 °C–8 M 150 °C–4 M 400 500 600 700 800 T50% (° C)
In the absence of NOx In the presence of NOx
0 4 20 40 60 B E T surf ac e are a ( m 2 g -1 )
Figure 11.Summary of T50%obtained during the test with NOx-free and NOx-assisted soot oxidations.
Finally, the correlation between the catalyst defects measured through the Ov/F2gratio in the
Raman spectra (presented in Table 3) and the onset temperature of the investigated reactions is reported in Figure12. The catalysts are grouped according to the molarity of the NaOH used during the synthesis procedure, while the x-axis reports the aging temperature.
Catalysts 2017, 7, 174 14 of 18
Catalysts 2017, 7, 174 15 of 19
Figure 12. CO oxidation: T10% (y-axis on the left) and intensity ratio between the F2g and Ov bands at
300 °C (y-axis on the right) vs. catalyst aging temperature. NO oxidation: T30% (y-axis on the left) and
intensity ratio between the F2g and Ov bands at 400 °C (y-axis on the right) vs. catalyst aging
temperature. O2- and NOx-mediated soot oxidation in loose contact conditions: T10% (y-axis on the
left) and intensity ratio between the F2g and Ov bands at 500 °C (y-axis on the right) vs. catalyst aging
temperature. Each plot regroups catalysts prepared with the same NaOH concentration (4, 8, and 10 M).
3. Materials and Methods
3.1. Catalyst Preparation
A set of nine CeO2 samples was prepared, via a hydrothermal procedure, using different temperatures (150, 170, and 180 °C) and NaOH concentrations (4, 8, and 10 M) [18,37]. During a typical synthesis, appropriate amounts of NaOH and Ce(NO3)3·6H2O (99%, Sigma-Aldrich, Steinheim, Germany) were dissolved in 70 mL and 10 mL of bi-distilled water, respectively. The two solutions were then mixed together and stirred for 1 h, and a milky slurry was thus obtained.
Figure 12.CO oxidation: T10%(y-axis on the left) and intensity ratio between the F2gand Ovbands at 300◦C (y-axis on the right) vs. catalyst aging temperature. NO oxidation: T30%(y-axis on the left) and intensity ratio between the F2gand Ovbands at 400◦C (y-axis on the right) vs. catalyst aging temperature. O2- and NOx-mediated soot oxidation in loose contact conditions: T10%(y-axis on the left) and intensity ratio between the F2gand Ovbands at 500◦C (y-axis on the right) vs. catalyst aging temperature. Each plot regroups catalysts prepared with the same NaOH concentration (4, 8, and 10 M).
The CO oxidation activity, expressed as T10%, is compared with the structural defect abundance
profile obtained with Raman spectroscopy at 300◦C, which is an average value of the representative temperature window for CO oxidation with these materials. As can be seen, a direct correlation exists between activity and defects: the more defective the catalyst structure is, the higher the activity (and therefore the lower the T10%). This evidence applies to the entire group of catalysts (4 M, 8 M, and
10 M). Moreover, it can be observed that an increase in molarity leads to a number of defects that are progressively independent of the aging temperature. As a result, T10%shows a considerable variability
at 4 M, according to the aging temperature, while it is almost constant at 10M, where neither the defects nor the CO oxidation activity are influenced by the aging temperature.
A similar trend can be observed for the NO oxidation activity. In this case, T30% (that is, the
temperature at which NO2/NOxis equal to 30%) is compared with the number of vacancies at 400◦C,
which is a value that falls within the range of plotted representative temperatures for NO oxidation. The same conclusions that were previously reported for CO can be drawn, although the slope of T30%is
lower than that of T10%,with reference to CO oxidation (at an equal∆T scale in the two sets of graphs).
Finally, the third set of plots refers to soot oxidation: both O2- and NOx-mediated reactions,
expressed as T10%in Table4, are reported, and are compared with the abundance of defects at 500◦C.
The relationship between activity and defects is much weaker than in the other two cases (CO and NO, which are gaseous reactants), presumably because of the poor contact between the catalyst and soot in loose conditions. In this regard, it is known that the morphology of a catalyst plays a relevant role in the degree of contact between the catalyst itself and soot, although this effect is not easy to predict [19] or optimize [37,38]. However, it is interesting to note that when NO is introduced, the slope of the T10%curve generally increases, although marginally, as the NO oxidation promotes a reduction in T10%
which, as previously mentioned, is influenced by the abundance of defects. 3. Materials and Methods
3.1. Catalyst Preparation
A set of nine CeO2 samples was prepared, via a hydrothermal procedure, using different
temperatures (150, 170, and 180◦C) and NaOH concentrations (4, 8, and 10 M) [18,37]. During a typical synthesis, appropriate amounts of NaOH and Ce(NO3)3·6H2O (99%, Sigma-Aldrich, Steinheim,
Germany) were dissolved in 70 mL and 10 mL of bi-distilled water, respectively. The two solutions were then mixed together and stirred for 1 h, and a milky slurry was thus obtained.
The final mixture was transferred to an autoclave (volume = 150 mL), which was 75% filled with deionized water. The mixture was aged at 150, 170, or 180◦C for 24 h. The precipitate was then centrifuged, washed and dried at 70◦C overnight. Finally, the powder was calcined at 550◦C for 4 h. 3.2. Catalyst Characterization
The powder X-ray diffraction patterns were collected on an X’Pert Philips PW3040 diffractometer using Cu Kα radiation (2θ range = 20◦–70◦; step = 0.05◦ 2θ; time per step = 0.2 s). The diffraction peaks were indexed according to the Powder Data File database (PDF-2 1999, International Centre of Diffraction Data, PA, USA).
The Specific Surface Area (SBET) and total pore volume (Vp) were measured by means of N2
physisorption at −196 ◦C (Micromeritics Tristar II 3020, v1.03, Micromeritics Instrument Corp., Norcross, GA, USA, 2009) on samples previously outgassed at 200◦C for 4 h. The specific surface area of the samples was calculated using the Brunauer-Emmett-Teller (BET) method.
The morphology of the samples was investigated by means of field emission scanning electron microscopy (FESEM Zeiss MERLIN, Gemini-II column, Oberkochen, Germany).
The reducibility of the catalysts was analyzed by means of CO-TPR (Temperature-Programmed Reduction). Amounts of 45 mg of powdered catalyst and 150 mg of silica were introduced into a quartz U-tube reactor. The reduction was started by flowing 200 mL min−1gas containing 2000 ppm of CO in N2through the reactor. The temperature increased from room temperature to 700◦C at a programmed
rate of 10◦C min−1.
Temperature dependent Raman measurements were performed using a Linkam TS1500 stage, under a 5x objective of a Renishaw InVia Reflex micro-Raman spectrometer, with laser excitation at 514.5 nm in backscattering light collection mode. The samples were kept at each temperature for 15 min before the spectra were acquired in order to reach thermal equilibrium. The Ov/F2gvalue, which is
Catalysts 2017, 7, 174 16 of 18
representative of the density of the oxygen vacancies, was calculated as the ratio of the integrated areas of the Ovand F2gRaman peaks obtained by means of the deconvolution procedure.
3.3. Catalytic Activity Test
Catalytic tests were executed in a quartz U-tube reactor, with an inner diameter = 4 mm, heated by an electric furnace. The temperature was measured by means of a thermocouple placed in the middle of the catalytic bed. Each test was repeated to ensure the reproducibility of the obtained results. Temperatures corresponding to 10%, 50%, and 90% conversion (denoted as T10%, T50%, and T90%,
respectively) were taken as indices of the activity of the tested catalysts.
CO oxidation reaction: 100 mg of powdered catalyst was introduced into the reactor. The catalytic bed was pre-treated in He (flow rate = 50 mL min−1) for 1 h at 150◦C. The test was started by introducing 50 mL min−1gas, containing 1000 ppm of CO and 10% O2in N2,into the reactor (gas
hourly space velocityof 19,100 h−1). The temperature was then raised by 5◦C min−1over the 50 to 600◦C range.
Soot oxidation reaction: The catalytic bed was prepared by mixing 5 mg of carbon soot (Printex-U), 45 mg of powdered catalyst and 150 mg of inert silica in “loose” contact conditions. The catalyst-soot mixture was prepared by gently stirring it with a spatula for 60 s. This procedure appears sufficient to homogenize the mixture, even though the two solids are placed loosely in contact. The test was started by flowing 100 mL min−1gas, comprising 50% of air and 50% of N2,through the reactor. The
temperature was increased from 100 to 700◦C at a 5◦C min−1heating rate.
NO oxidation reaction: the catalytic bed was made up of 150 mg of inert silica and 45 mg of catalyst, gently mixed with a spatula. The catalyst was pre-treated with 100 mL min−1of air at 100◦C for 30 min. The reactor was then cooled to 50◦C, and this was followed by the introduction of the NO flow (100 mL·min−1of a mixture of 550 ppmv NO and 10%-v O2in N2) till the gas concentrations
were stable. The reactor was heated from 50 to 650◦C at a programmed rate of 5◦C min−1.
NOx-assisted soot oxidation reaction: the catalytic bed contained silica (150 mg), a catalyst
(45 mg) and 5 mg of soot (Printex-U from Degussa), gently mixed with a spatula for 3 min. The catalyst was pre-treated with 100 mL min−1of 20%-v O2in N2at 100◦C for 30 min. The reactor was
then ramp-cooled (5◦C min−1) to 50◦C, and this was followed by the introduction of the NO flow (100 mL min−1of a mixture of 550 ppmv NO and 10%-v O2in N2). After stabilization of the NOx
concentrations, the reactor was heated gradually at a rate of 5◦C min−1to 700◦C. 4. Conclusions
In the present work, a set of nanostructured ceria catalysts was prepared, by means of a hydrothermal procedure, using different synthesis conditions (i.e., temperature, pH values). As a result, samples with different shapes and structural properties were obtained and their catalytic activity was tested considering various oxidation reactions (namely, CO oxidation, NO oxidation, NOx-free
soot oxidation, NOx-assisted soot oxidation). The 150◦C-4 M catalyst exhibited the best performances
for both CO and NO oxidation, thus confirming the beneficial role of the textural properties on the overall activity on this set of CeO2nanostructures. In fact, a higher surface area means more abundant
surface defects that are in turn spatially accessible to reactant molecules. On the other hand, the 150◦C-8 M sample appeared to be the most promising catalyst for the soot oxidation reaction carried out in both the absence and presence of NO.
The role of the structural properties on catalytic activity was also investigated. High temperature in-situ micro-Raman measurements enabled the study of surface defects under the conditions involved in the catalytic processes. A direct (positive) correlation was observed between CO oxidation activity and the structural defects of the catalysts (Ov/F2gratios evaluated at 300◦C): the more defective the
catalyst surface was, the greater the oxidation activity.
Similarly, a positive trend appeared for the NO oxidation activity (Ov/F2gratios evaluated at
specific surface area of the catalyst, instead of being related to the type of exposed crystal planes. On the other hand, a weaker correlation was achieved between the soot oxidation activity and the presence of surface defects, likely because of the loose soot-catalyst contact conditions. However, the soot oxidation activity appeared to be slightly more influenced by the abundance of surface defects in the presence of NO (NOx-assisted soot oxidation).
Author Contributions: M.P. and S.B. conceived and designed the experiments; M.D. performed the sample synthesis, XRD, BET, and catalytic activity tests; T.A. analyzed the catalytic data, while C.N. performed and analyzed the temperature dependent Raman spectroscopy measurements; N.R., D.F., and F.G. supervised the work. Conflicts of Interest:The authors declare no conflict of interest.
References
1. Trovarelli, A.; Fornasiero, P. Catalysis by Ceria and Related Materials, 2nd ed.; Imperial College Press: London, UK, 2013.
2. Heck, R.M.; Farrauto, R.J.; Gulati, S.T. Catalytic Air Pollution Control: Commercial Technology, 3rd ed.; Wiley-VCH: Hoboken, NJ, USA, 2006.
3. Ertl, G.; Knözinger, H.; Schüth, F.; Weitkamp, J. Handbook of Heterogeneous Catalysis, 2nd ed.; Wiley-VCH: Weinheim, Germany, 2008.
4. Bueno-López, A. Diesel soot combustion ceria catalysts. Appl. Catal. B Environ. 2014, 146, 1–11. [CrossRef] 5. Burch, R. Knowledge and Know-How in Emission Control for Mobile Applications. Catal. Rev. 2004, 46,
271–334. [CrossRef]
6. Russell, A.; Epling, W.S. Diesel Oxidation Catalysts. Catal. Rev. 2011, 53, 337–423. [CrossRef]
7. Eastwood, P. Critical Topics in Exhaust Gas Aftertreatment; Research Studies Press Ltd.: Baldock, UK, 2000. 8. Duprez, D.; Cavani, F. Handbook of Advanced Methods and Processes in Oxidation Catalysis; Imperial College
Press: London, UK, 2014.
9. Fino, D.; Bensaid, S.; Piumetti, M.; Russo, N. A review on the catalytic combustion of soot in Diesel particulate filters for automotive applications: From powder catalysts to structured reactors. Appl. Catal. A Gen. 2016, 509, 75–96. [CrossRef]
10. Piumetti, M.; Bensaid, S.; Russo, N.; Fino, D. Nanostructured ceria-based catalysts for soot combustion: Investigations on the surface sensitivity. Appl. Catal. B Environ. 2015, 165, 742–751. [CrossRef]
11. Iijima, S. Helical microtubules of graphitic carbon. Nature 1991, 354, 56–58. [CrossRef]
12. Tans, S.J.; Verschueren, A.R.M.; Dekker, C. Room-temperature transistor based on a single carbon nanotube. Nature 1998, 393, 49–52.
13. Fan, S.; Chapline, M.G.; Franklin, N.R.; Tombler, T.W.; Cassell, A.M.; Dai, H. Self-Oriented Regular Arrays of Carbon Nanotubes and Their Field Emission Properties. Science 1999, 283, 512–514. [CrossRef] [PubMed] 14. Geim, A.K.; Novoselov, K.S. The rise of graphene. Nat. Mater. 2007, 6, 183–191. [CrossRef] [PubMed] 15. Fedlheim, D.L.; Foss, C.A. Metal Nanoparticles: Synthesis, Characterization, and Applications; Marcel Dekker:
New York, NY, USA, 2002.
16. Thomas, J.M.; Raja, R. Mono-, Bi- and Multifunctional Single-Sites: Exploring the Interface between Heterogeneous and Homogeneous Catalysis. Top. Catal. 2010, 53, 848–858. [CrossRef]
17. Agarwal, S.; Zhu, X.; Hensen, E.J.M.; Lefferts, L.; Mojet, B.L. Defect Chemistry of Ceria Nanorods. J. Phys. Chem. C 2014, 118, 4131–4142. [CrossRef]
18. Agarwal, S.; Lefferts, L.; Mojet, B.L. Ceria Nanocatalysts: Shape Dependent Reactivity and Formation of OH. ChemCatChem 2013, 5, 479–489. [CrossRef]
19. Piumetti, M.; van der Linden, B.; Makkee, M.; Miceli, P.; Fino, D.; Russo, N.; Bensaid, S. Contact dynamics for a solid–solid reaction mediated by gas-phase oxygen: Study on the soot oxidation over ceria-based catalysts. Appl. Catal. B Environ. 2016, 199, 96–107. [CrossRef]
20. Baek, S.O.; Field, R.A.; Goldstone, M.E.; Kirk, P.W.; Lester, J.N.; Perry, R. A review of atmospheric polycyclic aromatic hydrocarbons: Sources, fate and behavior. Water Air Soil Pollut. 1991, 60, 279–300. [CrossRef] 21. Laha, S.C.; Ryoo, R. Synthesis of thermally stable mesoporous cerium oxide with nanocrystalline frameworks
Catalysts 2017, 7, 174 18 of 18
22. Taniguchi, T.; Watanabe, T.; Sugiyama, N.; Subramani, A.K.; Wagata, H.; Matsushita, N.; Yoshimura, M. Identifying defects in ceria-based nanocrystals by UV resonance Raman spectroscopy. J. Phys. Chem. C 2009, 113, 19789–19793. [CrossRef]
23. Wu, Z.; Li, M.; Howe, J.; Meyer, H.M., III; Overbury, S.H. Probing defect sites on CeO2nanocrystals with well-defined surface planes by Raman spectroscopy and O2adsorption. Langmuir 2010, 26, 16595–16606. [CrossRef] [PubMed]
24. Spanier, J.E.; Robinson, R.D.; Zhang, F.; Chan, S.W.; Herman, I.P. Size-dependent properties of CeO2−y nanoparticles as studied by Raman scattering. Phys. Rev. B 2001, 64, 245407. [CrossRef]
25. Weber, W.H.; Hass, K.C.; McBride, J.R. Raman study of CeO2: Second-order scattering, lattice dynamics, and particle-size effects. Phys. Rev. B 1993, 48, 178–185. [CrossRef]
26. Filtschew, A.; Hofmann, K.; Hess, C. Ceria and Its Defect Structure: New Insights from a Combined Spectroscopic Approach. J. Phys. Chem. C 2016, 120, 6694–6703. [CrossRef]
27. Su, Z.; Sha, J.; Pan, G.; Liu, J.; Yang, D.; Dickinson, C.; Zhou, W. Temperature-dependent raman scattering of silicon nanowires. J. Phys. Chem. B 2006, 110, 1229–1234. [CrossRef] [PubMed]
28. Zhao, Z.; Elwood, J.; Carpenter, M.A. Phonon Anharmonicity of PdO Studied by Raman Spectrometry. J. Phys. Chem. C 2015, 119, 23094–23102. [CrossRef]
29. Popovi´c, Z.V.; Dohˇcevi´c-Mitrovi´c, Z.; S´cepanovi´c, M.; Gruji´c-Brojˇcin, M.; Askrabi´c, S. Raman scattering on nanomaterials and nanostructures. Ann. Phys. 2011, 523, 62–74. [CrossRef]
30. Pandey, S.D.; Singh, J.; Samanta, K.; Sharma, N.D.; Bandyopadhyay, A.K. Temperature dependent variations of phonon interactions in nanocrystalline cerium oxide. J. Nanomater. 2015, 16, 154.
31. Popovi´c, Z.V.; Dohˇcevi´c-Mitrovi´c, Z.; Cros, A.; Cantarero, A. Raman scattering study of the anharmonic effects in CeO2−ynanocrystals. J. Phys. Condens. Matter 2007, 19, 496209. [CrossRef]
32. Li, Y.; Wei, Z.; Gao, F.; Kovarik, L.; Baylon, R.A.L.; Peden, C.H.F.; Wang, Y. Effect of Oxygen Defects on the Catalytic Performance of VOx/CeO2Catalysts for Oxidative Dehydrogenation of Methanol. ACS Catal. 2015, 5, 3006–3012. [CrossRef]
33. Bensaid, S.; Piumetti, M.; Novara, C.; Giorgis, F.; Chiodoni, A.; Russo, N.; Fino, D. Catalytic Oxidation of CO and Soot over Ce-Zr-Pr Mixed Oxides Synthesized in a Multi-Inlet Vortex Reactor: Effect of Structural Defects on the Catalytic Activity. Nanoscale Res. Lett. 2016, 11, 494. [CrossRef] [PubMed]
34. Mamontov, E.; Egami, T.; Pennsyl, V.; Brezny, R.; Koranne, M.; Grace, W.R.; Grace, C.; Da, V.; Tyagi, S. Lattice Defects and Oxygen Storage Capacity of Nanocrystalline Ceria and Ceria-Zirconia. J. Phys. Chem. B 2000, 104, 11110–11116. [CrossRef]
35. Royer, S.; Duprez, D. Catalytic Oxidation of Carbon Monoxide over Transition Metal Oxides. ChemCatChem 2011, 3, 24–65. [CrossRef]
36. Mai, H.-X.; Sun, L.-D.; Zhang, Y.-W.; Si, R.; Feng, W.; Zhang, H.-P.; Liu, H.-C.L.; Yan, C.-H. Shape-Selective Synthesis and Oxygen Storage Behavior of Ceria Nanopolyhedra, Nanorods, and Nanocubes. J. Phys. Chem. B 2005, 109, 24380–24385. [CrossRef] [PubMed]
37. Miceli, P.; Bensaid, S.; Russo, N.; Fino, D. CeO2-based catalysts with engineered morphologies for soot oxidation to enhance soot-catalyst contact. Nanoscale Res. Lett. 2014, 9, 254. [CrossRef] [PubMed]
38. Bensaid, S.; Russo, N.; Fino, D. CeO2catalysts with fibrous morphology for soot oxidation: The importance of the soot-catalyst contact conditions. Catal. Today 2013, 216, 57–63. [CrossRef]
© 2017 by the authors. Licensee MDPI, Basel, Switzerland. This article is an open access article distributed under the terms and conditions of the Creative Commons Attribution (CC BY) license (http://creativecommons.org/licenses/by/4.0/).