OATAO is an open access repository that collects the work of Toulouse researchers and makes it freely available over the web where possible
Any correspondence concerning this service should be sent
to the repository administrator: [email protected]
This is an author’s version published in: http://oatao.univ-toulouse.fr/ 25796
To cite this version:
Dicharry, Christophe and Delroisse, H. and Torré, Jean-Philippe and
Barreto, G. Using Microscopic Observations of Cyclopentane Hydrate Crystal Morphology and Growth Patterns To Estimate the Antiagglomeration
Capacity of Surfactants. (2020) Energy & Fuels. ISSN 0887-0624 Official URL : https://doi.org/10.1021/acs.energyfuels.9b03395
Open Archive Toulouse Archive Ouverte
Using Microscopic Observations of Cyclopentane Hydrate Crystal Morphology and Growth Patterns To Estimate the
Antiagglomeration Capacity of Surfactants
C. Dicharry,* ,† H. Delroisse, ‡ J.-P. Torré, § and G. Barreto ‡
†
Université de Pau et des Pays de l ’ Adour, E2S UPPA, CNRS, TOTAL, UMR5150, Laboratoire des fl uides complexes et leurs re ́ servoirs, Pau 64000, France
‡
Arkema − Rue Henri Moissan, CS 42063, 69491 Pierre Be ́ nite Cedex, France
§
Laboratoire de Ge nie Chimique, Universite ́ ́ de Toulouse, CNRS, INPT, UPS, Toulouse 31000, France
*
SSupporting Information
ABSTRACT: The crystal growth and morphology of cyclopentane (CP) hydrates at a quiescent water/oil interface in the presence of 10 di ff erent surfactants were observed under a microscope. In most cases, the oil was CP, but for some of the observations a 50/50 vol % mixture of CP and n-octane (n-C8) (or n-dodecane (n-C12)) was used instead. For some of the surfactants, gas hydrates formed from a methane (CH
4)/propane (C
3H
8) gas mixture at a quiescent water/n-C8 interface were also observed. The capacity of the surfactants to prevent the hydrate particles from agglomerating was assessed by measuring torque on oil-dominated systems (70 vol %) in a stirred autoclave at subcoolings of 6 and 10 ° C for the CP hydrates and CH
4/ C
3H
8hydrates, respectively. The oil phases were the same as those used in the morphology study. In the case of CP hydrates, the agglomeration state of the system was directly observed by opening the autoclave at the end of the hydrate formation. The size of the CP hydrate particles was measured, and their wettability was determined. The e ff ect of the presence of salt (NaCl) on the crystal morphology and AA performance was also studied for some systems. All the surfactants that induced the formation of hydrate crystals that rapidly agglomerated at the water/CP interface showed poor AA performance. Whenever the surfactants induced the formation of individual oil-wettable crystals, their AA performance was good. If the individual crystals formed were water-wettable, two main behaviors were observed: (1) when the surfactant induced a very low water/CP interfacial tension (<1 mN/m), its AA performance was good, (2) but when it induced a higher interfacial tension (>1 mN/m), it exhibited poor AA performance. These trends in the AA performance of the surfactants were observed on both hydrate systems (CP hydrates and CH
4/C
3H
8hydrates). From the experimental results obtained in this work, we can infer that the microscopic observation of the morphology and growth pattern of CP hydrate crystals formed at a quiescent water/CP interface might be a simple way to rapidly assess if a surface-active molecule has an antiagglomeration e ff ect on sII gas hydrates.
1. INTRODUCTION
Gas hydrates are inclusion compounds composed of molecules (called guests) trapped in solid cages of water molecules (also called cavities). The guests are usually light molecules such as methane, propane, carbon dioxide, etc. which are small enough to fi t inside the cavities. The conditions conducive to hydrate formation (presence of water and gas, low temperature (typically a few degrees above 0 ° C), and high pressure (typically a few dozen bars)) are recurrent in oil and gas production and give rise to signi fi cant fl ow assurance issues.
Actually, gas hydrates can block fl ow lines and cause production shutdowns, resulting in substantial economic losses and safety problems. Structure-II hydrates (sII), whose unit cell is composed of 136 water molecules that form 16 small pentagonal dodecahedron cavities and 8 large hexakaidecahe- dron cavities, are the hydrates most frequently encountered in oil and gas production.
1Various strategies have been developed to prevent hydrate blockage, with the main one being the injection of chemical additives.
2,3Thermodynamic hydrate inhibitors (THIs) (e.g., methanol and glycol), which inhibit hydrate formation by shifting the phase equilibrium to a lower temperature and higher pressure,
are the chemical additives most commonly used in the oil and gas industry for hydrate risk management. However, large amounts of THIs are required (typically several dozen wt % relative to the liquid water phase) to e ff ectively prevent hydrate formation. For this reason, another class of additives, called low dosage hydrate inhibitors (LDHIs), have been developed.
Only small amounts of LHDIs are required (usually less than 1
wt % of the aqueous phase) to achieve good protection against
the risk of hydrate plug formation. Antiagglomerants (AAs) are
a class of LDHIs that do not inhibit hydrate formation but
limit the agglomeration of hydrate particles. AAs are
increasingly regarded as a viable option for preventing hydrate
blockage, especially in systems which are subject to high
subcoolings (di ff erence between the system temperature and
the hydrate equilibrium temperature at the system pressure)
Δ T
sub(>10 ° C), as in deep-o ff shore production, for example, where KHIs (kinetic hydrate inhibitors, another class of LHDIs) generally do not work. AAs are surface-active agents, which, due to their interfacial activity,
4position themselves at the water/gas or water/oil interface where hydrate crystal- lization generally occurs. When it comes to the action mechanism of AAs, they are expected to adsorb on the hydrate crystal surface through their polar moiety, thus disrupting the hydrate growth and making the crystals hydrophobic.
3The antiagglomeration performance of these substances is generally assessed in rocking cells, autoclaves, or fl ow loops, and experiments are performed with fl uids (water and oil) and gases, at pressures and subcoolings analogous to those encountered in the fi eld.
2Cyclopentane (CP) hydrates have been widely used to rapidly evaluate the performance of AAs.
5−8When combined with water, CP forms sII hydrates (as natural gas does), but at atmospheric pressure and temperatures of less than around 7
° C.
1,9Because the solubility of CP in water is low (156 ppm at 25 ° C),
10CP hydrate formation occurs at the water/oil (i.e., water/CP) interface, as is the case for most sII hydrates involved in pipeline blockages. Moreover, when CP is used in large quantities, it acts as both the hydrate former and the oil phase.
Several authors
11−15used CP hydrates to study the in fl uence of surfactants on the morphology and wettability of hydrate crystals. Without surfactants, most crystals are polygonal and water-wettable, while, in the presence of surfactants, a variety of shapes (polygonal plates, hollow cones, needles, pyramids, etc.), sizes, and wettability can be observed, which are liable to change depending on a number of factors, including the nature of the surfactant, the surfactant concentration, the composition of the oil and aqueous phase, and the subcooling.
The presence of surfactants may have a signi fi cant e ff ect on the hydrate surface,
16,17making it smoother
16or, on the contrary, inducing the formation of irregularities.
17Note that the roughness of the hydrate surface is reported to play an important role in hydrate particle adhesion
18,19and sintering of the asperities on the hydrate surface could cause hydrate particle adhesion in liquid hydrocarbons.
19The presence of surfactants may also drastically increase the agglomeration time of hydrate crystals. For example, Saikia and Mahto
20observed that it increased by more than 1000 min in the presence of soy lecithin.
Cationic surfactants, and more speci fi cally quaternary ammonium salts, are the type of AAs predominantly used in fl ow assurance to avoid hydrate problems.
2In two previous studies,
7,13we evaluated the e ff ects of a cationic surfactant (called Noramium DA 50) on the morphology and wettability of hydrate crystals formed with CP (at atmospheric pressure) and with a CH
4/C
3H
8gas mixture (at about 67 bar) at a quiescent water/oil (w/o) interface. Interestingly enough, we observed that the CP hydrate and CH
4/C
3H
8-hydrate crystals had morphological similarities and the same wettability.
Moreover, the antiagglomeration performance of the surfac- tant, evaluated by measuring torque on oil-dominated systems (70 vol %) in a stirred autoclave, showed similar trends for both hydrate systems. In brief, we observed that the systems that formed a hydrate shell at the w/o interface exhibited poor antiagglomeration performance, whereas those that formed individual oil-wettable crystals achieved good antiagglomera- tion performance. In a recent study,
8we used the same
experimental methodology with a biodegradable surfactant (called Inipol AH81). In the presence of this surfactant, individual water-wettable hollow-conical crystals formed at the w/o interface. Its antiagglomeration performance, evaluated by measuring torque in a stirred autoclave and pressure drop in a semi-industrial fl ow loop, was good. The results obtained in these studies therefore showed a good correlation between the formation of individual hydrate crystals at the w/o interface and the antiagglomeration performance of the tested molecules.
7,8The aim of the present work was to test more surfactants (10) using the same experimental methodology in order to determine if the microscopic observation of hydrate formation at a quiescent w/o interface, and more speci fi cally at a water/
CP interface at atmospheric pressure, might be a relevant method for obtaining valuable indicators with regard to the antiagglomeration capacity of surfactants. In this study, the morphology and wettability of the hydrate crystals and the AA performance of the surfactants were determined using CP hydrates, and CH
4/C
3H
8hydrates in some cases. In addition, the in fl uence of experimental parameters, such as the presence of salt (NaCl) and the oil-phase composition on crystal morphology and AA performance, was investigated for some of the surfactants studied.
2. EXPERIMENTAL METHODS
2.1. Materials. The hydrate formers used for the hydrate formation experiments are cyclopentane (reagent grade, 98%, Acros Organics) and a binary mixture of 84.04 ± 0.16 mol % methane (CH
4) and 15.96 ± 0.16 mol % propane (C
3H
8) supplied by Linde.
Both hydrate formers produce sII hydrates. The oil phase for the experiments with CH
4/C
3H
8hydrates is n-octane (99% pure, referred to as n-C8). For the experiments with CP hydrates, mixtures of CP and n-C8, and CP and n-dodecane (99% pure, referred to as n-C12) are also used. n-C8 and n-C12 were supplied by Acros Organics.
Deionized (DI) water (resistivity of 18.2 MΩ·cm), produced by a Purelab laboratory water-puri fi cation system, was used to prepare the surfactant solutions. Sodium chloride (purity of 99.8%) was supplied by Chem Lab.
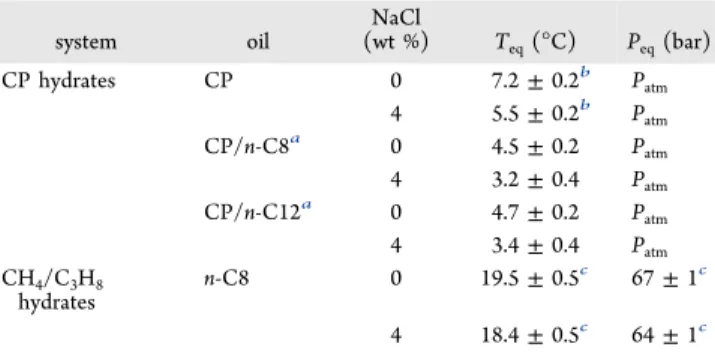
The experimental hydrate equilibrium temperatures and pressures (T
eqand P
eq) for the systems studied in this work are given in Table 1.
For the CP hydrates, they were determined by a step heating method (see more details in ref 8). For the CH
4/C
3H
8hydrates, they were estimated based on the experimental hysteresis curve (P vs T) at the inflection point of the heating curve, where the latter meets the cooling curve (see more details in ref 7). The subcoolings given in this study were calculated using these T
eqvalues.
Table 1. Experimental Equilibrium Temperatures and Pressures ( T
eqand P
eq) for the Di ff erent Systems Studied in This Work
system oil
NaCl
(wt %) Teq(°C) Peq(bar)
CP hydrates CP 0 7.2±0.2b Patm
4 5.5±0.2b Patm
CP/n-C8a 0 4.5±0.2 Patm
4 3.2±0.4 Patm CP/n-C12a 0 4.7±0.2 Patm 4 3.4±0.4 Patm CH4/C3H8
hydrates
n-C8 0 19.5±0.5c 67±1c 4 18.4±0.5c 64±1c
a
Mixture of 50/50 (v/v).
bFrom ref 7.
cFrom ref 8.
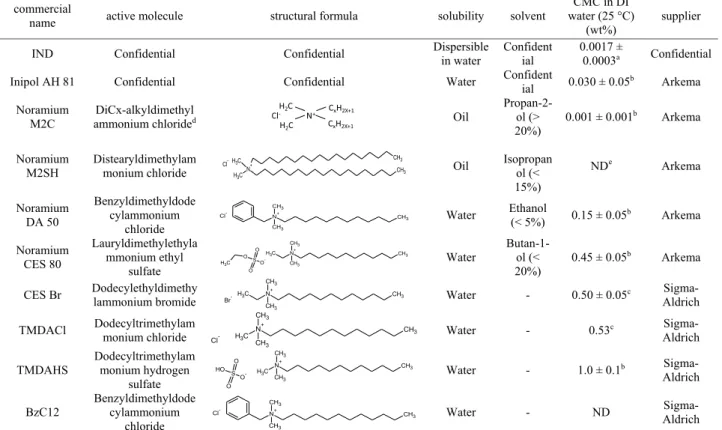
The surfactants and some of their properties are given in Table 2.
IND and AH 81 are commercial antiagglomerants. Noramium M2C, M2SH, DA 50, and CES 80 are quaternary ammonium salts solubilized in different solvents (see Table 1). CES Br, TMDACl, TMDAHS, and BzC12 are “pure” (solvent-free) quaternary ammonium salts. Note that BzC12 is the same basic molecule as Noramium DA 50. All surfactants are used as received.
2.2. Interfacial Tension (IFT) Measurements. IFT measure- ments are performed in a dynamic drop tensiometer (Tracker from Teclis, France), which determines the IFT value from an image analysis by fitting the Laplace equation to the drop profile. The experiments are generally performed in a rising drop configuration, where an oil drop (or air bubble) is formed and maintained at the tip
of a needle in a transparent thermostated vessel containing the surfactant solution.
The surfactant CMC values, which were determined by measuring the IFT (see Table 1), were obtained from the tensiometric profile (IFT vs log[surfactant concentration]) at the intersection between the regression line of the linearly dependent region and the line passing through the plateau (where the IFT is independent of the surfactant concentration).
2.3. Microscopic Observation of Hydrate Formation.
Hydrate growth and morphology are studied by microscopic observation of the interface between the water phase and the oil phase. Figure 1 shows schematic diagrams of the setups used for these experiments.
Table 2. Surfactants, with Some of Their Characteristics and Properties, Used in This Study
a
Determined by conductivity measurements,
bDetermined by surface tension measurements.
cFrom ref 23.
dx = 12 and 14.
eND: not determined.
Figure 1. Schematic diagrams of the experimental setups for microscopic observation of hydrate formation: (a) for CP hydrates and (b) for CH
4/ C
3H
8hydrates. (1) Metal-jacketed vessel; (2) glass tube or horizontal support; (3) oil phase; (4) surfactant solution; (5) hydrate crystal seed; (6) binocular magnifier; (7) LED light table; (8) chiller; (9) high-pressure syringe pump; (10) CH
4/C
3H
8gas mixture; (11) gas storage tank.
DOI:10.1021/acs.energyfuels.9b03395 Energy FuelsXXXX, XXX, XXX−XXX
The main characteristics of the setups and experimental protocols used are described in detail in a previous article.
7In short, an interface between the surfactant solution and the oil phase is created either by successively introducing both phases into the glass tube (Figure 1a) or by placing a drop of the surfactant solution on a horizontal tray immersed in the oil phase (Figure 1b). For the experiments with CH
4/C
3H
8hydrates (Figure 1b), the cell is loaded with the gas mixture at about 70 bar. The temperature of the chiller is set to obtain a subcooling of 6 °C for the CP hydrates and around 10 °C for the gas hydrates (calculated from the equilibrium temperatures given in Table 1). After stabilization at the target subcooling, crystallization in the CP hydrate experiments is triggered by seeding the system with a few small CP hydrate crystals, formed beforehand. In the experiments with CH
4/C
3H
8hydrates, crystallization is triggered by the “memory effect”.
21This means that we force the water drop into an ice formation/melting cycle before placing it on the horizontal support.
Hydrate formation is usually observed a few seconds after the drop has been added. For both hydrate systems, snapshots of the hydrate crystallization are taken and recorded at regular intervals.
2.4. Evaluation of Antiagglomeration Performance. A schematic diagram of the setup is given in Figure 2. It is composed
of a high-pressure autoclave with an internal volume of 360 ± 3 cm
3, equipped with a mixing system with a torque-meter mounted on the stirrer shaft. The motor can deliver a maximum torque of 0.7 N.m.
Torque (C) is measured with an accuracy of 0.2%. A chiller is used to control the temperature inside the autoclave. The temperature (T) in the autoclave is measured with a Pt100 probe (accuracy of ±0.2 °C) immersed in the liquid phase, and pressure (P) is measured with a 0−
100 bar pressure sensor (accuracy of 0.15%FS). For the experiments with CH
4/C
3H
8hydrates, the autoclave is connected to a gas tank that supplies the gas mixture. During the experiments, P, T, and C are recorded at regular intervals. More details on the setup can be found in a previously published paper.
7All the experiments are performed with a water/oil ratio of 30:70 (v/v%). The protocols used are briefly described below:
For CP Hydrates. About 45 cm
3of the surfactant solution and 105 cm
3of a CP phase containing 2 wt % n-C12 are introduced into the autoclave. n-C12 is used as a chemical marker in the CP phase to evaluate the water-to-hydrate conversion at the end of the hydrate formation (see the paragraph “Determining the water-to-hydrate conversion” in the work by Delroisse et al.).
7The agitation speed is set to 200 rpm, and the system is cooled to obtain a subcooling of 6
° C. Once the system temperature is stable, stirring is stopped and the reactor is brie fl y opened so that the system can be seeded with a few CP hydrate crystals, formed beforehand. The autoclave is then shut again, and stirring resumes. Hydrate formation, which is detected by an increase in the autoclave temperature, generally occurs a few
minutes after the seeding. Once the reaction is over, i.e., when the autoclave temperature drops back to the target temperature, agitation is stopped and the reactor opened to collect (whenever possible) samples of the oil phase and the hydrate particles. The former are analyzed by gas chromatography, using a HP 6890 GC system equipped with an FID detector and a CP-SimDist Ultimetal (10 m × 0.53 mm × 0.17 μm) column, in order to determine the concentration of n-C12 in the oil phase and then calculate the molar ratio of water- to-hydrate conversion, W, based on eq 1:
W
n N
n
1
CCP C h
w C12i C12f
i
k jjj y
{ zzz
=
−
(1) where n
CPis the number of moles of CP, C
C12iand C
C12fare the mass of n-C12 per the unit of mass of CP in the oil phase before and after hydrate formation, N
his the hydration number (N
h= 17), and n
wis the number of moles of water introduced into the autoclave.
The collected hydrate particles are immersed in cold CP (0 °C) and observed by microscopy to determine their shape, diameter, and wettability. The mean value of the hydrate particle diameter is evaluated by measuring the diameter of at least 30 particles.
For CH
4/C
3H
8Hydrates. About 36 cm
3of the surfactant solution and 84 cm
3of n-C8 are introduced into the autoclave. The reactor is closed, connected to the gas storage tank, and rapidly flushed twice with about 3 bar of the CH
4/C
3H
8gas mixture to remove air. It is then pressurized with the gas mixture to an equilibrium pressure of 70
± 1 bar under agitation (200 rpm) at 25 °C. Hydrate formation is triggered by the “ memory e ff ect ” : the system is cooled to 2 ° C to force hydrate formation and then heated to 25 ° C (about 6 ° C above the hydrate equilibrium temperature) to decompose the hydrates formed. The system is maintained at this temperature for 2 h before being cooled to 10 °C without agitation. When the system temperature and pressure are stable, a gas chromatography (GC) analysis of the gas phase is performed and then agitation is resumed (200 rpm). In our experiments, hydrate formation generally occurs a few minutes after agitation starts again. The system pressure decreases due to gas being consumed by the hydrates being formed, and then reaches a constant value at the end of the hydrate formation. A new GC analysis of the gas phase is performed before increasing the system temperature to melt the hydrates. The GC analyses before and after hydrate formation serve to calculate the compressibility factors in eq 2, which is used to determine W:
( )
W
N n
V RT
P z
P
z h
w
g i
i f
=
f−
(2) where the subscripts i and f refer to the initial and final states, P is the autoclave pressure, T is the autoclave temperature, V
gis the gas volume in the autoclave, R is the gas constant, and n
wis the total number of moles of water. z
iand z
fare the compressibility factors of the gas mixture obtained from the Peng − Robinson equation of state.
N
his the hydration number (N
h= 6.1) calculated by determining the equilibrium temperature value for a system of CH
4/C
3H
8, water, and n-C8, by running CSMGem
1at 70 bar and at the same molar fractions as used in the experiments. Note that this N
hvalue is a rough estimation since the composition of the hydrates formed in our experiments is variable due, in particular, to the continuous change in the gas phase composition during hydrate formation.
The volume fraction Φ of the hydrate phase formed in both hydrate systems (CP hydrates and CH
4/C
3H
8hydrates) is calculated with the help of eq 3:
V
V ( V V W ) V
h
h w w o
Φ = + − + (3)
where the subscripts h, w, and o refer to the hydrates, water, and oil, respectively; V is the volume. The volume of the hydrate phase (V
h= V
wWϑ) is calculated taking in account the volume expansion between the liquid water and the hydrate (noted ϑ) equal to 1.18 for CP Figure 2. Schematic diagram of the experimental setup used for the
evaluation of antiagglomeration performance: (1) high-pressure autoclave; (2) oil phase + surfactant solution; (3) air or CH
4/C
3H
8gas mixture; (4) stirring system + torque-meter; (5) gas storage tank
(used only for the experiments with CH
4/C
3H
8hydrates); (6) chiller.
hydrates and 1.13 for CH
4/C
3H
8hydrates (obtained using CSMGem).
Note that, for CP hydrates, V
ocorresponds to the volume of CP at the end of hydrate formation (i.e., the initial volume of CP minus the volume of CP consumed by hydrate formation). For both hydrate systems, the variation in the torque measured during the hydrate formation serves to qualitatively compare the degree of agglomeration of the hydrate particles.
3. RESULTS AND DISCUSSION
3.1. Hydrate Growth and Morphology. In the following section, we describe and comment in detail the growth and morphology of hydrate crystals formed at a quiescent w/o interface as observed in the reference system (without surfactant) and in the three main cases observed in the presence of a surfactant in this study. For all four systems, observations were made both for CP hydrate crystals and for CH
4/C
3H
8-hydrate crystals. The surfactant concentration was 0.1 wt % of the aqueous phase.
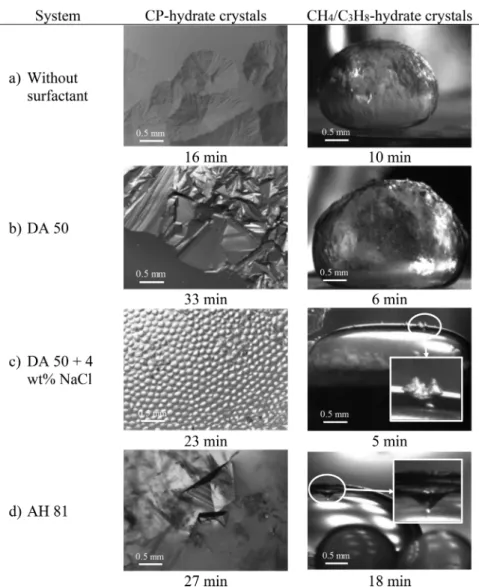
Figure 3 shows snapshots of hydrate formation, which were taken at the w/o interface, without and with surfactant. For the other surfactants, the experiments were conducted with CP
hydrates only, and all the results obtained are summarized in Table 2.
Without surfactant (Figures 3a), a wrinkled hydrate shell formed and grew, progressively covering the whole w/o interface. In the presence of DA 50 (Figure 3b), platelike polygonal hydrate crystals developed and agglomerated, rapidly forming a hydrate shell that grew on the interface. While the hydrate shell was growing, it collected individual crystals newly formed elsewhere on the interface that were evidently attracted to it (see Supporting Information A). The wettability of the CP hydrate shell was evaluated by placing on it a drop of the cold surfactant solution. The drop spread on the shell, demonstrat- ing that the shell was wetted by the solution.
For the solution containing 0.1 wt % DA 50 and 4 wt % NaCl (Figure 3c), a large number of small individual pyramidal crystals with the vertex pointing to the oil phase formed at the interface. These crystals gathered into large clusters but did not immediately stick to one other and, in the case of CP hydrates, not until the interface was crowded (see Supporting Information B). The fact that the vertices were in the oil phase suggests that the crystals were hydrophobic.
Figure 3. Microscopic observations of CP hydrate and CH
4/C
3H
8-hydrate crystals at the water/oil interface. The interface is seen from above in
the CP hydrate experiments and from the side in the experiments with CH
4/C
3H
8hydrates. The surfactant concentration is 0.1 wt % (of the
aqueous phase). The oil phases and the subcoolings used in the experiments with CP hydrates and CH
4/C
3H
8hydrates are CP and n-C8, and 6
and 10 °C respectively. The cell pressure for the CH
4/C
3H
8hydrates is 66 bar. The initial time (t = 0) corresponds to the seeding of the system.
For the systems with AH 81 (Figure 3d), hollow-conical crystals with the vertex pointing to the aqueous phase formed at the w/o interface. Such a shape had already been observed by Karanjkar et al.
12for CP hydrate crystals formed in the presence of the nonionic surfactant, Span 80. The crystals grew, pinned by their base to the w/o interface, and then sank into the aqueous phase. Their migration from the interface to the aqueous phase shows that these crystals were hydrophilic.
In the case of some surfactants that induced the formation of individual hydrate crystals, we observed crystals with shapes other than conical or pyramidal. For example with the surfactant CES 80, the crystals formed were fi brous (see Figure S1 of Supporting Information C).
The wettability of the hydrate crystals depends on the con fi guration of the surfactant molecules adsorbed on the hydrate surface. When no surfactant molecules are adsorbed, the hydrate surface is wetted by water.
22When the hydrate particles are preferentially wetted by the oil phase, this means that the surfactant molecules are adsorbed head-down, with the headgroup attached to the hydrate surface and the tail of the alkyl chain oriented away from it. If they are wetted by the surfactant solution, the headgroup of the adsorbed surfactant molecules is oriented away from the hydrate surface. This type of con fi guration is expected when the adsorbed surfactant molecules form a bilayer on the hydrate surface.
For some of the surfactants studied, the morphology experiment on CP hydrates was also performed with an oil phase composed of a 50/50 vol % mixture of CP and n-C8 or n-C12 (which are alkanes that do not form hydrates). We found that the presence of n-C8 or n-C12 in the oil phase had no major e ff ect on hydrate morphology. For example, with the surfactant solution of 0.1 wt % AH 81, hollow-conical crystals still formed at the w/o interface (Figure 4) and then sank into
the water phase. However, we qualitatively observed that the hydrate growth rate was signi fi cantly reduced. Note that these results are consistent with those obtained in our previous study performed with DA 50 solutions and the same oil mixtures.
73.2. Antiagglomeration Performance. In this paragraph, we present the results of the torque measurements performed on the four systems studied in the previous paragraph (i.e., the reference system (without surfactant), and the systems with DA 50, DA 50 + NaCl, and AH 81). The experiments were conducted for CP hydrate and CH
4/C
3H
8-hydrate systems.
For the other surfactants, the experiments were conducted with CP hydrates only, and all the results obtained with these hydrates are summarized in Table 3. Note that we used a
surfactant concentration of 1 wt % for these experiments (instead of 0.1 wt % in the morphology experiments). The reason for this is that stirring the system to measure torque causes a huge increase in the area of the water/oil interface (compared to the quiescent system in the morphology experiments). Since hydrate formation occurs mainly at the w/o interface, a larger area requires a higher surfactant reserve for adsorption and consequently a higher initial surfactant concentration. It is also important to note that the type of emulsion (water-in-oil or oil-in-water) initially formed depends on the phase in which the surfactant used is soluble. According to Bancroft ’ s rule, a water-soluble surfactant will produce an oil-in-water emulsion, whereas an oil-soluble surfactant will produce a water-in-oil emulsion.
16The type of emulsion formed for each surfactant system is given in Table 3.
Figure 5 shows the torque (C) and temperature (T) values as a function of time (t) for both hydrate systems for a period ranging from a few dozen minutes before the onset of the hydrate crystallization (detected by an increase in the system temperature) to a few dozen after the end of the hydrate formation. Pressure (P) as a function of time is also shown for the CH
4/C
3H
8-hydrate system.
For all the systems, the hydrate formation induced a signi fi cant increase in T (of several ° C), which then decreased again to the target temperature once the reaction had stopped.
In addition, for the CH
4/C
3H
8-hydrate systems, hydrate formation consumed part of the gas phase and caused a decrease in P. In the experiments where we could determine the volume fraction of the hydrate phase ( Φ ), we found that Φ was around 0.36 for the CP hydrate systems without salt and 0.24 for those with salt (4 wt % NaCl) at the end of the hydrate formation stage. For the CH
4/C
3H
8-hydrate systems, Φ was about 0.18 without salt, and 0.14 with salt (see Table 3). Note that conversion of 100% of the initial water to hydrates would correspond to a hydrate volume fraction of 0.37 for CP hydrates and 0.33 for CH
4/C
3H
8-hydrates.
Consequently, for the CP hydrate systems without salt, almost no unreacted water remained at the end of the hydrate formation.
Depending on the system, we observed two main trends for the variation of C vs t: (i) a signi fi cant increase in C, observed in most cases soon after the onset of hydrate formation, followed after a while by a sudden drop to the baseline (Figure 5a and b), and (ii) C remained almost constant throughout the experiment (Figure 5c and d). Three possible scenarios have been identi fi ed, through direct observation of the agglomer- ation state of the CP hydrates in the autoclave, as a possible cause of the sudden drop of C observed in case (i): the agitator stopping, due to large hydrate blocks, which occurs when the maximum torque (0.7 N.m) that can be delivered by the motor is reached (this occurred in the CP hydrate system without surfactant (Figure 5a)); hydrate blocks, gathered between the blades of the agitator and rotating with it, or,in the case of the system with a hydrophilic surfactant, an inversion of the continuous phase (i.e., the CP became the continuous phase) that occurred when the amount of free water became too low to accommodate oil droplets. The latter case was directly observed for the CP hydrate systems with a water-soluble surfactant (e.g., DA 50) and without salt, in which almost all the initial water present in the system was converted to hydrates. Without free liquid water available in the system, capillary bridges between the hydrate particles could not form (the CP hydrate particles were “ dry ” ), which limited the Figure 4. Microscopic observation of a CP hydrate crystal formed at
the water/oil interface, where the oil phase is a mixture of CP and n- C8 (50/50 vol/vol). The water phase contains 0.1 wt % of AH 81.
The subcooling is 6 °C.
Table 3. Results of the Microscopic Observations and of the Evaluation of the Antiagglomeration Performance for the Di ff erent Surfactants and Conditions Studied in This Work
fmicroscopic observations at the water/oil interface
aautoclave experiments with CP hydrates (and CH
4/C
3H
8hydrates)
bsurfactant emulsion type emulsion stability (min)
bIFT at 1
°C (mN/m)
bcrystal morphology average crystal size (
μm) agglom rate of crystals wetting hydrate volume fraction average particle size (
μm) wetting perf AA without <1 49 shell
−fast water
−(0.17) >10 000 water bad (bad) IND w/o <1 10 polygonal 100 slow oil 0.36
±0.02 (0.15)
∼10 oil good (good) AH81 w/o <1 <1 hollow conical 1000 no
gwater 0.36
±0.02 (0.19) 380
±150 water good (good) AH81 + 4 wt % NaCl w/o ND
f<1 hollow conical 1000 no water 0.24
±0.02 450
±120 water good AH81
cw/o ND <1 hollow conical 1000 no water 0.22
±0.02 400
±100 water good DA50 o/w 48 2.5 plates
−fast water 0.36
±0.03 (0.18) 660
±120 water bad (bad) DA50
co/w ND 3.4 plates
−fast water >10 000 water bad DA50
do/w ND 3.9 plates
−fast water 0.22
±0.02 >10 000 water bad DA50 + 4 wt % NaCl o/w 15 <1 pyramidal 200 slow oil 0.26
±0.04 (0.14) 70
±15 oil good (good) DA50 + 4 wt % NaCl
co/w 30 <1 pyramidal + plates
e100 slow oil
−e65
±15 oil good DA50 + 4 wt % NaCl
do/w 15 <1 pyramidal + plates
e300 slow oil
−e−oil good BzC12 o/w 45 2.8 plates
−fast water 0.36
±0.03 ND ND bad BzC12 + 4 wt % NaCl o/w 10 <1 pyramidal 200 slow oil 0.24
±0.04 ND ND good CES 80 o/w 44 3.2
fibrous 100 slow 0.36
±0.02 40
±15 oil good CES Br o/w 22 4.4 granular plates
−fast water
−−water bad TMDACl o/w 15 7.6 plates
−fast
−−−−bad TMDAHS o/w 1 7.2 pyramidal + swords 500 slow water
−150
±50 water good M2C w/o <1 3.9 plates
−fast water 0.36
±0.02 700
±160 water bad M2SH w/o <1 granular plates
−slow oil 0.36
±0.02 110
±40 oil good
aSurfactant concentration of 0.1 wt %.
bSurfactant concentration of 1 wt %.
cThe oil phase used is a 50/50 vol% mixture of CP and n -C8.
dThe oil phase used is a 50/50 vol% mixture of CP and n -C12.
eSubcooling of ∼ 4.5 ° C; − : the measurement was not possible.
fND: not determined.
gno: the crystals formed sank in the water phase.
agglomeration of particles.
24As a consequence, the torque C dropped to a low value (around the baseline) and the CP hydrate slurry that had formed became fl owable. Actually, before the inversion of the continuous phase, the system was a jellylike material, a state that is incompatible with the transportation of hydrates in a pipeline. Moreover, the sudden decrease in C observed for the CH
4/C
3H
8systems with a water-soluble surfactant (Figure 5b) was probably due to an
inversion of the continuous phase, although almost half of the
liquid water initially present was not converted to hydrates at
the end of the reaction. As already reported by Moradpour et
al.,
25gas hydrate formation can induce a change in the
emulsion type. These authors observed emulsion inversion for
a volume fraction of hydrates of 0.01 − 0.11 depending on the
systems they studied. In our case, as an example, the volume
Figure 5. Torque (C), temperature (T), and pressure (P) versus time (t) for the CP hydrate system, and the CH
4/C
3H
8-hydrate system. For the
systems containing surfactant, the surfactant concentration is 1 wt %. For the CP hydrate system, P = P
atm.
fraction of hydrates formed in the presence of DA 50 (Figure 5b) just before the decrease in C was about 0.16.
The systems in which free water is present when the hydrates have formed and in which C remained relatively stable throughout the experiment (case ii) prove that the surfactants used have a good capacity to prevent or limit the formation of capillary bridges between the hydrate particles and, therefore, have antiagglomeration properties.
The size of the hydrate particles, measured for the CP hydrate systems at the end of hydrate formation, ranged from several dozen micrometers to a few centimeters (see Table 3).
Note that the wettability of these hydrate particles, evaluated by placing a drop of the cold aqueous solution on the particles immersed in cold CP, was the same as the wettability deduced from the microscopic observations of the CP hydrate crystals at the water/CP interface (e.g., the hydrate particles formed in the presence of 1 wt % DA 50 and 4 wt % NaCl were not wetted by a drop of the surfactant solution, and the (pyramidal) hydrate crystals formed at the water/CP interface were hydrophobic).
3.3. Results for Di ff erent Surfactants and Conditions.
Table 3 summarizes the results of the microscopic observations (crystal morphology, crystal size, “ rate ” of agglomeration, and wetting behavior) and of the evaluation of the antiagglomera- tion performance (hydrate fraction, particle size, wetting behavior, and a qualitative description of the AA performance) for all the surfactants (10) considered in this work. Some of the surfactants were studied at di ff erent conditions (e.g., with or without NaCl, or with another oil phase (mixture of 50 vol
% n-C8 or n-C12 and 50 vol % CP)). Some additional information, including the type of emulsion initially formed (oil-in-water or water-in-oil) during the evaluation of the AA performance, the emulsion stability (evaluated as the time required for separation of 60 vol % of the initial continuous phase), and the equilibrium value of the IFT between the aqueous and the oil phases, is also given in Table 3.
The AA performance of the surfactants was quali fi ed as
“ good ” if torque C remained (almost) constant throughout the hydrate formation experiment (e.g., as in Figure 5c and d). For these systems, when stirring was stopped for 1 h after the hydrates had formed and then resumed, C returned to the value it had reached before the stirring was interrupted (Figure S2 of Supporting Information D). During the shut-in period, gravitational segregation of the fl uids in the system toward a hydrostatic equilibrium occurred. Because of their intermediate density, the hydrate particles tended to gather and form a layer at the water/oil interface. Restarting the stirring broke the hydrate layer and redispersed the hydrate particles in the continuous phase. This shows that the surfactants evaluated as
“ good ” , e ffi ciently prevent the hydrate particles from agglomerating into large masses.
The values or comments between brackets in Table 3 refer to the CH
4/C
3H
8-hydrate systems. Several trends can be inferred from the results presented in Table 3:
(i) The surfactants that induced the formation of hydrate crystals, which rapidly agglomerated and then grew as a continuous crust at the water/CP interface exhibited poor AA performance.
(ii) The surfactants that induced the formation of individual oil-wettable crystals, which grew separately at the water/CP interface, showed good AA performance.
(iii) The surfactants that caused the formation of individual water-wettable crystals, which grew separately at the water/CP
interface, displayed good AA performance if they drastically reduced the water/oil IFT (e.g., AH 81, for which IFT < 1 mN/m). In the case of a lesser reduction of the IFT, the surfactants showed poor AA performance (e.g., TMDACl, for which IFT = 7.6 mN/m). TMDAHS, which reduced the IFT as much as TMDACl, was an exception to this rule. As we will see below, the possible cause of this behavior could be the nature of the counterion of the surfactant molecule.
These results can be interpreted by referring to the main action mechanisms of the surfactant molecules which theoretically make them e ff ective antiagglomerants.
26First of all, these molecules must adsorb e ffi ciently on the hydrate surface and introduce repulsions (steric or/and electrostatic) in order to prevent any contact between the hydrate particles.
In systems where liquid water and hydrate particles are simultaneously present and dispersed in a continuous oil phase, they must also prevent or reduce capillarity. Actually, in the absence of any surfactants in the system, the hydrate surface is preferentially water-wet. Consequently, liquid water can form bridges between hydrate particles, creating an attractive force between them. For two spherical particles of radius a at contact, this force can be estimated by
F
S= 2 π γ a
wocos( ) θ
p(4)
where γ
wois the IFT between the water and oil and θ
pis the contact angle of the water on the hydrate particle.
The capillary force between two particles bridged by liquid water and separated by a distance d is generally several orders of magnitude greater than the attractive dispersion forces that exist between them.
26It can be inferred from eq 4 that capillary forces can be signi fi cantly reduced or eliminated if θ
pincreases (i.e., the water-wettability of the hydrate surface decreases) and γ
wodecreases.
The surfactants that induced the formation of hydrate crystals and hydrate particles preferentially wetted by the oil phase showed good AA performance, meaning that they managed to drastically reduce or eliminate the capillary forces.
They also led to the formation of small hydrate particles (<100 μ m), for which the attractive dispersion forces are weaker than for larger particles.
27For the surfactants that induced the formation of hydrate crystals and hydrate particles preferentially wetted by the water phase and that displayed poor AA performance, the contact angle was not (su ffi ciently) increased and the IFT insu ffi ciently reduced to prevent capillary adhesion of the hydrate particles.
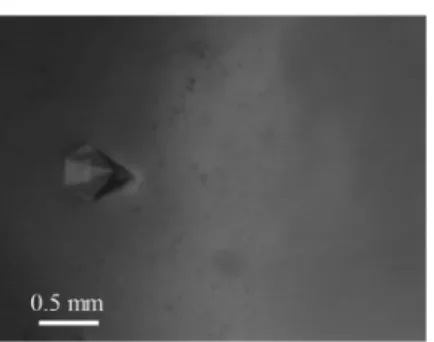
Moreover, the hydrate particles, which were observed at the end of the CP hydrate experiments, were large (>500 μ m) and generally composed of smaller particles that had fused together probably after the conversion to hydrates of the liquid water forming bridges between them (Figure 6).
Finally, in the case of surfactants that exhibited good AA performance, even though they induced the formation of hydrate crystals and hydrate particles preferentially wetted by the water phase, the IFT was su ffi ciently decreased to drastically reduce the capillary adhesion between the hydrate particles. These surfactants produced hydrate particles of intermediate size (between 100 and 500 μ m). As in the latter case, the hydrate particles observed at the end of the CP hydrate experiments were composed of smaller particles that had fused together. This observation con fi rms that the surfactants did not totally eliminate the capillary adhesion.
However, the fact that the torque C returned to its initial value
after a shut-in period of 1 h suggests that the steric barrier
formed by the adsorbed surfactant molecules signi fi cantly limited the contacts between the hydrate particles.
Some other interesting trends can be inferred from Table 3:
(i) The type of emulsion initially formed (water-in-oil or oil- in-water), which is mainly governed by the solubility of the surfactant (Bancroft ’ s rule), does not give any indication of the AA potential of the surfactant molecule. As an example, IND and CES 80 produced di ff erent types of emulsions (water-in- oil for IND, and oil-in-water for CES 80), but both surfactants showed good AA performance.
(ii) Several studies have reported that the stability of the w/
o emulsion is an important criterion in preventing hydrate agglomeration: the higher the stability, the lower the agglomeration.
28,29In the present work, the w/o emulsions formed with IND, AH81, or M2SH separated almost immediately, but the AA performance of these surfactants was good. This result is, however, consistent, with those of other authors who reported that a stable emulsion is not a prerequisite for an e ff ective antiagglomerant.
30,31(iii) A surfactant can display poor AA performance in a given system composition and good performance in another.
As an example, adding 4 wt % NaCl to the 1 wt % DA 50 solution changed the wettability of the hydrate particles from water to oil and drastically reduced the w/o IFT, thus eliminating the capillary adhesion between the hydrate particles. The salt enhanced the adsorption of the DA 50 molecules, both at the w/o interface, drastically reducing the IFT, and at the hydrate surface, undoubtedly producing a tightly packed surfactant layer responsible for the change in wettability. In addition, the size of the hydrate particles was signi fi cantly reduced (from 700 to 70 μ m), which weakened the attractive dispersion forces between them.
(iv) The oil phase compositions investigated appeared to have less e ff ect on crystal morphology and AA performance than the addition of NaCl. This is consistent with the fact that salt has a higher impact than the type of oil on the a ffi nity of ionic surfactants for the adjacent phases, and thus on surfactant adsorption.
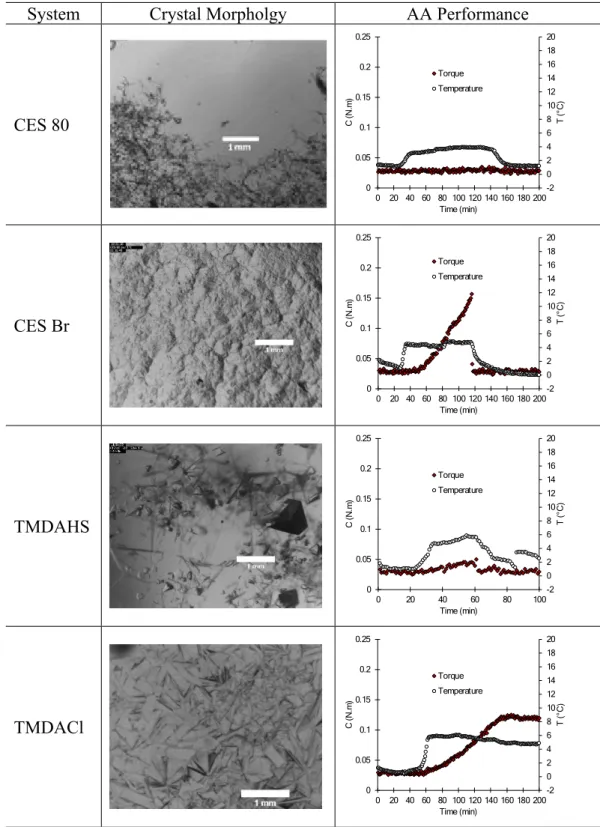
32,33(v) For a given system composition, the nature of the counterion of the surfactant molecule may drastically change AA performance. As an example, CES 80 and CES Br di ff er only by their counterion: ethylsulfate for CES 80 and bromide for CES Br. The former showed good AA performance, whereas the latter showed poor performance. The reduction in the w/o IFT was almost the same for both surfactants (45.8 mN/m for CES 80 and 44.6 mN/m for CES Br), but CES 80 produced individual fi brous hydrate crystals at the water/CP interface observed under the microscope and oil-wettable
hydrate particles in the AA performance experiments, whereas CES Br produced a hydrate crust composed of granular plates at the water/CP interface, microscopically observed, and water-wettable particles in the AA performance experiments (Figure S3 of Supporting Information E). Another example is TMDACl and TMDAHS, which also have a di ff erent counterion: chloride for the former and hydrogen sulfate for the latter. They caused almost same reduction in the w/o IFT ( ∼ 41.5 mN/m), but TMDAHS showed better AA perform- ance than TMDACl did (Supporting Information E). The e ff ect of the nature of the counterion of a surfactant molecule on its AA performance is due to be further investigated in a future study. However, the experimental results obtained with CES 80, CES Br, TMDACl and TMDAHS suggest that the presence of a large counterion has a bene fi cial e ff ect on the capacity of the surfactant molecule to act as a good antiagglomerant.
The size of the counterion is known to in fl uence the adsorption behavior of surfactant molecules at a liquid/liquid or a liquid/gas interface,
23but, to the author ’ s knowledge, there is no information available in the literature concerning what happens at a solid/liquid interface. The hydrated counterions are expected to reside in close proximity to the ionized surfactant molecules. Consequently, large counterions in close proximity to the surfactant molecules adsorbed on the hydrate surface might hinder hydrate crystal growth more than small counterions by limiting the access of free water to the growing hydrate surface. This could be the reason why, in the presence of large counterions, we observed the formation of fi brous crystals. The enhanced antiagglomeration capacity of the surfactants in the presence of large counterions is probably not due to a greater capacity of adsorption of the surfactant at the hydrate surface. Actually, by analogy with surfactant adsorption at a fl uid interface,
23large counterions should reduce the amount of surfactant molecules adsorbed on the hydrate surface, and thus lead to the formation of a loosely packed surfactant fi lm, which should provide less protection against particle agglomeration. The enhanced AA performance of the surfactants might be due to the presence of the counterions in the quasi-liquid layer (QLL) of the water at the hydrate surface.
34Large counterions might provide additional e ffi cient steric/ionic repulsions to those caused by the adsorbed surfactant molecules.
(vi) The similarities between the shapes of the CP hydrate crystals and the CH
4/C
3H
8-hydrate crystals formed at the w/o interface (Figure 3) and between the AA performance of the surfactants for both hydrate systems (Figure 5) support the claim that CP hydrates can be considered as an interesting analogue for sII gas hydrates in order to rapidly evaluate the antiagglomeration potential of a surfactant.
6−8(vii) Finally, the experimental results obtained with the different surfactants and in the different conditions used in this work suggest that the correlation that we had already proposed in previous studies with regard to the antiagglomeration performance of two surfactants (DA 50 and AH 81) could be generalized:
7,8the surfactant that induces the formation of individual hydrate crystals at the water/CP interface that have a poor tendency to agglomerate exhibits good AA perform- ance. So, the microscopic observation of the morphology and growth pattern of CP hydrate crystals formed at a quiescent water/CP interface could be considered as a simple and fast way of assessing whether a surface-active molecule has an antiagglomeration e ff ect on sII gas hydrates.
Figure 6. Hydrate particles composed of smaller hydrate particles that
have fused together. The hydrate particles are immersed in cold CP
(∼0 °C). System: water, CP, and 1 wt % of the surfactant M2C.
4. CONCLUSION
The main conclusions of these experiments are as follows:
Surfactants with good AA properties induce the formation of individual hydrate crystals with a low tendency to agglomerate at a quiescent w/o interface.
Surfactants with good AA properties do not necessarily produce hydrate particles preferentially wetted by the oil phase. If the particles are preferentially wetted by the surfactant solution, it can generally be inferred that the surfactant has su ffi ciently reduced the w/o interfacial tension to prevent the capillary adhesion of the hydrate particles.
The AA capacity of a surfactant is not related to the type (water-in-oil or oil-in-water) and stability of the emulsions formed.
The composition of the system might enhance or compromise the AA performance of a surfactant.
For a given system composition, the nature of the counterion might enhance or compromise the AA performance of a surfactant.
CP hydrates are a good analogue for sII-gas hydrates when studying the e ff ect of surfactants on hydrate crystal morphology and growth pattern, and on hydrate particle agglomeration.
The microscopic observation of the morphology and growth pattern of CP hydrate crystals formed at a quiescent surfactant solution/CP interface might be a simple and fast way of assessing the potential of surfactant molecules to act as antiagglomerants on sII gas hydrates.
Of course, a surfactant evaluated as a potentially good AA based on the microscopic observation of CP hydrates should be further tested on a real system (with a real crude oil, water phase, and gas phase) to con fi rm or invalidate the results.
■ ASSOCIATED CONTENT
*
SSupporting Information
The Supporting Information is available free of charge at https://pubs.acs.org/doi/10.1021/acs.energyfuels.9b03395.
Snapshot of the CP hydrate crystals formed at the water/CP interface in the presence of 0.1 wt % CES 80;
e ff ect on the torque (C) of stopping and resuming stirring in a system containing a surfactant evaluated as a
“ good ” antiagglomerant; e ff ect of the counterion of the surfactant on the shape of CP hydrate crystals formed at the water/CP interface and on the torque vs the time measured in the AA performance experiments (PDF) Video of individual crystals, newly formed on the water/
CP interface, which are attracted to the hydrate shell growing on the interface; the system contains 0.1 wt % DA 50 (AVI)
Video of individual pyramidal crystals, newly formed on the water/CP interface, which gather into large clusters but do not stick to one other until the interface is crowded; system contains 0.1 wt % DA 50 and 4 wt % NaCl (AVI)
■ AUTHOR INFORMATION Corresponding Author
*Phone: +33559407682. E-mail: christophe.dicharry@univ- pau.fr.
ORCID
C. Dicharry: 0000-0002-6318-3989
J.-P. Torré: 0000-0001-5735-8626 Notes
The authors declare no competing fi nancial interest.
■ ACKNOWLEDGMENTS
The authors are grateful to ARKEMA for financially supporting this work and for supplying the cationic surfactants. Philippe Glénat (TOTAL) is gratefully acknowledged for his valuable scienti fi c input and discussions. The authors would also like to extend their thanks to Joseph Diaz (UPPA) for his technical assistance.
■ (1) Sloan, E. D.; Koh, C. A. REFERENCES Clathrate Hydrates of Natural Gases, 3rd ed.; CRC Press, Taylor & Francis Group: Boca Raton, FL, 2008.
(2) Kelland, M. A. Production Chemicals for the Oil and Gas Industry;
CRC Press, Taylor & Francis Group: Boca Raton, FL, 2009.
(3) Sloan, E. D.; Koh, C. A.; Sum, A. K. Natural Gas Hydrates in Flow Assurance; Gulf Professional Publishing, Elsevier, 2011.
(4) Zerpa, L. E.; Salager, J.-L.; Koh, C. A.; Sloan, E. D.; Sum, A. K.
Surface chemistry and gas hydrates in flow assurance. Ind. Eng. Chem.
Res. 2011, 50, 188−197.
(5) Li, X.; Negadi, L.; Firoozabadi, A. Anti-agglomeration in cyclopentane hydrates from bio- and co-surfactants. Energy Fuels 2010, 24, 4937−4943.
(6) Abojaladi, N.; Kelland, M. A. Can cyclopentane hydrate formation be used to screen the performance of surfactants as LDHI anti-agglomerants at atmospheric pressure? Chem. Eng. Sci.
2016, 152, 746 − 753.
(7) Delroisse, H.; Torré, J.-P.; Dicharry, C. Effect of a quaternary ammonium salt on the growth, wettability, and agglomeration of structure II hydrate crystals. Energy Fuels 2018, 32, 12277 − 12288.
(8) Delroisse, H.; Barreto, G.; Torré, J.-P.; Dicharry, C. Evaluation of the performance of a new biodegradable AA-LHDI in cyclopentane hydrate and CH
4/C
3H
8gas hydrate systems. SPE-195054-MS;
MEOS, Bahrain, 2019.
(9) Delroisse, H.; Plantier, F.; Marlin, L.; Dicharry, C.; Frouté, L.;
André, R.; Torré, J.-P. Determination of thermophysical properties of cyclopentane hydrate using a stirred calorimetric cell. J. Chem.
Thermodyn. 2018, 125, 136−141.
(10) Yalkowsky, S. H.; He, Y.; Jain, P. In Handbook of Aqueous Solubility Data; Second ed.; CRC Press, Boca Raton, FL, 2010; p 158.
(11) Mitarai, M.; Kishimoto, M.; Suh, D.; Ohmura, R. Surfactant effects on the crystal growth of clathrate hydrate at the interface of water and hydrophobic-guest liquid. Cryst. Growth Des. 2015, 15, 812−821.
(12) Karanjkar, P. U.; Lee, J. W.; Morris, J. F. Surfactant effects on hydrate crystallization at the water-oil interface: hollow-conical crystals. Cryst. Growth Des. 2012, 12, 3817−3824.
(13) Delroisse, H.; Torré, J.-P.; Dicharry, C. Effect of a hydrophilic cationic surfactant on cyclopentane-hydrate crystal growth at the water/cyclopentane interface. Cryst. Growth Des. 2017, 17, 5098 − 5107.
(14) Dann, K.; Rosenfeld, L. Surfactant effect on hydrate crystallization at the oil/water interface. Langmuir 2018, 34, 6085 − 6094.
(15) Aman, Z. M.; Sloan, E. D.; Sum, A. K.; Koh, C. A. Lowering of clathrate cohesive forces by surface active carboxylic acids. Energy Fuels 2012, 26, 5102−5108.
(16) Hou, G.; Liang, D.; Li, X. Experimental study on hydrate anti- agglomeration in the presence of rhamnolipid. RSC Adv. 2018, 8, 39511−39519.
(17) Stoporev, A. S.; Semenov, A. P.; Medvedev, V. I.; Sizikov, A. A.;
Gushchin, P. A.; Vinokurov, V. A.; Manokov, A. Y. Visual observation
of gas hydrates nucleation and growth at a water-organic liquid
interface. J. Cryst. Growth 2018, 485, 54.
(18) Yang, S.-o.; Kleehammer, D. M.; Huo, Z.; Sloan, E. D.; Miller, K. T. Temperature dependence of particle-particle adherence forces in ice and clathrate hydrates. J. Colloid Interface Sci. 2004, 277, 335−341.
(19) Wang, S.; Fan, S.; Lang, X.; Wang, Y.; Wang, P. Particle size dependence of clathrate hydrate particle cohesion in liquid/gaseous hydrocarbons. Fuel 2020, 259, 116201.
(20) Saikia, T.; Mahto, V. Evaluation of soy lecithin as eco-friendly biosurfactant clathrate hydrate antiagglomerant additive. J. Surfactants Deterg. 2018, 21 (1), 101−111.
(21) Stern, L. A.; Kirby, S. H.; Durham, W. B. Peculiarities of methane clathrate hydrate formation and solid-state deformation, including possible superheating of water ice. Science 1996, 273, 1843−
1848.
(22) Fotland, P.; Askvik, K. M. Some aspects of hydrate formation and wetting. J. Colloid Interface Sci. 2008, 321, 130−141.
(23) Rosen, M. J.; Kunjappu, J. T. Surfactants and Interfacial Phenomena; Wiley & Sons, Inc., Hoboken, NJ, 2012.
(24) Talley, L. D.; Turner, D.; Priedeman, D. J. Method of generating a non-plugging hydrate slurry. U.S. Patent 60/782, 449, 2007.
(25) Moradpour, H.; Chapoy, A.; Tohidi, B. Phase inversion in water-oil emulsions with and without gas hydrates. Energy Fuels 2011, 25, 5736−5745.
(26) Anklam, M. R.; York, J. D.; Helmerich, L.; Firoozabadi, A.
Effects of anti-agglomerants on the interactions between hydrate particles. AIChE J. 2008, 54, 565−574.
(27) Israelachvili, J. N. Intermolecular and surface forces, 2nd ed.;
Academic Press, San Diego, 1992.
(28) Lachance, J.; Sloan, E. D.; Koh, C. Effect of hydrate formation/
dissociation on emulsion stability using DSC and visual techniques.
Chem. Eng. Sci. 2008, 63, 3942−3947.
(29) Sjöblom, J.; Øvrevoll, B.; Jentoft, G.; Lesaint, C.; Palermo, T.;
Sinquin, A.; Gateau, P.; Barré, L.; Subramanian, S.; Boxall, J.; Davies, S.; Dieker, L.; Greaves, D.; Lachance, J.; Rensing, P.; Miller, K.; Sloan, D.; Koh, C. Investigation of the hydrae plugging and non-plugging properties of oils. J. Dispersion Sci. Technol. 2010, 31, 1100−1119.
(30) York, J. D.; Firoozabadi, A. Effect of brine on hydrate anti- agglomeration. Energy Fuels 2009, 23, 2937−2946.
(31) York, J. D.; Firoozabadi, A. Alcohol cosurfactants in hydrate antiagglomeration. J. Phys. Chem. B 2008, 112, 10455−10465.
(32) Salager, J. L.; Morgan, J.; Schechter, R. S.; Wade, W. H.;
Vasquez, E. Optimum formulation of surfactant-oil-water systems for minimum tension and phase behavior. SPEJ, Soc. Pet. Eng. J. 1979, 19, 107−115.
(33) Bourrel, M.; Salager, J. L.; Schechter, R. S.; Wade, W. H. A.
Correlation for phase behavior of nonionic surfactants. J. Colloid Interface Sci. 1980, 75, 451−461.
(34) Aman, Z. M.; Brown, E. P.; Sloan, E. D.; Sum, A. K.; Koh, C. A.
Interfacial mechanisms governing cyclopentane clathrate hydrate
adhesion/cohesion. Phys. Chem. Chem. Phys. 2011, 13, 19796−19806.
Using microscopic observations of cyclopentane hydrate crystal morphology and growth patterns to estimate the anti-agglomeration capacity of
surfactants
C. Dicharry, †*1 H. Delroisse, 2 J.-P. Torré, 3 and G. Barreto 2
1
CNRS/TOTAL/UNIV PAU & PAYS ADOUR/E2S UPPA, Laboratoire des Fluides Complexes et leurs Réservoirs‐IPRA, UMR5150 – avenue de l'Université, 64000 Pau, France
2
Arkema – Rue Henri Moissan, CS 42063, 69491 Pierre Bénite Cedex, France
3
Laboratoire de Génie Chimique, Université de Toulouse, CNRS, INPT, UPS, Toulouse, France
* Corresponding author: [email protected]
SUPPORTING INFORMATION Supporting Information A:
Video of individual crystals, newly-formed on the water/CP interface, which are attracted to the hydrate shell growing on the interface. The system contains 0.1 wt% of DA 50 (of the aqueous phase).
Supporting Information B:
Video of individual pyramidal crystals, newly-formed on the water/CP interface, which gather
into large clusters but do not stick to one other until the interface is crowded. The system
contains 0.1 wt% of DA 50 and 4 wt% NaCl (of the aqueous phase).
Supporting Information C:
Figure S1. Microscopic observation of CP-hydrate crystals formed at the water/oil interface
in the presence of the surfactant CES 80. The surfactant concentration is 0.1 wt% (of the aqueous phase).
Supporting Information D:
0 10 20 30 40 50 60 70
0 0.05 0.1 0.15 0.2 0.25
0 20 40 60 80 100 120 140 160 180 200
P (b ar )
C (N .m )
Time (min) Torque
Pressure
Stirring is stopped Stirring is restarted
Figure S2. Effect on the torque (C) of stopping and restarting stirring in a system containing a
surfactant evaluated as a “good” anti-agglomerant. Stirring was stopped for one hour. The
surfactant concentration is 1 wt% (of the aqueous phase).
Supporting Information E:
System Crystal Morpholgy AA Performance
CES 80
-2 0 2 4 6 8 10 12 14 16 18 20
0 0.05 0.1 0.15 0.2 0.25
0 20 40 60 80 100 120 140 160 180 200
T (°C)
C (N.m)
Time (min) Torque Temperature
CES Br
-2 0 2 4 6 8 10 12 14 16 18 20
0 0.05 0.1 0.15 0.2 0.25
0 20 40 60 80 100 120 140 160 180 200
T (°C)
C (N.m)
Time (min) Torque Temperature
TMDAHS
-2 0 2 4 6 8 10 12 14 16 18 20
0 0.05 0.1 0.15 0.2 0.25
0 20 40 60 80 100
T (°C)
C (N.m)
Time (min) Torque Temperature
TMDACl
-2 0 2 4 6 8 10 12 14 16 18 20
0 0.05 0.1 0.15 0.2 0.25
0 20 40 60 80 100 120 140 160 180 200
T (°C)
C (N.m)
Time (min) Torque Temperature