42-Volt PowerNet System Management
Using Multiplexed Remote Switching
by
James Russell Geraci
Submitted to the Department of Electrical Engineering and Computer Science
in partial fulfillment of the requirements for the degrees of
Master of Engineering
and
Bachelor of Science in Electrical Engineering
at the
MASSACHUSETTS INSTITUTE OF TECHNOLOGY
May 1999
L
cN
I
@
James Russell Geraci, MCMXCIX. All rights reserved.
The author hereby grants to MIT permission to reproduce and distribute publicly paper and electronic
copies of this thesis document in whole or in part, and to grant others the right to do so.
A .
Author.
Department of Electrical Engineering and Computer Science
May 21, 1999
Certified by
L
/
Certified by
Accepted
Dr. Tom Keim
Research Scientist
Thesis Supervisor
-'I
/L
hy
John G. Kassakian
Professor
Thesis Supervisor
Kj
Arthur C. Smith
42-Volt PowerNet System Management
Using Multiplexed Remote Switching
by
James Russell Geraci
Submitted to the Department of Electrical Engineering and Computer Science
on May 21, 1999, in partial fulfillment of the
requirements for the degrees of
Master of Engineering
and
Bachelor of Science in Electrical Engineering
Abstract
The main objective of this thesis is to explore techniques for using multiplexed remote switching
in a 42/14 volt dual voltage automotive environment to perform bus energy management and
other useful system functions. Achieving this objective involved first constructing a 42v/14v dual
voltage automotive test facility. Then, designing and evaluating candidate algorithms for bus energy
management in a dual-voltage electrical system using that test facility. The energy management
algorithms explored in this thesis were designed to minimize the cost and equipment needed to
implement the algorithms. This will allow future work to perform cost vs. performance gain
analysis.
Thesis Supervisor: Dr. Tom Keim
Title: Research Scientist
Thesis Supervisor: John G. Kassakian
Title: Professor
Acknowledgments
I would like to thank Professor John Kassakian and Dr. Tom Jahns for originally entrusting me
with this project. I would also like to thank Dr. Tom Keim for his insight and help with this
project. I would like to thank my parents and brothers and sisters for their support. I would also
like to thank Li Yu for her support and help with some of the most physically demanding parts of
the project. Finally, I would like to thank Ed Lovelace and Dan Santos for their work in obtaining
a drive motor for my project.
Contents
1 Introduction
10
1.0.1
Project Overview . . . .
10
2 Energy Management Algorithms
12
2.1
Present Energy Management System . . . .
12
2.2
42V/14V Energy Management System . . . .
13
2.2.1
Bus Voltage Regulation . . . .
14
2.2.2
Sophisticated Battery Model . . . .
14
2.2.3
Artificial Intelligence . . . .
17
2.2.4
Tested Energy Management Algorithms . . . .
18
2.2.4.1
42v/14v Bus Regulation Algorithm
. . . .
18
2.2.4.2
Sophisticated Battery Model Algorithm . . . .
19
3 MIT Breadboard Facility
21
3.1
Power Delivery Systems . . . .
21
3.1.1
The Breadboard Power Cabling . . . .
22
Contents
3.3.1
PC Master Control System . . . .
27
3.3.1.1
LabView File Input . . . .
28
3.3.1.2
CAN Bus I/O . . . .
30
3.3.1.3
Electromechanical Valve I/O . . . .
31
3.3.1.4
Alternator Speed Control I/O
. . . .
31
3.3.1.5
User Interface Related Activities . . . .
31
3.3.1.6
LabView File Output . . . .
32
3.3.2
The CAN bus and the C167CR . . . .
32
3.3.2.1
The CAN Bus . . . .
36
3.3.3
Load Nodes . . . 36
3.3.4
Energy Management Node . . . .
37
3.3.5
Serial to CAN Router Node . . . .
39
3.3.6
Data Collection Module . . . .
41
3.3.7
PC Input Files . . . 42
4 Test Procedure
46
4.1
Design an Energy Management Algorithm . . . .
46
4.1.1
Selecting a Drivecycles . . . .
46
4.1.2
Loadcycles
. . . .
47
4.2
Test Procedure . . . .
48
5 Results and Conclusion
49
A Complete Sophisticated Energy Management Algorithm
51
B.3 14V Bus CAN Node 2 ...
B.4 14V Bus CAN Node 3 ...
B.5 42V Bus CAN Node 1 ...
B.6 42V Bus CAN Node 2 ...
B.7 42V Bus CAN Node 3 ...
B.8 CAN Router ...
B.9 Data Acquisition Node ...
B.10 DC/DC Converter Node ...
B.11 Saber to Breadboard Converter Code .
B.12 Breadboard Loads ...
Contents
58
59
60
61
62
63
64
64
65
65
. . . .
. . . .
. . . .
. . . .
. . . .
. . . .
. . . .
. . . .
. . . .
. . . .
1.1
Dual Voltage Architecture with Communications Bus
Typical Voltage-time Discharge Curves of Lead Acid Cells
Battery State of Charge Partitioning used for this Thesis
Decision chart based on state of charge . . . .
Regulation Curve for DC/DC converter . . . .
40v alternator Current vs. RPM Characteristic . . . .
Diagram of MIT Breadboard Facility . . . .
40V Bosch Alternator Wiring Diagram . . . .
Digital Input of the MIT Breadboard DC/DC Converter .
Circuit Diagram of BTS660P Smart Switch Board
. .
. .
Circuit Diagram of BTS550P Smart Switch Board
. .
. .
A few lines from a breadboard input file . . . .
LabView 'G' code that parses breadboard input files
.
. .
. . . 13
. . . .
14
. . . .
16
. . . .
18
. . . .
19
. . . .
22
. . . .
23
. . . 25
. . . 27
. . . .
28
. . . .
28
. . . 30
3.8
C167CR Startup Code . . . .
3.9
Memory Map of Phytec KitCON-167 used in Breadboard Facility .
3.10 Assembly Code that allows External Memory Bus Accesses
. .
. .
3.11 Loop Code for C167CR . . . .
3.12 CAN Message Object Regsiters and Memory Locations
. . . .
3.13 Format of Serial Message
. . . .
34
34
35
35
37
40
List of Figures
10
2.1
2.2
2.3
2.4
2.5
3.1
3.2
3.3
3.4
3.5
3.6
3.7
List of Figures
3.16 The major communicating subsystems . . . 45
5.1
Battery Voltages vs Time . . . 49
A.1
Decisions made when 12v Battery is in the "Dangerous Overcharge" Region . . . . .
51
A.2 Decisions made when 12v Battery is in the "Acceptable Overcharge" Region . . . 52
A.3 Decisions made when 12v Battery is in the "Ideal Operation" Region . . . .
53
A.4 Decisions made when 12v Battery is in the "Acceptable Undercharge" Region
.
. . .
54
List of Tables
3.1
PacTorq Motor to SC756 Motor Driver Wiring Connections . . . 24
3.2
Fixed Resistance Breadboard Loads . . . 29
3.3
14v Bus CAN M essages . . . 38
3.4
42v Bus CAN M essages . . . 43
Chapter 1
Introduction
1.0.1
Project Overview
The objective of this thesis project was to explore techniques for using multiplexed remote
switch-ing in a dual-voltage system to perform bus energy management and other useful system functions.
"Multiplexed remote switching" is a term used to describe the ability of an in-car computer
net-work to control the state of various loads within the automobile. Such a system would require a
data network, several microcontrollers, and switches whose state can be controlled by the
micro-controllers. Because of the ever increasing amout of wiring in automobiles, the next generation
automobile electrical system will have such a remote switching network installed. Figure 1.1 shows
the main parts one possible topology for the next generation automotive electrical system. It is a
42/14 volt unidirectional DC/DC converter based automotive electrical system.
V Bus
La
Regulator
DC/DC
Load- Load CAN Comunications Node P71 Smart Switch
-Power Bus
!PC
There are three sources of electrical power in the system of Figure 1.1. The first is the alternator
and the others are the batteries. When the gasoline engine is running, it turns the alternator which
converts the mechanical power of the engine into the electrical power used to supply the electrical
system of the car. The batteries have different functions depending on if the car is running (key-on)
or not(key-off). When the car is running, the two batteries perform a load leveling function. They
provide power to their respective busses when the total demand for power on a bus exceeds the
amount that is being provided to that bus by the alternator. When the car is off, each battery
has a different function. The 42 volt battery's function is to start the car. The 14 volt battery's
function is to ensure that the key-off loads have power during the entire time the car is off. The
DC/DC converter acts as a regulated valve controlling power flow between the two busses.
If size, weight, and money were not an issue, the alternator should be sized so that it would be
able to provide enough power so that there would be no possible combination of loads which could
drain the batteries. Because of physical and economic limitations, however, such an alternator is
not obtainable. Furthermore, such an alternator might not be the most desirable alternative. Due
to the start and stop nature of automobile driving, there are times when the car batteries are being
drained and times when they are being charged. The important thing is that the change in state
of charge of each battery over the complete drive cycle is zero or positive. If it were possible to
intelligently control the flow of charge between the two batteries so that no net charge is lost by
either battery over a given drive cycle, it would be possible to size the alternator so that it would
not have to provide enough power to keep both batteries fully charged at all times. This method
of intelligently controlling the flow of energy throughout the automobile is called active energy
management. Such an energy management system would allow the use of a smaller alternator and
therefore reduce the weight and cost of the automobile.
It is highly likely that the next generation of automobile electrical system will include a
multi-plexed remote switching network. If it does include such a network, then the system will have the
necessary communications and control elements to perform not only the communications necessary
for an energy management algorithm to work but also to perform the computations necessary to
make intelligent decisions based on the state of the automobile's electrical system. It is the purpose
of this research to use a multiplexed remote switching network to investigate the performance of a
number of energy management algorithms.
Chapter 2
Energy Management Algorithms
Energy management involves the estimation of energy consumption, proper sizing of equipment
to meet this estimate, and proper operation of the equipment
[1].
Energy management algorithms
are a way to control the flow of energy throughout an automobile's electrical system. All energy
management algorithms take in information about the system's state in order to try to determine
the state of charge of the batteries. State of charge is a term often used to refer to the amount of
work that the battery can do given an instantaneous set of environmental parameters
1
. In addition,
each algorithm can be customized to not only take into account information about the state of the
system but also take into account safety information and preferences which might be of most benefit
to the vehicle operator. For example, in the case of the energy management algorithms developed
for this thesis, a strong preference was given to the operator being able to start his car. The system
then combines the physical information and the preference information and uses that information
to appropriately modify the state of the system's energy sources and sinks.
2.1
Present Energy Management System
Energy management algorithms are not new to the automobile industry. Today's automobile
employs a simple yet effective energy management algorithm. It uses a voltage sensor that has a
temperature compensated output voltage to measure the battery's voltage and uses this
informa-tion to control the excitainforma-tion of the alternator field winding, and thus the amount of power that
the alternator will deliver to the system. This energy management algorithm uses curve A from
Chapter 2
Energy Management Algorithms
4
6
7
Figure 2.1: Typical
I
ours
Voltage-time Discharge Curves of Lead Acid Cells
of the battery can be computed. By using this graph, a relationship between the voltage of the
battery and the battery's state of charge can be made. The present system of observing the bus
voltage and then modifying the alternator excitation accordingly is simply trying to use the voltage
information to make a guess at how much charge has been removed from the battery during a drive
cycle. This algorithm does not compute a number for the state of charge, but simply reacts to the
voltage which is an indicator of the state of charge of the battery.
2.2
42V/14V Energy Management System
The 42V/14V electrical system will also employ an energy management algorithm; however, the
fact that there are now two batteries makes the control of the system more complex and the possible
benefits of having a good energy management algorithm greater. This thesis three main levels of
sophistication for an energy management algorithm.
1. Bus Voltage Regulation
2.2.1
Bus Voltage Regulation
Bus voltage regulation is the 42V/14V extension of the present day energy management
al-gorithm. It employs a temperature compensated voltage sensor on the outputs of the DC/DC
converter and the 42V alternator to measure the voltage on each bus and then uses curve A in
Figure 2.1 to infer the state of charge of each battery. It has the advantage that it can be easily
implemented and can be expected to maintain battery charge for both batteries about as well as
today's highly satisfactory system.
2.2.2
Sophisticated Battery Model
The second level of sophistication employs a more sophisticated battery model than the bus
voltage regulation level. This level employs state of charge explicitly rather than implicitly through
bus voltage. By reasoning about battery state of charge directly, it becomes possible to make more
intelligent decisions about how to control the states of the energy sources and sinks on the network
and thus develop an energy management algorithm. One way to use state of charge information to
help develop an energy management algorithm is to first break each battery's state of charge into
a number of different regions and then make decisions based on which region each battery is in at
any given time. An example of how a battery's state of charge might be decomposed into different
regions is shown in Figure 2.2.
Regions of State of Charge
me-gion IRdngion 2
Naegion 3
3Da!nqg- rom =
Accept dSLe
Figure 2.2 shows the battery state of charge broken into 5 different regions. The exact place
in the state of charge continuum where each of the regions starts and stops have not yet been
standardized; however, for the purpose of this thesis, the following divisions were created:
" Region 1: Dangerous Overcharge
-+115% < SOC
" Region 2: Acceptable Overcharge
-+105% < SOC
<
115%
" Region 3: Ideal Operation
-+
90%
<
SOC
<
105%
" Region 4: Moderate Undercharge
-+
50%
<
SOC < 90%
" Region 5: Dire Undercharge
-+
SOC
<
50%
Figure 2.3 shows the 5x5 decision matrix which graphically displays the 25 different possible
regions into which the states of charge of both batteries may fall. The numbers on each edge
correspond to the state of charge regions in Figure 2.3.
A few examples of possible decisions based solely on the state of charge of the batteries are
written in the boxes in Figure 2.3. If both batteries are in a dangerous state of overcharge, then
the algorithm would turn off the DC/DC converter, decrease the alternator field winding excitation
(possibly turning it off), and turn on select high power loads on both the 42v bus and the 14v
bus. These actions would immediately cut off power flow into the 12v battery, so it would begin to
discharge. It would also allow the 36v battery to begin discharging as rapidly as possible. This kind
of situation would not occur in the voltage regulation energy management system unless something
had gone wrong with the voltage regulators, so actions taken during this mode of operation can be
seen as a sort of a safety device.
Another situation the system might get in is if both batteries are in a dire state of undercharge.
This situation might occur if, over a period of time, both batteries are drained and not returned
to a full state of charge after each drive cycle. In such a situation there might be the possibility of
recharging one of the batteries. This is where the engineer must make a decision as to what action
would best serve the customer. The system could either be designed to let the DC/DC converter
try to regulate the 14v bus and thus hopefully save the 12v battery, or it could be designed to shut
Energy Management Algorithms
Chapter 2
Chapter 2
Energy Management Algorithms
-1
C
H
2
-3
4
5
I.
3 5V
2
Battery
3
4
SOC
5
Figure 2.3: Decision chart based on state of charge
DCJDtC
DC/DC
DC/DC
OFF
OFF
CFE?
Alternator.
Down
Alternator
a
DC/DC
Down
Action
Down
Alternato r
DC/DC
DC/DC
Full an
Fu11 ON
Full
ON
CFP
rate of 6 amps, and the 12v battery were discharging at a rate of 5 amps, it might be possible to
control the DC/DC converter so that the 36v battery would charge at a rate of 3 amps and the
12v battery would charge at a rate of 4 amps.
The benefit of the sophisticated battery model energy management algorithm, over the simple
voltage regulation algorithm, is that the designer of the electrical system has more flexibility to
dictate how the system responds to different loading states. Because this algorithm can limit the
amount of current delivered by the DC/DC converter, it is possible to charge the 12v battery at a
rate that is less than the converter's maximum current delivery capability. With reduced output,
the current drawn from the 42V bus by the converter is reduced. This current can instead go
to the 36V battery thus reducing its rate of discharge and possibly even allowing it to charge.
Therefore, the situation could exist where both batteries are charging, albiet very slowly, instead of
in the voltage regulation case where only one battery is charging rapidly and the other is draining
because it is feeding the charging battery.
2.2.3
Artificial Intelligence
The decisions made by the energy management algorithm become the most helpful when the
system is aware of the physical environment around the car and can possibly learn the operator's
driving habits. Such a system might be aware of the date, the time of day, and the outside
temperature. It could be made aware of the weather forecast by having it automatically dial into
the weather service each night so it could adjust how it behaves for the following day. It could also
be plugged into a GPS system. If it then knew its starting point and its finish it could calculate
the amount of time that it would be driving and possibly the type of driving (in city or country)
that it would be doing. This information could have a significant impact on the way that energy
is managed in the system. Take again, for example, the situation where both batteries are in an
acceptable state of undercharge and the 12v battery is discharging and the 42v battery is charging.
If, the car knew that it was going to be doing a short drive and that the 12v battery wasn't
discharging too rapidly, it might choose to decrease the output of the DC/DC converter so that
the 12v battery drained a little more rapidly, but the 36v battery would charge more rapidly and
might possibly move into a region of ideal operation.
Energy Management Algorithms
Chapter 2
car sit over the weekend, the car would want to try to maximize the charge on the 12v battery by
increasing the output of the DC/DC converter so that it would be able to power all of its key-off
loads for the weekend.
2.2.4
Tested Energy Management Algorithms
For the purpose of this thesis both the 42v/14v bus regulation algorithm and a sophisticated
battery model algorithm were tested. Information about the load cycles, drive cycles, and physical
test facilities used to test these energy management algorithms can be found in Chapter 4. The
sophisticated battery model algorithm was limited to controlling only the state of the DC/DC
converter.
2.2.4.1
42v/14v Bus Regulation Algorithm
The 42v/14v bus regulation algorithm which was tested simply used the voltage regulators on
the DC/DC converter and the alternator to control the flow of power throughout the system.
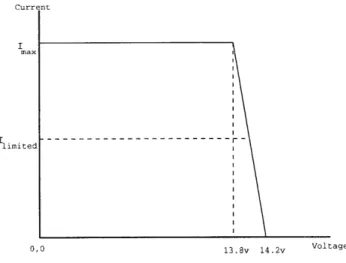
Figure 2.4 shows the regulation characteristic of the DC/DC converter. This curve means that the
DC/DC converter will try to deliver it's maximum current of 68 amps anytime the voltage on the
12v battery drops below 13.8 volts. Figure 2.5 shows the alternator's regulation characteristic. The
alternator is set to regulate its output to 40 volts, and it can deliver up to 90 amps in order to
maintain a 40 volt output voltage.
Current
Imax
Energy Management Algorithms
1044r
/
4.0
Iw
2MC
3COG 4OIW
afi
7600
*N9000 1
0000
11i1'a
Izab DoI4
I
Figure 2.5: 40v alternator Current vs. RPM Characteristic
2.2.4.2
Sophisticated Battery Model Algorithm
The sophisticated battery model algorithm which was designed was based on a coulomb counting
algorithm. The amount of current coming out of each of the batteries was measured about once
every second and its integral was computed. This value was then used to compute the percent state
of charge according to Formula 2.1.
State of Charge - (Initial Amp - hours)
-
(Amp - hours used)
(2.1)
(Initial Amp - hours)
Once the state of charge for each battery was calculated
2
, the system's present operating region
in Figure 2.3 was determined. From there, current information was used to make a final decision
about the state of the DC/DC converter. A complete enumeration of all possible decisions can be
found in Appendix A
Long-term inaccuracies in the discrete approximation of the total change in charge of a battery
will result in the true state of charge diverging over time from the state of charge calculated the
present test facilities data collection equipment. Even if it were possible to count every coulomb
entering and leaving the battery, the calculated state of charge and the true state of charge would
diverge due to internal self-discharge mechanisms. Over a long period of time, any control algorithm
that computes battery state of charge soley on equation 2.1 would need to be supplemented by
additional information sensitive to actual state of charge, for example, voltage and temperature.
For the purpose of this thesis, however, the rate of divergence between calculated and actual state
of charge should be slow enough to permit meaningful observations.
Chapter 3
MIT Breadboard Facility
In order to validate the energy management algorithms that were discussed in Chapter 2, it was
necessary to construct physical test facilities on which those tests should be conducted. The facility
that was to be constructed had to be an easily controllable and modifiable electrical equivalant of
the 42V/14V unidirectional DC/DC converter architecture from Figure 1.1. the facility can be
broken down 3 major parts.
1. Power Delivery Systems: Section 3.1
The Breadboard Power Cabling: Section 3.1.1
The Breadboard Batteries: Section 3.1.2
The Breadboard Alternator and Support Hardware: Section 3.1.3
The Breadboard DC/DC Converter: Section 3.1.4
2. Power Dissipating Systems: Section 3.2
Fixed Resistance Loads: Section 3.2.1
Speed Dependent Loads: Section 3.2.2
3. Control Systems: Section 3.3
PC Master Control System: Section 3.3.1
The C167CR: Section 3.3.2
The CAN Bus: Section 3.3.2.1
Data Collection System: Section 3.3.6
Software to generate PC input files: Section 3.3.7
and its support equipment, the DC/DC converter and the cables necessary to deliver power to the
loads.
3.1.1
The Breadboard Power Cabling
A diagram of the power cabling for the MIT breadboard facility can be seen in Figure 3.1.
42v Ground Bus 42v Power BusO Fuses D ta Collect 3 6v Battery 12v Battery DC/DC
Converter 14v Power Bus
Figure 3.1: Diagram of MIT Breadboard Facility
Each power and ground bus was implemented by an aluminum rail. The two power busses are
located on opposite sides of the breadboard facility. Leads from loads can be screwed to each of
the rails. There are two separate ground rails. These represent different local grounds that might
occur in an automobile. They are connected togther by a pair of 4 AWG cable. This pair of cable
performs the same function as that of a chasis in an automobile.
MIT Breadboard Facility
Chapter
3
an AC Delco Professional Freedom Car and Truck 65-7YR battery. It has a reserve capacity of 160
minutes.
3.1.3
The Breadboard Alternator
The alternator used to provide power to the network was a 40V Bosch alternator that was given
to the MIT Constorium for Advanced Automotive Electrical And Electronic Equipment by Paul
Nicastri of Ford. The alternator can supply 50 amps at idle and 90 amps at higher rpm. Thus the
alternator can supply a maximum of 2000 watts at idle and 3600 watts at higher rpm. Its output
current vs. rpm characteristic can be seen in Figure 2.5. The appropriate wiring diagram for the
alternator can be seen in Figure 3.2.
40V
40V
Loads
12V Battery
Figure 3.2: 40V Bosch Alternator Wiring Diagram
In a conventional automobile, the alternator is spun by the car's engine. It is geared at a ratio of
approximately 3 alternator rotations for every one engine rotation. The situation is the same with
the breadboard facility. The alternator was controlled by an 18hp 13.4kW Pacific Scientific PacTorq
MIT Breadboard Facility
Chapter
3
B+
St
D+
Alternator
Casing to
Ground
MIT Breadboard Facility
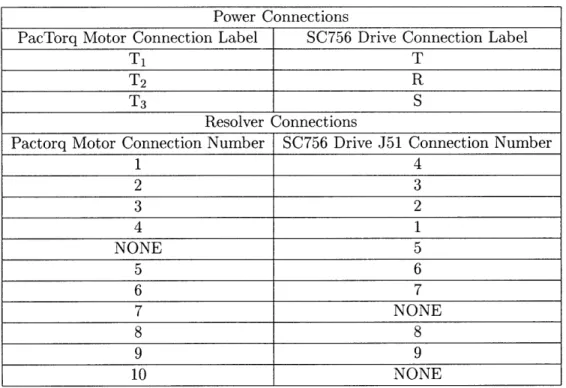
the PacTorq servomotor can be seen in Table 3.1. The controller is controlled through its serial
port, and for testing purposes , it is being software limited by its control program, 'PacTorq.bas'
2,
to spinning the PacTorq motor to 3500rpm. If this limit is exceeded, the motor stops all motion
and cannot move again until it is reprogrammed.
Power Connections
PacTorq Motor Connection Label
SC756 Drive Connection Label
T1
T
T2
R
T3
S
Resolver Connections
Pactorq Motor Connection Number
SC756 Drive J51 Connection Number
1
4
2
3
3
2
4
1
NONE
5
5
6
6
7
7
NONE
8
8
9
9
10
NONE
Table 3.1: PacTorq Motor to SC756 Motor Driver Wiring Connections
3.1.4
The Breadboard DC/DC Converter
The breadboard's DC/DC converter is a unidirectional converter that is capable of delivering up
to 68 amps to the 14v bus. It's regulation characteristic can be seen in Figure 2.4. The DC/DC
Chapter 3
Chapter 3
MIT Breadboard Facilitu
be controlled in any way to deliver more than 34 amps, but it can be controlled to deliver any
amount of current less than 34 amps.
The current limit of the DC/DC converter can be set by changing the value that appears on its
8-bit input seen in Figure 3.3.
Figure 3.3: Digital Input of the MIT Breadboard DC/DC Converter
Each input pin of the AD558 A/D converter has a pull up resistor. The pin can be brought to
logical low by first connecting an open drain configured transistor to the resistor and then activating
that transistor. The converter is at maximum current when all of the pins are high, and it is at
zero current when all the pins are low. Pin DBO on the AD558 is the LSB. The on/off state of the
converter is controlled by a separate pin. The converter will turn on when this pin is connected to
ground.
3.2
Power Dissipating Systems
By the year 2005 some automobiles will have an average electrical load of over 2500 watts [4].
MIT Breadboard Facility
watts. This is well above the maximum alternator output of 3600 watts at high alternator rpm.
Therefore, because the batteries must be used, an energy management algorithm is relevant.
In the case of the breadboard facility, loads can be broken down into two different categories. The
first type of load is a fixed resistance load, and the second type of load is a speed-dependent load.
For the MIT breadboard facility 11 different fixed resistance loads were selected and implemented
as CAN enabled smart switch controlled loads. The electromechanical valve system was the only
speed-dependent load enabled on the breadboard. It is discussed in Section 3.2.2.
3.2.1
Fixed Resistance Loads
The loads that were selected as fixed resistance loads are shown in Table 3.2.1.
The resistors
were held in aluminum mounts and power flow to the resistors was controlled by a microcontroller
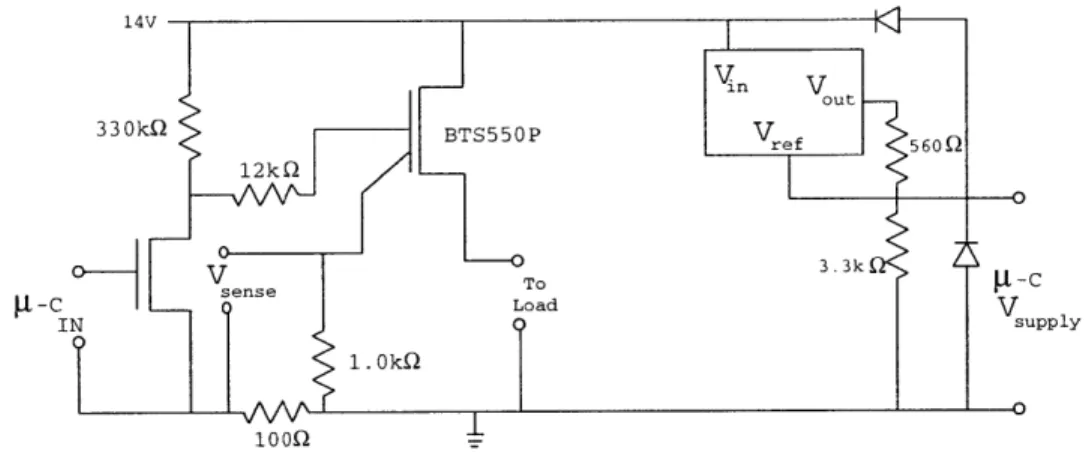
controller power MOSFET. The Siemen's BTS550P was used to switch on and off loads on the
14V bus, and the Siemen's BTS660P was used to control loads on the 40V bus. Each MOSFET
provides as an output on one of its pins a current that is proportional to the amount of current
flowing through its channel. The MOSFETs were mounted to custom designed boards. Also
mounted to each board was a LM317 voltage regulator that was used to provide power to the CAN
microcontroller that was controlling the state of the MOSFET via instructions it was receiving over
the CAN bus
3
A circuit diagram for the BTS660P's board can be seen in Figure 3.4, and a circuit
diagram for the BTS550P's board can be seen in Figure 3.5.
3.2.2
Speed Dependent Loads
The electromechanical valve system was the only speed-dependent load enabled on the
bread-board. It was implemented using a Hewlett Packard 6050A 180OWatt Programmable Load that was
configured to draw a current proportional to the speed of the alternator. The amount of current it
Chapter
3
Chapter 3
MIT Breadboard Facility
40V 13.7kQ
BTS660P
5.
4kQ-sense To -C Load IN1.
5kQ
100--V
out V ref u 5600 4.6k-psupply
Figure 3.4: Circuit Diagram of BTS660P Smart Switch Board
(3.1)
Idemanded =
Motorrpm - 6.425
3 5 0
3.3
Control Systems
3.3.1
PC Master Control System
Because the breadboard facility cannot be driven, a method of simulating driving had to be
created. This virtual driver was implemented using LabView 5.0. The virtual driver was coded in
LabView's multithreaded 'G' graphical programming language and run on a 200 MHz Pentium PC
running Windows95. Figure 3.15 shows the final PC interface for the facility. The virtual driver
had to be able to turn on and off fixed resistance loads, control the amount of current drawn by the
DC/DC converter, control the speed of the alternator, and collect information about the state of the
system. A subprogram was written to control each of these functions, and these subprograms were
combined toghter in the file "testcircuit2.vi." The major subprograms
4
are shown in Figure 3.16.
The current drawn by the DC/DC converter is controlled by 'EMValve.vi.'
The speed of the
alternator is controlled by 'PACSCIBYTE.vi', Information going to and received from the CAN
MIT Breadboard Facility
14V 330kQ BTS550P l2kQVTo
sense T C - (I Load IN 1.OkQ 1000-V
outV
ref 560O 3.3k Vsupply - 0Figure 3.5: Circuit Diagram of BTS550P Smart Switch Board
the CAN bus is the means of collection of information about the state of the system.
3.3.1.1
LabView File Input
The virtual driver itself is implemented in 'fileinputtest2.vi'. Fileinputtest2.vi reads in a specially
formatted file into a gian 2D array and then converts the information in the 2D array into
informa-tion that in the appropriate 'vi' can use to create electrical events on the breadboard facility. This
file is generated by a custom Java program that is described in Section 3.3.7. A few lines from one
of these files can be seen in Figure 3.3.1.1.
!54 ?822 ^42+14.0 #A003000005000000000000000000080A //
!55 ?1239 ^42+25.0 #AO030000090000000000000000000COA //
!56 ?1645 ^42+35.0 #A003000005000000000000000000080A //
!57 #AO030000090000000000000000000COA
//
Chapter 3
MIT Breadboard Facility
Breadboard Loads
14V Bus Loads
Load Name
Saber Name
Wattage
Current
Resistance
Power Door Locks
sdr-locks
88
6.0
2.4
Seat and Door Module
sdr-seat-adjust
13
1
15
Turn Lights
sdr-turn
111
7.9
1.8
ABS
sdr-abstc
324
23
0.6
Brake Loads
sdr-brakes
146
10.5
1.3
42V Bus Loads
Rear Seat Heater
sdr-rear-seatlhtrs
180
4.29
9.78
Air Pump
sdr-emissions
480
11.4
3.7
Heated Windshield
sdr-windshield
700
16.7
2.5
Table 3.2: Fixed Resistance Breadboard Loads
the following information is the time offset, in seconds, since the start of the test. It is written
to the global variable "Time Counter Global." The next token,
'?',
tells fileinputtest2.vi that this
information is the new speed, in rpm, of the PacSci Servomotor. Information following a
'?'
is
written to global variable "RUNSPEED." The alternator rotates at 3 times the value in this global
variable. The third token "42+" tells fileinputtest2.vi that this information is the new amount
of current to be demanded by the programmable load. It amount of current to be demanded is
written to global variable "E&M valve current demand." In this case the amount of current to be
demaded is 14 amps. The fourth token,
"#"
indicates that the following data is a CAN message.
It is written to global variable "CAN write buffer." The final token, "//"
tells fileinputtest2.vi that
this is the end of the line and that it should proceed to the start of the next line. It is important
to note that not all lines will have all tokens, and, therefore, the length of the lines in the input
file may vary. The line starting with "!57" only contains 3 tokens compared with the 5 of the line
starting with "!54".
This helps greatly reduce the size of the breadboard input file and this in
turn greatly improves the performance of the entire system because it allows better use of the host
PC's processing power. The LabView code that reads in the breadboard input file and parses it
can be seen in Figure 3.7. The code consists of two large while loops and several inner condition
statements. Every time through the inner loop consists of reading in and testing a token, i.e.
reading in a single column element from a row and sending the information in the column element
to the appropriate global variable. Execution of the outer loop corresponds to changing to a new
row.
.7
1nput
Load
CcleFile
all rows
Lii---~
.
:1.3 . itj1
Read
From
S
readsheet File. vi
0
0
~
I
ueuej
error in (no error)
Get Date/Time In Seconds
Output Array
Index Ara
S
it Strin
S
lit
Stun
wf~z~
S
lit Strin
secondtimer2
[ecn
vi
IT inm
--
-
-
-
-Li
Ar Ar t~Ar
"IN
WRiTE 6[
CAN
Stuing Indicator
-
s Q EGeI1nsert Q ueue E lement. vi1
50
S.
secondtimervi
Timer
Figure 3.7: LabView 'G' code that parses breadboard input files
3.3.1.2
CAN Bus I/O
MWOMaMMMOMM
mmamammMMmmemmaa
Chapter 3
its native VISA
5
support. It was decided then, that the PC would be connected to the CAN bus
through a serial router. Presently, this serial router only operates at 9600 baud; however, the serial
router can be operated at baud rates up to 625KBaud. The operation of the router is described in
Section 3.3.5.
3.3.1.3
Electromechanical Valve I/O
The electromechanical valve I/O subprogram was also implemented in VISA, and it's software is
almost identical to that of the CAN I/O subprogram except for the fact that it only transmits data
and never requests feedback from the programmable load. The programmable load has 3 different
600 Watt channels that can be controlled togther to give up to 1800 Watts. The electromechanical
valve I/O subprogram divides the demand between the three channels evenly. Each channel never
demands more than 15 amps individually.
3.3.1.4
Alternator Speed Control I/O
The alternator speed was controlled through communications port 1 (COM1) on the PC. It's
interface program was written using LabView's VISA modules so it should run on Windows NT as
well as Windows 95. It operates by sending a string through the serial port to the servocontroller
that was controlling the speed of the alternator. For example, if it was desired to have the alternator
spin at 900 rpm, then the string "00900" (plus a carriage return) was written to COM port 1. There
are always 2 leading zeros because LabView uses one and the servocontroller uses the second one
to create an interrupt to which it will respond. Therefore, the third value 9 is the first value read
in by the servocontroller. The string "00900" will cause the servomotor to spin at 900 rpm. This
means that the alternator is spinning at 2700 rpm.
3.3.1.5
User Interface Related Activities
The user interface is the lowest priority subprogram in LabView. Under heavy loading situations
LabView will often not update the interface right away. This can give the appearance of a delay
in the network; however, this is not the case. It is only LabView trying to make sure that all
I/O subprograms operate properly even at the expense of the user interface. This portion of the
MIT Breadboard Facility
program is also responsible for writing collected data to the hard disk. The data that is written is
battery voltage for each battery, time, and motor rpm.
3.3.1.6
LabView File Output
LabView takes bus voltage, alternator shaft speed and battery current information and writes it
to an output file. By default, the file is named "output.txt" and it located in the root directory of
the "d:" drive of the PC that was used. The output file is a tab delimited file. The columns in
the file represent time, alternator shaft speed, 42V bus voltage, 14V bus voltage, 42V bus current,
14V bus current, state of DC/DC converter.
3.3.2
The CAN bus and the C167CR
One of the features of the next generation of automobile electrical system may very well be some
type of multiplexed data network that will control the state of the loads. The breadboard facility
implements this feature in the form of a CAN network. CAN is a Bosch networking protocol which
was developed in the late 1980's for use in the automotive industry. CAN is an acronym which stands
for Controller Area Network. A complete discussion of the specifics of the CAN network protocol
can be found in the book "CAN System Engineering: From Theory to Practical Applications" [5].
CAN is a standard for transmitting messages, and the exact hardware implementation might vary
between vendors. For the purpose of this thesis it is important to understand the Siemens C167CR
microcontroller, and how Siemens implements the CAN protocol in this controller.
The C167CR microcontroller is a 16-bit microcontroller. The CPU is able to operate at clock
speeds of up to 20 MHz. One of the major applications for microcontrollers is data collection and
real time control of external systems. To better achieve this goal, there is an on chip peripheral
subsystem that operates independent of the CPU core. This peripheral subsystem is connected
1. Load Nodes
2. DC/DC Converter Controller Node
3. Energy Management Node
4. Serial to CAN Router Node
The software that controls each of these nodes is made up of a 'mainXYZ.asm'
6
object file that
is linked to several other object files that control one of the on chip peripherals. A full list of each
node and the software that makes up the node can be found in Appendix B.
The files are assembled togther using a DOS batch file entitled 'compXYZ.bat' where XYZ is a
unique alphanumeric identifier for each node. 'CompXYZ.bat' first assembles all of the necessary
assembly files. It then proceeds to link these files and locate them, and then turn the output of the
locater7 into an Intel hex formatted file. Intel hex is the file format required by the KitCON-167
board. All Intel hex formatted files end in '.hex'. These files can be downloaded to the KitCON-167
boards via the program 'Flasht.exe'. Download of an Intel hex formatted program to one of the
KitCON-167 boards is done by first connecting the KitCON-167 board to the COM1 port of the
PC. Then, 'flasht' must be typed and entered from a DOS command prompt in the directory that
contains the hex file that should be downloaded. The 'Flasht.exe' program will only work properly
if it is in the Windows95 path
8. 'Flasht.exe' does not work under Windows NT.
A microcontroller differs from a PC in that the microcontroller does not come with a
prepro-grammed boot ROM or BIOS. The information in the PC's BIOS tells the PC's microprocessor
how the microprocessor should communcate with the PC's memory and data busses. This code
must be provided by the user to the microcontroller. When the C167CR is first powered on, it
starts program execution from memory address
00'0000h.
In order for the user's program to
exe-cute properly, a branch instruction to the start of the program must be located at memory address
00'0000h. 3.3.2
6In
'mainXYZ.asm' the XYZ is a unique alphanumeric identifier. For example, 'mainl14.asm' is the main file for
the main assembly language file for CAN node 1 on the 14V bus.
7