HAL Id: hal-03107000
https://hal.archives-ouvertes.fr/hal-03107000
Submitted on 25 Jan 2021
HAL is a multi-disciplinary open access
archive for the deposit and dissemination of
sci-entific research documents, whether they are
pub-lished or not. The documents may come from
teaching and research institutions in France or
abroad, or from public or private research centers.
L’archive ouverte pluridisciplinaire HAL, est
destinée au dépôt et à la diffusion de documents
scientifiques de niveau recherche, publiés ou non,
émanant des établissements d’enseignement et de
recherche français ou étrangers, des laboratoires
publics ou privés.
The pH-dependent dissolution of wind-transported
Saharan dust
Karine Desboeufs, Rémi Losno, Françoise Vimeux, Sylvain Cholbi
To cite this version:
Karine Desboeufs, Rémi Losno, Françoise Vimeux, Sylvain Cholbi. The pH-dependent dissolution of
wind-transported Saharan dust. Journal of Geophysical Research: Atmospheres, American
Geophys-ical Union, 1999, 104 (D17), pp.21287-21299. �10.1029/1999JD900236�. �hal-03107000�
JOURNAL OF GEOPHYSICAL RESEARCH, VOL. 104, NO. D17, PAGES 21,287-21,299, SEPTEMBER 20, 1999
The pH-dependent dissolution of wind-transported
Saharan
dust
Karine V. Desboeufs,
R6mi Losno, Franqoise
Vimeux, and Sylvain Cholbi
Laboratoire Interuniversitaire des Syst•mes Atmosph6riques, Universit6s Paris 7 et 12, Cr6teil, France
Abstract. An open flow reactor was developed
and used to study the pH dependency
of
atmospheric
aerosol
weathering.
Under ultraclean
conditions,
this reactor
enables
experiments
below the saturation
of hydroxy salts and over the short time span (2 hours) that is typical for
weathering
by rain and cloud water. The weathering
simulations
show a two-step
process
of
dissolution
rates: First, the rate increases
quickly during the hydration
of the solid particle surface,
then after a maximum, it progressively decreases. In general, there is an increase in the dissolution rate of dissolved elements as the pH is lowered. However, between pH 3.80 and 5.30, the
dissolution
rate for Fe and Cu depends
on both H + and OH- concentrations
and exhibits
a minimum
as a function
of pH. This minimum
can be related
to pHpzc
of the mineral
containing
these
elements.
The affinity
of minerals
for H + was also
determined
by correlating
hydration
constants
and pH.
1. Introduction
Dissolved trace metals are an important key in understanding
atmospheric aqueous phase chemistry: For example, they probably control catalytic oxidation of SO2 producing acid precipitation [Hoffmann and Boyces, 1983; Graedel et al., 1985'
Berresheim and Jaeschke, 1986; Clarke and Radojevic, 1987]. Trace amounts of transition metals, for example, Fe, Mn, and Cu,
readily modify oxidation and reduction paths in droplets
[Graedel et al., 1986; Jacob et al., 1989; Faust and Hoignd, 1990, Walcek et al., 1997; Losno, 1999] because they control the concentration of free radicals. These metals are also involved in a
number of organic processes that occur in atmospheric droplets, that is, production and destruction of alkyl-hydroperoxides, and
chemical chains that link RO2 radicals to stable alcohols and
acids and oxidation of aliphatic aldehydes to form organic acids
[Wescrier et al., 1986].
On a global scale, desert aerosols are the main sources of trace
metals to the atmosphere [Lantzy and Mackenzie, 1979; Nriagu and Pacyna, 1988]. Prior to removal by wet or dry deposition
processes, aerosol particles are subjected to multiple cycles of wetting and drying during cloud condensation and evaporation [Junge, 1964]. They undergo partial weathering, which causes
the solubilization of elements t¾om minerals and metals. This
initial leaching process establishes the chemistry of the aqueous
solution that will define several subsequent atmospheric chemical
processes, for example, mineral dusts from crustal weathering can neutralize acidic precipitation [Khemani et al., 1987; Losno et
al., 1991]. This weathering process can modify the solid aerosol surface and so affect the optical and chemical properties [Lowe et
al., 1996; Herrmann and Hiinel, 1997].
Wet atmospheric deposition is a major source of trace metals
and nutrients to the oceans [Patterson and Settle, 1987; Duce et
al., 1991]. It has been suggested that Fe [Brand et al., 1983;
Martin and Fitzwater, 1988] and Mn [Sunda et al., 1981; De
Copyright 1999 by American Geophysical Union. Paper number 1999JD900236.
0148-0227/99/1999JD900236509.00
Baar et al., 1989] may act as limiting nutrients for phytoplankton growth. Free metals, rather than the total or chelated metal concentrations, control the biological availability [Anderson and Morel, 1982; Rich and Morel, 1990]. This input of trace metals to
the oceans may thus influence the global climate via stimulation
of dimethyl sulfide production by phytoplankton [Zhuang et al., 1992] or CO2 uptake [Smith and Mackenzie, 1991; Martin et al.,
1994].
Despite the obvious importance of solubilization of metals from dust in atmospheric waters, experimental works on this subject are scarce. Experiments simulating the timescales representative of those in cloud and rainwater showed a strong relationship between the dust mineralogy, pH of the solution and the solubility of transition metals for Saharan aerosol [Spokes et
al., 1994], and fhel ash and industry steel dust particles [Williams et al., 1988]. Several studies using natural or artificial rainwater
have suggested that the pH is a major factor controling solubility
in rain and snow [Mating and Duce, 1987; Prospero et al., 1987;
Losno et al., 1988; Statham and Chester, 1988; Colin et al., 1990; Lim and Jickells, 1990].
In this study, we used a flow-through reactor of the same type that was used previously to simulate terrestrial mineral weathering [Chou and Wollast, 1984; Mast and Drever, 1987;
Schnoor, 1990; Bruno et al., 1991]. This reactor enables us to
reproduce the rapid kinetic interactions between particulate and aqueous phases in atmospheric water. We discuss here the performance of this reactor when applied to the dissolution of mineral phases in part of conditions encountered in clouds where ionic strength remains low. Despite its importance for solubility history and bioavailability [Zhu et al., 1997; Spokes and Jickells, 1996], in this paper we will not consider evaporation of a cloud droplet when ionic strength becomes very high and pH is very low. During evaporation, cloud conditions can be compared to
the aerosol solution described by Zhu et al. [1992]. In our
experiments, we have determined simultaneously the pri- dependent dissolution of the elements: Na, Mg, Si, K, Ca, Mn, Fe, Cu, Sr, and Ba at timescales representative of evaporation- condensation cycles in atmospheric cloud droplets. Our objectives were to identify and quantify the individual steps of
mineral aerosols'weathering as they enter into a cloud. 21,287
21,288 DESBOEUFS ET AL.: THE pH-DEPENDENT DISSOLUTION OF SAHARAN DUST
2. Materials and Method
2.1. Method Used
The apparatus was designed to prevent equilibration of solid aerosol particles with insoluble salts. We used an open-flow reactor, wherein it was possible to maintain levels of dissolved species concentrations well below the saturation. The initial dissolution of the solids was exclusively studied without interference from secondary precipitation reactions. Evaluations
of the effects of various chemical conditions on the dissolution of
the introduced samples were possible by changing the composition of the input weathering solution.
2.2. Description of the Reactor
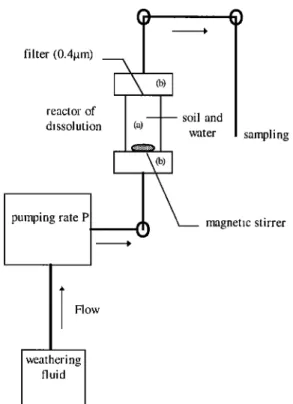
This reactor (Figure 1) was designed to work under ultraclean conditions. The dissolution chamber consists of a cylinder, a
perforated
stand,
and a 0.4 pm porosity
Nuclepore
TM
filter.
This
porosity defines what is soluble and what is not [e.g., Lim and Jickells, 1990]. The pump induces an upward circulation of the weathering solution. The solution containing the dissolved elements is collected at the outlet at regular intervals. A magnetic stirrer maintains a homogeneous suspension in the dissolution chamber. An experimental check of homogeneous mixing was performed.The dissolution rate is expressed as
dn dC
R =•7 = F(C,-CO
+ V'7•-
(1)
where
C solute concentration at time t inside the reactor
(mol L-l);
C, and C• concentrations of solute in the entering solution and
the outgoing
solution,
respectively
(mol
L-l);
filter (0.4[tm) reactor of dissolution pumping rate P
Flow
weathering fluid soil and water()
sampling magnetic stirrerFigure 1. Schematic of dissolution reactor that includes a main body of transparent polycarbonate (labeled a) surrounded by two
Teflon
TM pieces
(labeled
b). The lower
piece
holds
a perforated
Teflon
TM stand which carries
the particulate
sample
at the
beginning of the experiment. The upper piece houses a 0.4 pm
porosity Nuclepore
TM filter. All tubing and vanes are
manufactured from Teflon TM and connect the chamber to the pump and the sample area.
Table la. Percentage of Elements Present in the Loess Sample
Element Percentage Si 22.7* AI 8.4' Fe 7.6* Ca 3.8* Mg 2.8** K 1.3** Na 1.1' Ba 0.23* Mn 0.13** St' 0.032* Cu 0.007*
Mg, K, and Mn measured by both the methods are in good
agreement.
The value for Na has a large uncertainty.
*Values are determined by XRF.
*Values are determined by ICP-AES.
Table lb. Comparison of Elements at Normalized Element Ratio
Ca/AI Fe/AI Mn/A1 K/AI Na/AI Si/AI
X/A1 [Betgame**i, 1987] 0.50
X/AI (this study) 0.45
0.94 0.033 0.21 0.03 2.73 0.90 0.015 0.15 0.13 2.70
DESBOEUFS ET AL.: THE pH-DEPENDENT DISSOLUTION OF SAHARAN DUST 21,289
F R V dn
flow rate (L min-t)
'
rate
of reaction
in moles
per
time
unit
(mol
min-•);
volume of reactor (L);dissolved mole during dt period.
2.3. Particulate Phase
The < 20 lam diameter fraction of a dry segregated loess sample collected on the northeastern part of Sal Island (Capo
Verde Islands) was used as particulate phase. It is aeolian dust from Niger, deposited during the Holocene [Coudd-Gassen et al., 1994; Rognon et al., 1996]. We used loess, which can be
considered as an analog to aerosol, to ensure enough quantity of
the same material. This loess simulates atmospheric aerosols of a crustal origin, in particular of Saharan dust. It has the size
distribution of a natural crustal aerosol particle, ranging from 1 to
100 lam [Junge, 1979; Slinn, 1983; Coude•-Gaussen et al., 1987;
Betzer et al., 1988].
An elemental analysis of this loess sample by X ray
fluorescence and inductively coupled plasma atomic emission spectrometry (after acid digestion) is presented in Table 1. The aluminium normalized element ratios in the loess are close to those measured for Saharan dust aerosols [Bergametti, 1987] except for Na which is due to local enrichments.
X ray diffraction examination of the loess sample was carried
out on a Siemens D50 with a cobalt anticathode, covering a large
angular field for detection of clay minerals, other silicates, and
carbonates. The diffractogram indicates that this loess is made up of two parts: (1) a crystalline component of quartz plus sodic and
potassic feldspars and micas (muscovite) and augire and (2) an amorphous component containing the clay minerals (kaolinire) and possibly iron oxo-hydroxides. We interpret these data as a
weathering layer of amorphous silica with disordered clay
minerals on top of crystalline material feldspars, micas, and
probably augire [Pye, 1987]. Part of this amorphous layer was formed during postdeposition incipient meteorological alteration
[ Coudd-Gaussen et al., 1994].
2.4. Experimental Procedure
Experiments were conducted using 20 mg of loess that was weathered with about 4 L of fresh solution for about 2 hours.
This period is consistent with the lifetime of cloud droplets due to
reevaporation [Junge, 1964; Warneck, 1989]. The volume of the
Table 2. Element Detection Limits
Elements Detection Limits, ppb
Inductively Coupled Plasma Atomic Emission
Spectrometry Barium 0.5 Calcium 0.6 Iron 1 Magnesium 0.01 Potassium 0.5 Silicium 1 Sodium 0.3 Strontium 0.005
Atomic Absorption Spectrometry Copper 0.002
Iron 0.005
Manganese 0.004
Detection limits are defined as 3 times the standard deviation of at least 10 measurements near blank levels.
5 - y = 1.0132x + 0.2504
R2
= 0.9349
,,ø Y =x t I I I I I 2 3 4 5 Fe concentrations/AAS (ppb)Figure 2. Intercalibration of atomic absorption spectrometry (AAS) / inductively coupled plasma atomic emission spectrometry (ICP-AES) for Fe at a concentration greater than i ppb. This value is the lower limit for reasonably good ICP measurements for the conditions used in our experiments.
aqueous phase is very large in comparison with the small amount
of loess, which is consistent with the observed cloud conditions.
In order to determine the effect of pH on aerosol dissolution,
the weathering solution was prepared by dilution of a primary
solution of Milli-Q
TM water, exactly acidified at
[H+]= 1.00 10
-2 mol L -l. This raw solution
was made with
ultrapure Prolabo TM Normatom© hydrochloric acid and measured by a classical NaOH conductimetric titration. Input pH values of
3.80, 4.00, 4.30, 4.70, 5.00, and 5.30 were used for transition
metals (Cu, Fe, and Mn) and pH values of 4.00, 4.70, and 5.00 were used for Na, Mg, Si, K, Ca, Sr, and Ba. These values are similar to those in rainwater [Lim and Jickells, 1990] and cloud water [ROmer et al., 1985]• The flow of input and output solution
was
fixed
to 18 mL min
'•. The regularity
of the
flow was
checked
all along the experiments by measuring the volume of each sample because this parameter is a key parameter in calculations of the dissolution rate (F in (1)). Each sample took about 1 min and 30 s. The samplings were spaced by gaps ranging from 15 sat the beginning to 30 min at the end of the experiment. Sample
solution was collected in polyethylene or polypropylene bottles
that were carefully washed to remove species that could
contaminate the solution [Losno et al. 1991]. The collected
sample solutions were acidified at pH 1 with ultrapure Prolabo TM
Normatom© HNO3 to allow proper analyses. Four to seven blank samples were made for each experiment.
The concentrations of Na, Mg, Si, K, Ca, Fe, Sr, and Ba released into the solution were measured with a Perkin-Elmer Optima 3000 inductively coupled plasma atomic emission spectrometry (ICP-AES), and those of Mn, Fe, and Cu were
measured with an Unicam TGH Solaar 929 graphite furnace
atomic absorption spectrometry (GFAAS). The detection limits
are summarized in Table 2. Because the reported data may
include values obtained with both instruments, we ensured the correspondence of results between the two analytical methods.
Results given by both instruments were compared for iron which exhibited a wide overlapping analytical range. The result of this intercalibration shows good agreement within the analytical
instrument performance (Figure 2) and allows us to use one or the other of the analytical methods.
The experimental conditions enabled us to use very low
concentrations
of about
lag
L -• (ppb)
or less.
To avoid
extraneous
contamination and to ensure very low detection limits, all21,290 DESBOEUFS ET AL.' THE pH-DEPENDENT DISSOLUTION OF SAHARAN DUST 1.2E-08
• 1.0E-08
= 8.0E-09 .•. • 6.0E-09 •o 4.0E-09 • ' • , , • 2.0E-09 -- , 0.0E+00 ... •'-•-•--• 0 20 40 60 , 4E-09 , 3E-09 2E-09 1 E-09 0, 0 • ,,• 5 10 15 20.... m .... Experiment with lowest
concentrations 80 100 120
Time (min)
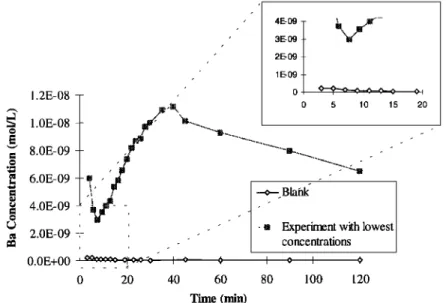
Figure 3. Dissolution concentration curves of the blank and nonblank experiments for Na and Ba.
dissolution experiments and analyses were conducted in a clean room (class < 1000) and with laminar-flow ultraclean benches (class < 10), using ultraclean trace metal protocols [Boutron et al., 1990; Losno et al., 1991]. The temperature in the clean room
was maintained between 20 ø and 22øC.
3. Experimental Conditions
3.1. Blanks
Two experiments were carried out without any particulate phase to demonstrate the absence of contamination during the experimental protocol. The results of these blanks were reproducible. In general, none of the investigated elements were detected except during the first 10 min of each experiment. During these first minutes, blank values were never below detection limit but remained negligible. The worst case was for Ba at pH 4.7 and 9 min and showing blank concentration less than 10% of experimental concentration (Figure3). This probably resulted from a late rinsing of the system which cannot
be changed without a much more extensive cleaning protocol;
this was not considered necessary based on the results shown in Figure 3. We believe that the measured values represent dissolution of the loess sample and that they are free of
contamination.
3.2. Ionic Composition of Medium
The weathering solution initially contained water and acid.
During the experiment other ions are released by particle dissolution, especially Na +. The pH of the weathering solution
was checked with a pH meter (0.02 units sensitivity) before the experiment, after 30 min, and again at the finish of each experiment. The pH did not vary between entry and exit of the reactor and matched the anticipated pH values after dilution of
the raw solution. We compared the H + concentrations with
respect to the concentrations of other major cations as a function of time during the experiments (Table 3). The results show that
H + is not the major ion after 1 min, but it becomes dominant at 30 min.
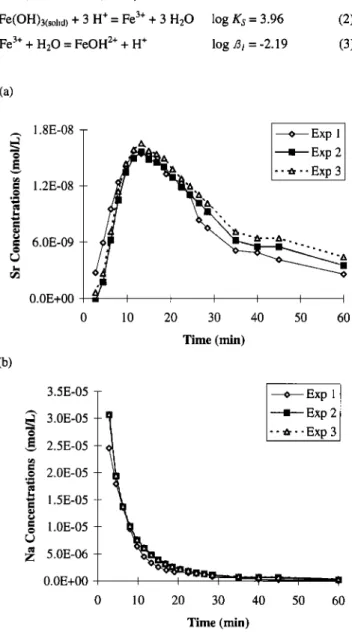
3.3. Reproducibility
Some fraction of the loess adhered to the top filter during the experiment. Several experiments were carried out to test this issue. The filter was removed from the system, dried, and weighed after 7, 15, and 30 min. The filter caught 10 to 30% of loess (Table 4). Three replicate experiments were carried out, and
the maximum difference between concentrations found in the
outgoing solution was -- 5% for the first 30 min and -- 15% at the end of the experiments (Figures 4a and 4b). In this last case, the concentrations were close to the detection limits and were prone to greater analytical errors. From these results, we deduced that the amounts of captured loess on the filter did not significantly
affect the measured dissolution rates.
3.4. Dissolution Equilibrium
For the elements studied here, the solubility product was never
reached
with the possible
exception
being
Fe
Ill with respect
to
crystalline oxo hydroxy salts. Faust and Hoignd [1990] and Flynn [1984] showed that the very insoluble crystalline forms ofTable 3. Percentages of Major Ions Composition of Solution at pH 4.00 and 5.00
pH Time Elapsed During Experiment H +, % Na +, % K +, %
4.00 5.00 Ca 2+, % 3 min 24.1 69.4 4.70 0.70 30 min 68.7 7.30 5.00 12.6 45 min 74.8 6.90 4.50 9.40 I min 50.0 43.2 5.50 0.90 30 min 96.7 0.40 0.50 1.30 90 min 99.6 0.03 0.04 0.30
DESBOEUFS ET AL.: THE pH-DEPENDENT DISSOLUTION OF SAHARAN DUST 21,291
Table 4. Amount of Loess Captured on the Filter at Three Different Manipulation Times
Amount at 7 Min, mg Amount at 15 Min, mg Amount at 30 Min, mg
Experiment I 3.5 3.6 5.6 Experiment 2 7.0 7.0 6.9 Experiment 3 2.7 3.1 4.2 Experiment 4 6.1 6.1 3.1 Median 4.80 (24.00%) 4.85 (24.25%) 4.90 (24.50%) Standard deviation 2.05 (10.2%) 2.12 (10.6%) 1.65 (8.25%)
The initial quantity in each experiment was 20 mg.
Fe
nI salts
(especially
FeOOH,
Goethite)
are dissolved
or formed
too slowly. These salts do not affect our experiments that were completed after 120 min. Faust and Hoignd [1990] and Flynn [1984] also showed that amorphous hydroxides can interfere with equilibrium conditions. Thus, to prove that our cell operated wellbelow the saturation limit, we made several calculations to
evaluate the more probable amorphous form, that is, Fe(OH)3 (ferrihydrite).
The relevant equilibria at 25øC are (Stumm and Morgan, 1996; Turner et al., 1981):
Fe(OH)3(solid)
+ 3 H+= Fe
3+
+ 3 H20 log
Ks
= 3.96
(2)
Fe
3+
+ H20 = FeOH
2+
+ H +
log 13•
= -2.19
(3)
(a) (b) 1.8E-08 a 1.2E-08 a 6.0E-09 - • Exp l•
-- Exp
2
O.OE+00
• I
I
I
I
I
0 10 20 30 40 50 60 Time (min) 3.5E-05 - • Exp 1• 3.0E-05
Exp
2
'• -- ,•-- Exp,• 2.5E-05
....
g 2.0E-05 - -• 1.5E-05 - g .0E-0S - Z 5.0E-06 - 0.0E+00 i 0 10 20 30 40 50 60 Time (rain)Figure 4. Example of reproducibility of three experiments carried out in the same conditions but at different days for (a) Sr, and (b)
Na.
Fe
3+
+ 2H20 = Fe(OH)2
+ + 2H +
log ./32 =-5.67 (4)Fe
3+
+ 3H20 = Fe(OH)3ø
+ 3H +
log f• = - 12.0 (5)Fe
3+
+ 4H20 = Fe(OH)4-
+ 4H +
log •4 -' -21.6 (6)Fe
3+
+ CI-= FeC12+
log/3ct
= 1.48
The chloride complex is negligible Bci[C1-]<I thus
[Fetot]
= [Fe 3+] + [FeOH
2+] + [Fe(OH)2
+] + [Fe(OH)3]
+ [Fe(OH)4-](7)
[Fetod
= [Fe z+] (1 +/3• [H+]
-• + f•2 IS+] -2 + f•3
[S+] -3
+ f•4 [H+] -4)
and
[Fe•+]max
= Ks [H+] •
log
[Fetot],,ax
= log
Ks + log (10
-3pn
+ 10
+ 10 •og•3
+ 10 log•4+pn)
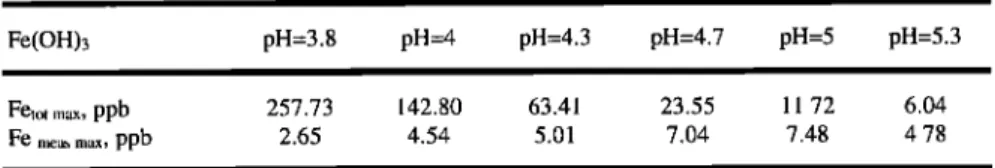
Table 5 gives [Fe tot]max for the pH values of interest to our study.
Note that in the range
of the studied
pH (3.80-5.30),
Fe
III is
always undersaturated with respect to solid Fe(OH)3. This resultsuggests
that Fe
TM
concentrations
in our experiments
were
not
affected by salt formation.4. Results and Discussion
4.1. Dissolution Rate
When plotting reaction rate versus time, two types of curves
were obtained, that is, a bell-shaped curve for Mg, K, Ca, Mn, Sr and Ba (Figure 5a) or an experimental decrease in the dissolution rate to relatively low values for Na, Si, Fe, and Cu (Figure 5b).
Although the results from long-term dissolution studies are not
specifically relevant to aerosol dissolution, these studies also showed similar initially high dissolution rates, such as a parabolic rate law in the case of batch reactor experiments [Wollast, 1967; Luc½ et al., 1972; Lagache, 1976; Holdren and Berner, 1979; Schott et al., 1981; Holdren and Speyer, 1985; Tole et al., 1986; Carroll-Webb and Walther, 1988]. In order to explain the parabolic dissolution kinetics, two different mechanisms have been proposed. First, it was assumed that the rate of weathering was controlled by a surface layer through which the reactants and reaction products diffused [Wollast, 1967; Luce et al., 1972;
Paces, 1973; Chou and Wollast, 1984; Wollast and Chou, 1985;
Holdren and Speyer, 1985]. Second, surface controlled dissolution of fine-grained material, high-strain areas on large grains, defects and grain boundary diffusion [Holdren and
21,292 DESBOEUFS ET AL.' THE pH-DEPENDENT DISSOLUTION OF SAHARAN DUST
Table 5. [Fe
III tot]
in Equilibrium
With Ferrihydrite
Fe(OH)3
at Different
pH Values
Fe(OH)3 pH=3.8 pH=4 pH=4.3 pH=4.7 pH=5 pH=5.3
Fetot ... ppb 257.73 142.80 63.41 23.55 11.72 6.04
Fe me,.• m,,x, ppb 2.65 4.54 5.01 7.04 7.48 4.78
Log Ks = 3.96 [Stumm and Morgan, 1996].
Berner, 1979; Schott et al., 1981; Petrovich, 1981, Helgeson et al., 1984; Lasaga, 1984] were assumed.
To explain the bellshape of our curves, we applied the surface complex-controlled dissolution approach by Stumm and Furrer [1987], Stumm and Wollast [1990], and Stumm and Morgan [1996]. The surface of hydrous oxides and hydrated silicates contains hydroxyl surface groups that are able to coordinate with
H + and OH-, that is, surface protonation and deprotonation.
Surface protonation polarizes, weakens, and tends to break the critical metal-oxygen lattice bonds enabling the detachment of
central metal cations that enter the solution. Dissolution reactions
may start as an attack by protons of the mineral surface preferentially at points of excess surface energy. A simple scheme
of the proton adsorption can be proposed to explain the increased
rates'
k'n = [H+]" ku
[S-X] +nH + --> [SHn-X] (8)
[SH,-X]
-->
Saqueou
s +nH + + X
(9)
the dissolution rate during the first phase of dissolution, when the rates increase can be written as
R = k•[SH,,-X] (a) 8.0E-08 -- (b)
•
6.0E-08
-
.=, 4.0E-08 - • 2.0E-08 - O.OE+00 --- Ca -->•- Mg•
...
* ...
Ba
ß , Mn 1.2E-09 1.0E-09 8.0E-10 -- 6.0E-10 4.0E-10 2.0E-10 0.0E+00 0 20 40 60 80 100 120 Time (min) 3.0E-07 -- 2.5E-09•
--•--
Na --
2.0E-09
-x- Fe •Z
-- 1.5E-09 •
.•
1.5E-07
•'
• 1.0E-09 ••
1.0E-07
•
• 5.0E-10 '• • 5.0E-08 x • _O.OE+00
--- •-,--- --,•--
- • ---•- •-=-•
O.OE+00
2.5E-07 2.0E-07 0 20 40 60 80 100 120 Time (min)Figure 5. Shapes of dissolution rate curves for the elements: (a) bell shaped dissolution curves at pH 4.7, showing initially strong increasing dissolution rates followed by a gradual decrease, and (b) monotonically decreasing
DESBOEUFS
ET AL.' THE pH-DEPENDENT
DISSOLUTION
OF SAHARAN
DUST
21,293
,•!l!qnlos %
•,
,(•!llqnlos
%
,•l!l!qnlos %
•
,(•q•qnlos %
• xXl!l!qnlos %
X•q•qnlos %21,294
DESBOEUFS
ET AL.: THE pH-DEPENDENT
DISSOLUTION
OF SAHARAN DUST
Assuming a first order law for [S-X] in reaction (8) d[SH•-X] / dt = k'n ( [S-X]o-[SH.-XIt)
where
R =k•[S-X]o(
1-
e
-k;t)
( 1
O)
R
the dissolution
rate
(mol
cm
-2
min'l);
kL
the rate
constant
of X release
(min-l);
[S-X]()
number
of the free surface
sites
for t = 0 (mol
cm-2);
kH and k; the rate constant and the apparent rate constant of surface protonation, respectively.
In this scheme, increasing dissolution rates at the front of the
bell-shaped curve are caused by the exchange of H + at the
surface.
H + is not always
the major
cation
in the solution
(Table
3), and a contribution
of Na + to ion exchange
cannot
be excluded.
During the initial phase, fast surface protonation is followed by
the slow and rate-determining release of element from mineral.
The dissolution of amorphous rather than crystalline minerals probably dominates the earliest dissolution. After this first stage,
either
of the two previously
mentioned
hypotheses
might
explain
the decrease in dissolution rates because the hydrated layer thickens or the surface reactivity is reduced by the complete
dissolution of fine grains.
As both bell-shaped and monotonically decreasing curves are obtained, it appears that some elements are more prone to go into
solution than others. The monotonic curves for Na, Si, Fe, and
Cu could be interpreted as bell-shaped but with k'H too high for observation. Copper and iron are mostly in amorphous fraction of
loess and should be highly reactive. Silicon comes from the mineral lattice or from amorphous SiO2 at the surface. Sodium
may be released swiftly because of rapid exchange of protons at feldspar surfaces and by dissolution of halite crystals.
The relative rate of release of the elements can be expressed as
the percentage of the accumulated dissolved mass at the end of
each experiment. The observed sequence of increasing solubility becomes Si < Fe < Ba <Mn < Mg < Ca < Sr < K < Na (Figure 6). This relative order was also obtained by Hoffinann et al. [1997]
for the same elements, and for Fe and Mn [Spokes et al., 1994], in other dissolution experiments. Alkaline and alkaline-earth ions
(Na, K, Mg, and Ca) inserted in the lattice dissolve more rapidly
than other metals. Silicon, being the primary network constituent, is the least soluble. For all elements except Fe and Cu (Figure 6b,
6c, 6e, 6f, 6h, 6i), releases into the solution increase when pH
decreases (Figure 6a-6i). This is in agreement with our proposed
hydration mechanism. It also partially explains the different
levels found in rainwater, which Spokes et al. [ 1994] pointed out.
The elements have different hydration reactivity as shown by
the shift of maxima of bell shaped dissolution curves as a function of time. Fe and Si are released slower than the other elements. They exhibit monotonic dissolution behavior, suggesting that the hydration process is very fast and is well- advanced before we collected the first sample. This behavior supports the hypothesis that Fe and Si are dissolved from an amorphous phase. For Fe, this is in good agreement with the presumed nonreactivity of crystalline oxo-hydrated salts. 4.2. The pH Influence
Na, Mg, Si, K, Ca, Mn, Sr, and Ba dissolution and hydration rates generally increase with decreasing pH. Moreover, the shapes of the dissolution curves become monotonic at pH 4.00 for all elements (as shown for Ca in Figure 7). This is in good agreement with the increase of the protonation step expressed in (8) and (10): at pH 4.00, the protonation rate is too fast to be
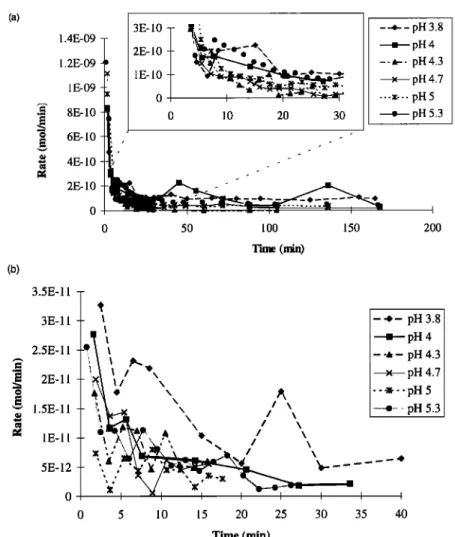
observed and occurs before the first sample collection. The Fe
and Cu curves have similar shape and do not exhibit large variations in the range of pH studied (Figure 8a and 8b; see
below).
The pH dependency of dissolution can be explained by the
approach outlined above, as the apparent rate constant decreases
with decreasing pH. The value of k'H was calculated for pH 4.70 and 5.00 in the step of increasing dissolution rate for the experiments that produced the bell-shaped curves, assuming
constant kL:
dR
= -kL
[S-X]o
k;e -k'•t
dt
In
(-•-t
R)
=ln(k•[S-X]ok•)-k•t
The
plot
of
In
IS3)=
f(t)
is
used
to
calculate
k'l_i,
the
slope
of
the linear
regression
(Table
6) at two different
pHs.
The exponent
n is then calculated as
n = log [(k'Hl
/ k'H2
) / (PH2-pH•)]
Between pH 4.70 and 5.00, k'H decreases, and n is positive (Table 6). It is interesting to note that the pH dependency of the rate constants follows, at least qualitatively, the pH dependency of mineral solubility. Thus n values in the range [0.3 - 2.81] are
found
to decrease
for elements
in the same
column
of the periodic
table, that is. Mg to Sr (see Table 6). The results emphasize that the affinity of a mineral to form complexes with H + varies according to the elements that compose this mineral. The elements with the highest percentages of release have the lowest values of n, and they require the exchange of less H + to be leached (Ca < Mg < Mn). However, keeping in mind that only two points were used to calculate n, the values in Table 6 are only
approximations.
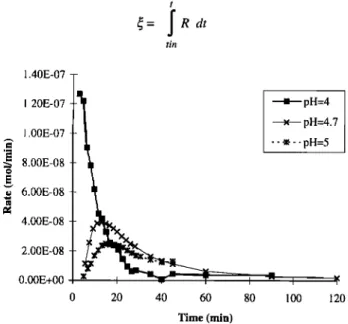
Figure 7 shows that the dissolved rate for calcium is much
faster at the beginning for pH 4.00 than at higher pH. Yet the
curve for pH 4.00 crosses the high pH curves after 10 to 20 min
and then becomes lower. To point out the effects of varying pH values on dissolution rates, a more useful parameter for comparison will be the reaction progress • defined as
t
•= JRdt
tin 1.40E-07 1.20E-07 1.00E-078.00E-08
• 6.00E-08 4.00E-08 2.00E-08 O.00E+00fl
-' pH=4
x pH=4.7
0 20 40 60 80 100 120 Time (min)Figure 7. Examples of the effect of pH on Ca dissolution curves. Evolution of bell shaped curve toward monotone curve as pH decreases.
DESBOEUFS
ET AL.' THE pH-DEPENDENT
DISSOLUTION
OF SAHARAN
DUST
21,295
(a) 1.4E-09 1.2E-09 IE-09 .-• BE-10 6E-10 • 4E-10 2E-10 3E-10 ' 2E-10 1E-10 0 i i i -- i 0 10 20 30 --*-- pH 3.8 = pH4 --a-- pH4.3 x pH 4.7 ---•--- pH5 -- pH 5.3 (b) 0 50 100 150 Time (min) 2OO 2.5E-11 -•
2E-11
-
• 1.5E-I
1 -
• IE-11 -3.5E-11
3E-11I •
[\ ..
\\
/ \
, ...
%'.',:", -,, ,,
0
x I
• I
•1
I ....
ß
...
e.,•
...
I
I
0 5 10 15 20 25 30 35 Time (rain) - -,- pH 3.8 = pH 4 --&- pH 4.3 x pH 4.7 ---•--pH 5 ... ß ... pH 5.3Figure 8. Effect of pH on the shape of the dissolution curve for (a) Fe and (b) Cu. The influence of pH is less
obvious than for the others elements.
Using equation (1) for R,
t t t
dt J dt
tin tin tin
t
•=
F I C(t)dt
+ V[C(t)-C(ti.]
tinThus the total amount of dissolution of particulate phase can be
calculated for different times:
R= C(•) F + V AC/At
We express the percentage of x dissolved as
(x)di,,.,,,o/wd
%
=
0.020 Pc(x)• Mx
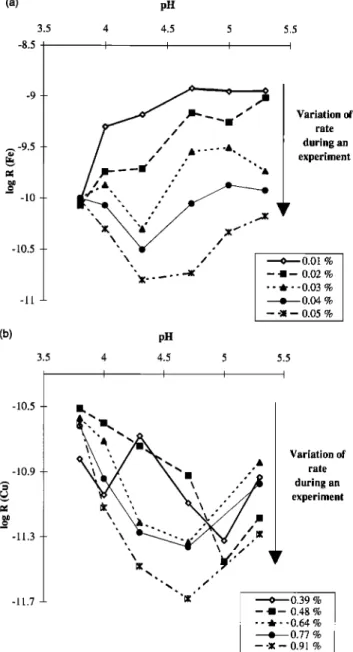
(Figure 9a). Note that later fractions reach a minimum rate at pH 4.3, suggesting that two different dissolution mechanisms operate over longer periods of time; at pH > 4.3 and at pH < 4.3. The
same behavior can be inferred for Cu with a rate minimum
between pH 4.5 and 5 (Fig. 9b). These observations suggest that Cu and Fe are released by different mechanisms at the beginning and at the end of the experiment. This probably reflects two different mineralogical forms of Cu and Fe in the loess sample. The first form that was regularly influenced by pH changes is
probably
an amorphous
phase
which seems
to be completely
removed after several minutes of dissolution.
The dissolution rate law can be obtained by adding both
mechanisms:
Table 6. Calculation
of the k'• Hydration
Constant
(min
-•) of
Mineral Surface Sites and n Valueswhere pH Ba Ca Mg Mn Sr
• reaction progress in moles;
Mx atomic
mass
of element
x (g mol-•);
0.020 amount of loess introduced in the reactor (g); Pc(x) percentage of x in the loess (Table 1).Fe and Cu dissolution are cast in this form and shown in
Figure 9. Early Fe dissolution increases uniformly with pH
k'/-/ 4.7 0.2667 0.0650 0.1068 1.2269 0.1298
5 0.1011 0.0446 0.0631 0.1752 0.1051 n 1.4 0.55 0.75 2.81 0.3
The n value is the parameter of affinity of these sites with protons obtained from the In (dv/dt) = fit) plots.
21,296 DESBOEUFS ET AL.' THE pH-DEPENDENT DISSOLUTION OF SAHARAN DUST (a) -8.5 -10.5 -11 (b) -10.5 -10.9 -11.3 -11.7 3.5 3.5 pH 4.5 I 5 5.5 I I Variation of rate during an experiment •0.01% --I-- 0.02% -- • - -0.03 % • 0.04 % -- -• -- 0.05 % pH 4 4.5 5 I I I 5.5 I Variation of rate during an experiment •0.39 % -- ß-- 0.48 % - - •- -0.64 % g 0.77 % -- -•-- 0.91%
Figure 9. Evolution of release rate as a function of pH for
different
dissolved
fractions
and calculations
of pHpz•
tbr (a) Cu
and (b) Fe.R = kill +]" + k 7H +]-•
log R = log (kill+] '• + k'[H+]
'/•)
(11)
with two different situations.
1. If k[H+]
a << k'[H+]-b;
log R = log
k' + b pH. This
equation
represents the part of the line with positive slope. As the H+/OH -
equilibrium
is always
very fast, we obtain
k'[H+]-b=
k' Kw
-b
[OH-]
b to emphasize
reaction
control
by OH's (Kw is the
equilibrium constant of water ionic dissociation).
2. If k[H+]
a >> k'[H+]-b;
log R = log k - a pH. This
equation
represents the part of the line where the slope is negative. The
reaction is controlled by protons.
The best fit with rate laws and the rate coefficients are given in Table7. Similar compound rate laws describing mineral dissolution have been summarized by Stumm and Morgan [1996]
who introduced
the zSta
pH of a mineral
(pHpzc).
Typically,
the
proton-controlled mechanism dominates dissolution at
pH < pHpzc, and hydroxyl-controlled dissolution dominates the
overall
dissolution
at pH > pHpz•.
A similar
pH-dependence
law
was also reported by Brady and Walther [1989], who considered
the detachment rates of the silicate oxide components through
surface
protonation-deprotonation
reactions.
The pHpzc
estimated
from our rate measurements ranges between pH 4.2 and 4.7 for
Fe and between pH 4.6 and 5.1 for Cu. The point of zero charge
of the mineral depends on the pH, the concentrations of all ions, the degree of hydration, and the degree of crystallinity of the dissolving solids [Stumm and Morgan, 1996]. The differences
found for pHpzc
are probably
explained
by different
hydrated
oxides and minerals that contain the studied elements.
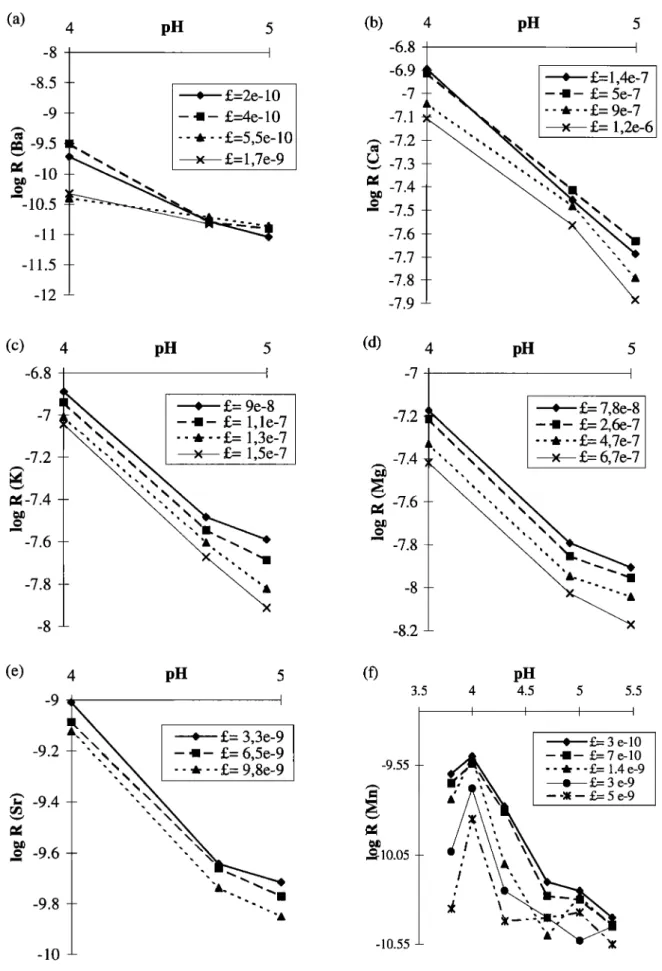
For the other elements, rates decrease with increasing pH, and no hydroxyl-controlled dissolution is observed (Figures 10a-10e),
suggesting
that the pHpzc
point for these
elements
is greater
than
5.30. Rate coefficients for these elements are shown in Table 8. The behavior of Mn is somewhat of an exception with a break of slope at pH 4 (see Fig. 10 f) that was also observed by Statham and Chester [1988]. The composite rate law cannot be applied because the point at pH 4 corresponds to a maximum.
5. Conclusion
An open flow reactor was used to study the aerosol dissolution in atmospheric waters. The simultaneous measurements of the elements Na, Mg, Si, K, Ca, Mn, Fe, Cu, St, and Ba allowed us to model the mechanistic steps involved in the weathering of Saharan derived dust aerosol weathering. Our primary
observations are as follows:
1. Aqueous dissolution is a two-stage process. The first step
consists of an attack by H + or OH- of an amorphous and a
crystalline phase. We have quantified this protonation by measuring hydration constants k'u, which characterize the fixation of protons on surface sites. This allowed us to model the interactions between the particulate and the aqueous phases at the onset of cloud droplet condensation.
2. We have measured the release variations of these elements as a function of pH ranging from 3.80 to 5.30 and found that Fe appears to be the least soluble element after Si, which is in good agreement with the previously observed trends [see Spokes et al.,
1994].
3. The pH has a critical role in the dissolution of elements. Typically, a decrease in pH will accelerate dissolution. For the transition metals Fe and Cu, a compound rate law operates: protons control the dissolution at acid pH, and hydroxyls control the dissolution at less acid pH. The operation of a compound rate law points to the necessity to cover a large interval of pH values and does not allow the extrapolation from experimental results obtained at lower pH values.
Table 7. Values of Kinetic Parameters of Copper and Iron Dissolution as a Function of pH Values at Different Solubility Percentages
Solubility, % a log k b log k'
Ctt 0.64 0.90 -8.45 0.80 -16.46 0.77 0.81 -8.96 0.65 -15.71 0.91 1.14 -7.73 0.67 -16.11 Fe 0.03 1.43 -5.44 1.91 - 19.77 0.04 1.03 -7.32 0.62 -14.30 0.05 1.55 -5.42 0.69 -15.10
DESBOEUFS
ET AL.' THE pH-DEPENDENT
DISSOLUTION
OF SAHARAN
DUST
21,297
(a)
4
pH
5
-8 I-8.5
ß œ=2e-
•0
• -9 -]-
- • - œ=4e-
10
•
•
-- ,•-- œ=5,5e-
10
•-9.5
••
x œ=1,7e-9
• 10.5
-- -11-11.5
-12•
(c)
4
pit
5
*
œ=9e-8
-7 •,, x.•,
/ ß
1,1e-7
œ=I '44,x •
/ "'•"
1,3e-7
-7.2
_
œ=
__-7
-7.4
-7.6 -7.8 -8(b)
4
pH
5 -6.8 I-6.9
!
* œ=1,4e-7
-7 - - ß- L= 5e-7•
-- ,•-- œ= 9e-7
-7.1
•
x œ=1,2e-6
,•, -7.2 -
• -7.3 --
• -7.4 --
--• -7.5 --
-•
-7.6 -- -7.7 -- -7.8 -- -7.9 --(d)
4
pU
5
-7.4-7.6
-7.8
-7
!
* L=7,8e-8
-7.2
- ß- L=
2,6e-7
'xx
- - ,• - - •- 4,7e-7
,, x
x •-6,7e-7
_ __ -8.2 --(e)
4
pH
5
* œ=
3,3e-•
-9.2 •- ',•x.•
- ß- œ=
6,5e-9
'.x..x.x'
• --,•--œ=
9,8e-9
-9.4
-. x
-9.6 --
'-.•
-9.8 -- '-. -10 --(f)
-9.55 o10.05pH
4 4.5 5 5.5 I I I I *, L= 3 e-10 - -I- •,= 7 e-10 -- •--•- 1.4 e-9 • •.,= 3 e-9 --:•- L= 5e-9 -10.55 -- 'XFigure 10. Evolution
of dissolution
rate as a function
of pH for different
dissolution
steps,
for (a) Ba, (b) Ca, (c) K,
21,298
DESBOEUFS
ET AL.: THE pH-DEPENDENT
DISSOLUTION
OF SAHARAN DUST
Table 8. Kinetic Parameter Values for Ba, Ca, K, Mg,
and Sr Dissolution as a Function of pH Values at Different Solubility Percentages
Element Ba Ca Mg Sr Solubility, % a log k 0.06 1.35 -5.6 0.12 1.47 -5.0 0.16 0.45 -9.9 0.50 0.71 -8.8 0.74 0.79 -5.0 2.64 0.71 -5.3 4.75 0.72 -5.4 6.33 0.75 -5.4 0.47 0.73 -5.3 0.58 0.77 -5.2 0.69 0.82 -5.0 0.79 0.87 -4.8 0.41 0.76 -5.5 1.37 0.77 -5.4 2.48 0.74 -5.7 3.53 0.77 -5.6 4.52 0.74 -7.4 8.90 0.71 -7.6 13.82 0.75 -7.4 The k value is expressed in min-•.mg -1.
The K percent solubility is low in respect to the maximum percent solubility, because the total reaction curves are very
different.
The study reported here has exposed aerosol analogs to conditions similar to those encountered in clouds during their
condensation phase. These results provided a first mechanistic approach to understanding aerosol dissolution in cloud droplets, and they offer a fundamental basis for modeling of the fluxes of dissolved elements, particularly trace metals, from mineral aerosols. This work also showed that the solubility is predictable
in terms of the pH/solubility relationship, which is important to
quality and quantify the chemistry of trace metals in the atmospheric aqueous phase and so their role in models of atmospheric chemistry [see Berglurid and Elding, 1995; Walcek et al., 1997, Losno, 1999]. The identification of the atmospheric mechanisms which control the trace metals input due dissolved-
particulate distributions contributes to characterizing the
atmospheric fluxes in the world's oceans. Future research on the complete evaporation-condensation cycles and their incorporation in photochemical cloud models will be critical.
Acknowledgments. We acknowledge the reviewers of this paper for
their useful and constructive comments. We would like to thank Franz
Rietmeijer of University of New Mexico for his English assistance.
References.
Anderson, M.A., and M.M. Morel, The influence of aqueous iron chemistry on the uptake of iron by the coastal diatom Thalassiosira
Weissflogii, Limnol. Oceanogr., 27, 789-813, 1982.
Bergametti, G., Apports de mati•m par voie atmosph•rique h la M6diterran6e occidentale: Aspect g6ochimique et m6t6orologique,
Th•se doctoral, Univ. Paris VII, Pads, 1987.
Berglund, J., and L. I. Elding, Manganese-catalysed autoxidation of dissolved sulfur dioxide in the atmospheric aqueous phase, Atmos.
Environ., 29, 1379-1391, 1995.
Berresheim, H., and W. Jaeschke, Study of metal aerosol systems as a sink for atmospheric SO2, J. Atmos. Chem., 4, 311-334, 1986.
Betzer, P.R., et al., Long-range transport of giant mineral aerosol particles, Nature, 336, 568-571, 1988.
Boutron, C.F., C.C. Patterson, and N.I. Barkov, The occurrence of zinc in Antartic ancient ice and recent snow, Earth Planet. Sci. Lett., 101, 248-259, 1990.
Brady, P.V., and J.V. Walther, Controls on silicate dissolution rates in neutral and basic pH solutions at 25øC, Geochim. Cosmochim. Acta,
53, 2823-2830, 1989.
Brand, L.E., W.G. Sunda, and R.R.L. Guillard, Limitations of marine
phytoplankton reproductive rates by zinc, manganese, and iron,
Limnol. Oceanogr., 28, 1182-1198, 1983.
Bruno, J., I. Casas, and I. Puigdom•nech, The kinetics of dissolution of UO2 under reducing conditions and the influence of an oxidized
surface layer (UO2+x): Application of a continuous flow-through
reactor, Geochim. Cosmochim. Acta, 55, 647-658, 1991.
Carroll-Webb, S.A., and J.V. Walther, A surface complex reaction model for the pH-dependence of corundum and kaolinite dissolution rates,
Geochim. Cosmochim. Acta, 52, 2609-2623, 1988.
Chou, L., and R. Wollast, Study of the weathering of albite at room temperature and pressure with a fluidized bed reactor, Geochim.
Cosmochim. Acta, 48, 2205-2218, 1984.
Clarke, A.G., and M. Radojevic, Oxidation of SO2 in rainwater and its
role in acid rain chemistry, Atmos. Environ., 21, 1115-1123, 1987.
Colin, J.L., J.L. Jaffrezo, and J.M. Gros, Solubility of major species in precipitation: Factors of variation, Atmos. Environ., Part A, 24, 537-
544, 1990.
Coud6-Gaussen, G., P. Rognon, G. Bergametti, L. Gomes, B. Strauss,
J.M. Gros, and M.N. Le Coustumer, Saharan dust over Fuerteventura
Island (Canaries): Chemical and mineralogical characteristics, air mass trajectories and probable sources, J. Geophys. Res., 92, 9753-
9771, 1987,
Coud6-Gaussen, G., P. Rognon, and M. Le Coustumer, Incorporation progressive de poussi•res sahariennes aux limons des iles orientales,
C.R. Acad Sci., Ser. H, 319, 1343-1349, 1994.
De Baar, H.J.W., A.G.J. Buma, G. Jacques, R.F. Nolting, and P.J. T•guer, Iron and manganese effects on phytoplankton growth, Ber. Polar.]%rschung, 65, 34-43, 1989.
Duce, R.A., P.S. Liss, et al., The atmospheric input of trace species to the
world ocean, Global Biogeochem. Cycles, 5, 193-259, 1991.
Faust, B., and J. Hoign6, Photolysis of FeIII-hydroxy complexes as
sources of OH radicals in clouds, fog and rain, Atmos. Environ., Part
A, 24, 79-89, 1990.
Flynn, C.M., Hydrolysis of inorganic iron (III) salts, Chem. Rev., 84, 31-
41, 1984.
Graedel, T.E., C.J. Weschler, and M.L. Mandich, Influence of transition
metal complexes on atmospheric acidity, Nature, 315, 240-242, 1985.
Graedel, T.E., M.L. Mandich, and C.J. Weschler, Kinetic model studies
of atmospheric droplets chemistry, 2, Homogenebus transition metal chemistry in raindrops, J. Geophys. Res., 91, 5205-5221, 1986. Helgeson, H.C., W.M. Murphy, and P. Aagaard, Thermodynamic and
kinetic constraints on reaction rates among minerals and aqueous solutions, II, Rate constants effective surface area, and the hydrolysis of feldspar, Geochim. Cosmochim. Acta, 48, 2405-2432, 1984. Herrmann, P., and G. H/inel, Wintertime optical properties of
atmospheric particles and weather, Atmos. Environ., 31, 4053-4062,
1997.
Hoffmann, M.R., and S.D. Boyces, Catalytic autoxidation of aqueous sulphur dioxide in relationship to atmospheric systems, Adv. Environ.
Sci. Technol., 12, 147-189, 1983.
Hoffmann, P., A.N. Dedik, F. Deutsch, T. Sinner, S. Weber, R. Eichler,
S. Sterkel, C.S. Sastri, and H.M. Ortner, Solubility of single chemical compounds from an atmospheric aerosol in pure water, Atmos.
Environ., 17, 2777-2785, 1997.
Holdren, G.R., and R.A. Berner, Mechanism of feldspars weathering, I, Experimental studies, Geochim. Coxmochim. Acta, 43, 1161-1171,
1979.
Holdren, G.R., and P.M Speyer, pH dependent changes in the rates and stoichiometry of dissolution of an alkali feldspar at room temperature,
Am. J. Sci., 285, 994-1026, 1985.
Jacob, D.J., E.W. Gottlieb, and M.J. Prather, Chemistry of a polluted cloudy boundary layer, J. Geophys. Res., 94, 12975-13002, 1989. Junge, C.E., The modification of aerosol size distribution in the
atmosphere, final technical report, Contract Da 91-591-EVC 2979, U.S. Army, San Diego, 1964.