Disaggregated Financial Statement Information in
an Unregulated Environment
by
Joshua David Anderson
B.A., Swarthmore College (2004)
M.Acc., the Ohio State University (2009)
Submitted to the MIT Sloan School of Management
in partial fulfillment of the requirements for the degree of
Doctor of Philosophy in Management
at the
MASSACHUSETTS INSTITUTE OF TECHNOLOGY
June 2015
© Massachusetts Institute of Technology 2015. All rights reserved.
Author . . . .
MIT Sloan School of Management
May 1, 2015
Certified by. . . .
John E. Core
Nanyang Techonological University Professor of Accounting
Thesis Supervisor
Certified by. . . .
Joseph Weber
George Maverick Bunker Professor of Management
Professor of Accounting
Thesis Supervisor
Accepted by . . . .
Ezra Zuckerman Sivan
Alvin J. Siteman (1948) Professor of Entrepreneurship and Strategy
Professor of Technological Innovation,
Entrepreneurship, and Strategic Management
Chair, MIT Sloan School of Management Ph.D. Program
Disaggregated Financial Statement Information in an
Unregulated Environment
by
Joshua David Anderson
Submitted to the MIT Sloan School of Management on May 1, 2015, in partial fulfillment of the
requirements for the degree of Doctor of Philosophy in Management
Abstract
This paper examines whether disaggregated financial statement information during the late 1920’s reduced information asymmetry. After controlling for firms endoge-nously selecting their level of disaggregation, I find that disaggregation reduced the information asymmetry between market participants and between the firm and out-side investors. Disaggregators had lower bid-ask spreads and short sellers paid lower loan fees for borrowing disaggregators’ stocks. In addition, disaggregators were more likely to raise capital in the following year. These results are consistent with firms using high-quality financial reporting to reduce information asymmetry even in the absence of regulation as a bonding mechanism.
Thesis Supervisor: John E. Core
Title: Nanyang Techonological University Professor of Accounting Thesis Supervisor: Joseph Weber
Acknowledgments
I appreciate comments from my dissertation committee—John E. Core and Joseph We-ber (co-chairs) and Eric C. So—as well as Henry L. Friedman, Rebecca Lester, Christopher F. Noe, Edward J. Riedl, Daniel Saavedra, Rodrigo Verdi, and Gre-gory B. Waymire in addition to seminar participants at the MIT Sloan School of Management, the Boston University School of Management, the Emory University Goizueta Business School, the London School of Economics and Political Science, and the 2014 AAA/Deloitte Foundation/J. Michael Cook Doctoral Consortium. I am also grateful to Suzie Noh for diligent research assistance.
Contents
1 Introduction . . . 13
2 Prior literature and hypothesis development . . . 17
2.1 Prior research on pre-SEC disclosure . . . 17
2.2 The effect of disaggregation on information asymmetry between market participants . . . 21
2.3 The effect of disaggregation on information asymmetry between the firm and capital providers . . . 23
2.4 Determinants of endogenous disaggregation . . . 24
3 Research design and sample selection . . . 25
3.1 Research design . . . 25 3.2 Sample selection . . . 32 3.3 Descriptive statistics . . . 33 4 Results . . . 36 4.1 Univariate tests . . . 36 4.2 Multivariate tests . . . 37 4.3 Robustness . . . 40 5 Conclusion . . . 43
A Taxonomy of financial statement items . . . 59
B Applying the taxonomy . . . 61
List of Figures
B-1 Canada Dry Ginger Ale’s 1926 Income Statement . . . 61 B-2 Park & Tilford’s 1926 Income Statement . . . 63
List of Tables
1 Test statistics for the cluster analysis . . . 46
2 Correlation of measures of disaggregation . . . 47
3 Financial statement items disaggregators are more likely to disclose . 48 4 Financial statement items aggregators are more likely to disclose . . . 49
5 Sample size and composition . . . 50
6 Descriptive statistics . . . 51
7 Differences in mean values of outcome and control variables for disag-gregators and agdisag-gregators . . . 52
8 Effect of disaggregation on the effective bid-ask spread . . . 53
9 Effect of disaggregation on the loan fee . . . 54
10 Effect of disaggregation on the propensity to raise capital . . . 55
11 Effect of disaggregation on the bid-ask spread . . . 56
12 Additions to the Loan Crowd short sale list by date . . . 57
1
Introduction
A central decision that financial statement preparers make is the level at which they aggregate financial statement information. At one extreme, financial statement pre-parers could provide users with transaction-level detail and not aggregate any infor-mation, as 46 states in the United States do (Watts, 2013). At the other extreme, preparers could aggregate all expenses and revenues into one line and not disaggregate any information, as 2% of industrial firms did in 1929 (Barton and Waymire, 2004). For publicly traded companies, we seldom see these corner solutions, in part because of regulation and in part because the transaction-level detail of any one of the mil-lions of transactions a firm engages in is unlikely to be material to decision makers. However, we do see significant variation in the extent to which firms disaggregate information between these extremes.
In this paper, I attempt to add to our understanding of the effects of aggregation on financial statement users by studying the disaggregation decisions of firms in the period prior to the founding of the Securities and Exchange Commission (SEC). During this period, firms were not subject to positive requirements to disclose material information and could effectively choose the level of disaggregation for their financial statements. The listing requirements of the New York Stock Exchange (NYSE) during this time specified little beyond a balance sheet, an income account to reconcile the change in retained earnings, and the frequency of future disclosures (Shultz, 1936). Some firms at this time chose not to disaggregate net income into revenues and expenses, while other firms provided income statement information similar to today’s financial statements.
in-formation asymmetry between equity market participants by allowing investors to estimate future cash flows more precisely. When information asymmetry is higher, individual investors have differing information sets and place relatively more weight on their private signals when estimating fundamental value. The greater weight on private signals decreases the asset’s liquidity (Akerlof, 1970; Grossman and Stiglitz, 1980). In contrast, when a firm disaggregates a financial statement item, all investors have that same piece of information as an input to their estimates of future cash flows, making investors’ information sets more similar. Having more similar infor-mation sets increases the weight on public signals and reduces the weight on private signals when estimating price. The Kyle (1985) model and other similar models pre-dict that, when information asymmetry is higher, transaction costs are higher. I use the bid-ask spread and demand from short sellers, reflected in the cost of shorting, as measures of the information asymmetry between equity market participants.
I also hypothesize that disaggregated financial statement information reduces the information asymmetry between the firm and capital providers. I use the issuance of new securities as a measure of the information asymmetry between the firm and capital providers. Higher information asymmetry between the firm’s managers and outside capital providers increases the cost of raising capital (Jensen and Meckling, 1976) and decreases the probability of accessing it (Myers and Majluf, 1984). Dis-aggregating financial statement information increases (decreases) the probability of raising capital to finance new projects if the additional information brings investors’ information set closer to (further from) that of managers.
To examine the effects of disaggregation, I collect financial statements information for a sample of NYSE firms from Moody’s Industrial manuals. I fit the information collected from firms’ financial statements into a taxonomy of 46 financial statement items based on firms’ descriptions of the information provided. Using the taxonomy, I determine whether each sample firm discloses a given item. I then classify firms into two types, disaggregators and aggregators, using cluster analysis on the set of disclosures the firm provides.
ef-fect of disaggregation on transaction costs in both the “long” and “short” markets. The effective bid-ask spread, the cost of trading in the equity market, is a common proxy for information asymmetry between investors. A distinctive feature of the pre-SEC era is that the loan fee, the explicit cost that short sellers pay to short a stock incre-mental to the bid-ask spread, was publicly available for a subset of NYSE stocks. In that time, as now, the short sellers trading at these rates were sophisticated investors (Jones and Lamont, 2002). This active market provides a test of disaggregation on information asymmetry among sophisticated investors who have better access to in-dividual information. Thus, information asymmetry in the short market is larger, potentially offering a more powerful setting to test the effects of disaggregation on information asymmetry. My research design to test this hypothesis includes controls for investors’ demand in both markets unrelated to information asymmetry and other aspects of the information environment. To determine whether the firm raised capital, I examine the changes in firms’ balance sheets. The model for capital raising includes controls for firms’ growth options, performance, and reputation in the capital market. In the absence of disclosure regulation, the decision to disaggregate a given finan-cial statement item is endogenous. To address this endogeneity, I model the decision to disaggregate using proxies for the agency and proprietary costs that I expect to influence disclosure. I find that firms with higher leverage (i.e., higher agency costs from debtholder-shareholder conflicts) are more likely to disaggregate. Firms with more growth options and younger firms (i.e., firms that have not been able to build a reputation in capital market) are also more likely to disaggregate. I then estimate the effect of disaggregation on information asymmetry and raising outside capital by using a model that attempts to address the endogenous choice to disaggregate.
I find that disaggregation reduces information asymmetry between market partici-pants. The bid-ask spread is 45% lower for disaggregators than aggregators, indicating that disaggregation decreases information asymmetry between all types of equity in-vestors. In terms of the absolute spread, disaggregation reduces the spread by 9.23 cents per share traded. Over the year, the transaction costs savings is eight basis points of market value. The cost to short sellers of borrowing disaggregators’ stock,
the loan fee, is also lower, indicating that disaggregation also decreases information asymmetry between sophisticated investors. Disaggregation also has a large impact on the loan fee (a 72% reduction relative to the sample mean). Small and medium aggregators are more likely to be added to the short sale list. This indicates that sophisticated investors have lower demand for disaggregators’ stocks because these investors place lower weight on private signal when estimating disaggregators’ prices. Disaggregation helps to equalize the information that all market participants have, reducing the information asymmetry between them.
I also find that disaggregation reduces information asymmetry between the firm and capital providers. Disaggregation increases the probability of raising capital from external sources by 51 percentage points. The difference between disaggregators’ and aggregators’ disclosure These results suggest that disaggregating disclosures such as depreciation, tax expense, and non-operating income so that investors can calculate an additional proxy for operating cash flows has economically significant benefits. These disclosures assist investors in estimating the firm’s operating cash flows. This piece of information helps investors determine the value of the securities the firm offers.
The results of this study are likely to be of interest to both regulators and aca-demics. The Financial Accounting Standards Board (FASB) and the International Accounting Standards Board (IASB) have begun a joint project on Financial State-ment Presentation (also known as the Income StateState-ment Project) with the aim of increasing the level of disaggregation in firms’ financial statements (IASB, 2010). The FASB and the IASB have expressed concern that the level of aggregation in cur-rent financial statements impairs financial statement users’ ability to predict firms’ future cash flows and to compare investment opportunities across firms. Most of the prior research on increasing disclosure does not distinguish between the frequency and quantity of disclosure (e.g., Lang and Lundholm, 2000). These studies often create a measure of disclosure that combines different types of disclosures, such as press releases, the text in regulatory filings, in addition to disaggregated financial statement numbers (e.g., Welker, 1995). My measure is a function of only numbers
presented in the financial statements of reports occurring with the same frequency across firms. My results provide an upper bound on the benefits that may accrue from proposed disaggregation since current Generally Accepted Accounting Princi-ples (GAAP) already requires firms to disaggregate the financial statement items I examine.
This study contributes the accounting literature by examining the effects of dis-closure on information asymmetry in an unregulated environment. An unregulated environment provides a setting to examine the market clearing equilibrium of de-mand for and supply of accounting information. While a few studies examine the effect of disclosure on information asymmetry solely in an unregulated environment (e.g., Granja, 2014), most studies on information asymmetry using unregulated set-tings generally examine the extension of regulation to new markets (e.g., Benston, 1969; Benston and Hagerman, 1974; Bushee and Leuz, 2005; Mahoney and Mei, 2006). In the latter set of studies, the outcomes in the unregulated period simply serve as a baseline against which to compare outcomes after regulation rather than as a set-ting in themselves. In addition, this study is one of the first to examine a relation between disclosure and transaction costs in the short sale market. Only one recent study (Beneish, Lee, and Nichols, 2014) examines the effect of disclosure on the cost to short a stock.
The paper is organized as follows. In Section 2, I review the prior literature and develop my hypotheses. I discuss my research design and sample selection in Section 3. I present my results in Section 4. Section 5 concludes.
2
Prior literature and hypothesis development
2.1
Prior research on pre-SEC disclosure
Firms made widely varying disclosure decisions before regulation, potentially offering greater power in testing hypotheses related to the effects of disclosure. However, there is less research about accounting choices during this period than there is about
current accounting choices. The main reason for this is that the environment in which firms produced financial statements is different along many dimensions, so it can be hard to apply the results to accounting questions that firms and regulators wrestle with today (Leftwich, 2004). In addition, the accounting data are not available in an electronic format, and institutional knowledge about the period is harder to obtain.
Researchers studying this period find that financial statements in the early 1900’s changed investors’ estimates of future cash flows. Porter, Sivakumar, and Waymire (1995) find that the American Sugar Refining Company experienced significant posi-tive abnormal returns of 1.6% when the company released its financial statements in 1908. Using a broader sample from 1905 to 1910, Sivakumar and Waymire (1993) find that financial statements produced significant volume reactions when firms published them. While the volume reaction indicates that these financial statements changed investors’ estimates of future cash flows, providing financial statement information did not often have a significant effect on price, the marginal investor’s estimate of future cash flows. Investors reacted significantly only to reported losses but not to positive income unless dividend changes accompanied the positive income.
Sivakumar and Waymire (1993, 1994) offer three explanations for this muted price reaction to financial statement information. The first is that investors found the in-formation from other sources in a more timely manner. During this period, there were no regulations prohibiting insider trading, so the set of investors included insiders who had access to financial statement information before its release. These insiders could impound the information into price before the firm released its financial statements. A second explanation is that firms could not demonstrate a commitment to disclose information regardless of the content of the information. There was no regulation to compel disclosure, and it is not clear that auditors were an effective commitment to disclosure (Merino, Mayper, and Sriram, 1994). Disclosure reduces information asymmetry only when there is a credible commitment to disclose both the good and bad information a firm receives (Diamond, 1985; Leuz and Verrecchia, 2000). Finally, the muted price reaction could stem from a lack of standardized accounting methods. Financial statements rarely disclosed the accounting policies that led firms to report
the financial statement information they did disclose (Hoxsey, 1930, pp. 254–255). Without this context and without the ability to compare accounting methods across firms, financial statement users may not have valued the incremental information pro-vided by the financial statements. For all of these reasons, disclosure may not have reduced information asymmetry in this setting.
The heterogeneity in disclosure during this period extends to firms’ choices about the level of disaggregation in their financial statement information. Nearly two-fifths of firms in the late 1920’s concealed their margins by aggregating revenue and var-ious operating expenses (Barton and Waymire, 2004; Benston, 1969). Some firms began their income statements with earnings before interest, taxes, depreciation, and amortization (EBITDA); others started with operating income. Two percent of firms aggregated all of the information from their income statements into net in-come, depriving investors of the incremental information from revenues and expenses observed in modern markets (Swaminathan and Weintrop, 1991). While Sivakumar and Waymire (1993) recognize this variation in disaggregation, they do not examine the reaction to the release of financial statements as a function of the disaggregated financial statement information that the firms provided.
Studies that do examine firms’ choices to disaggregate financial statement infor-mation during this period use a cross-section of firms at one point in time. For example, Ely and Waymire (1999) examine the value relevance of all 405 NYSE in-dustrial firms’ intangible assets disclosure for the year 1927. Their study does not examine the choice to disaggregate other financial statement information. The study most similar to this one is Barton and Waymire (2004). Barton and Waymire examine the financial reporting quality of all 540 firms listed on the NYSE in October 1929 that are neither railroads nor financial service firms. They find that firms with higher financial reporting quality have less negative returns during the 1929 stock market crash. Their definition of financial reporting quality is a composite measure derived from a factor analysis of income statement disaggregation, balance sheet disaggrega-tion, auditor size, and unconditional balance sheet conservatism. The degree to which disaggregated financial statement information reduces crash risk, as opposed to the
other factors, is not entirely clear from the study.
When analyzing the determinants of financial reporting quality, Barton and Waymire (2004) also examine whether these determinants predict each component of financial reporting quality separately. More determinants are significantly related to income statement disaggregation than balance sheet disaggregation. Newer firms and more leveraged firms are more likely to disaggregate income statement numbers, while reg-ulated firms provide more aggregated disclosure. Contrary to Barton and Waymire’s expectations, firms with more volatile net income, higher profitability, and greater divergence between ownership and control rights provide more aggregated income statement information. Greater balance sheet disaggregation, in contrast, is signifi-cantly related only to two industry groupings: technology-intensive and unregulated industries.
This study differs from that of Barton and Waymire (2004) in its focus and in measuring the construct of interest. Barton and Waymire (2004) examine the ef-fect of financial reporting quality on crash risk, a measure of information asymmetry during extreme negative events. They do not examine the effect of their composite measure of financial reporting quality on information asymmetry during less extreme events. I examine measures of information asymmetry during a period when stocks generally performed well rather than an extreme negative event. I specifically exam-ine disaggregated financial statement information rather than a composite measure such as financial reporting quality. The disaggregation components of financial state-ment quality that Barton and Waymire (2004) use implicitly assumes that each item is equally informative. In contrast, I use cluster analysis to classify firms as disaggre-gators or aggredisaggre-gators. The cluster analysis is based on firms’ actual disaggregation decisions and allows disaggregation of different financial statement items to have different impacts on determining the overall level of disaggregation in the financial statements. While the two studies examine similar data, the research questions and methods differ significantly.
2.2
The effect of disaggregation on information asymmetry
between market participants
In the model Kyle (1985) develops, a lower variance of the fundamental value causes the market maker to reduce transaction costs. Both more timely financial statement information and more disaggregated financial statement information allow market participants to estimate the firm’s fundamental value more precisely. The prior lit-erature on the effects of disclosure does not generally make a distinction between an increase in the frequency of disclosure, such as providing more frequent forecasts of earnings per share, and an increase in the quantity of disclosure, such as disaggrega-tion (e.g., Welker, 1995; Lang and Lundholm, 2000). Some studies have examined the impact of increased disaggregation on information asymmetry by examining changes in regulation that require all firms to provide information some firms voluntarily pro-vided before the regulation. Greenstein and Sami (1994) find that firms that disclose segment sales and income for the first time after the SEC required it experienced larger decreases in their bid-ask spreads than firms that provided this information voluntarily before the SEC requirement and than single-segment firms. However, it is not clear that investors could ex ante identify firms with multiple segments that did not report segment sales and income in order to penalize them for the higher information asymmetry (Dye, 1985; Jung and Kwon, 1988). Frino and Jones (2005) find that bid-ask spreads for Australian firms disclosing cash flow from operations for the first time fell relative to Australian firms voluntarily providing cash flow state-ments before the requirement to do so. The effect was also larger for firms with a lower correlation between cash flow from operations and proxies based on the other available financial statement numbers.
These studies indicate that even though investors can approximate the disaggre-gated financial statement information based on other available disclosures, firms can still reduce information asymmetry by providing this information directly. However, the magnitude and significance of the results may be affected by the commitment or enforcement mechanism that compels disaggregating the additional information.
Empirically, commitment is particularly important for disaggregated disclosures to reduce information asymmetry. Leuz and Verrecchia (2000) find that large German firms whose auditors certified the additional information required under International Accounting Standards had lower information asymmetry than firms that reported un-der German GAAP. However, firms that disclosed the same information but did not have an auditor certify the additional information did not have lower information asymmetry. Leuz and Verrecchia conclude that disclosure without the commitment to disclosing good and bad news from engaging an independent auditor have no effect on information asymmetry.
Another potential reason not to disaggregate financial statement information is that the disaggregated information may be quite noisy. If each transaction is mea-sured with some error, the greater specificity of disaggregated financial statement items decreases the signal-to-noise ratio because fewer of the error terms from in-dividual transactions are averaged together. In contrast, more highly aggregated financial statement items such as net income average relatively more error terms, in-creasing the precision of the overall measurement and inin-creasing investors’ reliance on aggregated disclosures to estimate future cash flows. Investors’ will assign a nonzero weight to a very noisy signal or one highly correlated with other signals, but such signals receive low weights. If a firm incurs fixed costs to set up an information system to measure the disaggregated financial statement information or proprietary costs from the additional disclosures, the benefit of better disclosures may not offset these costs if the additional disaggregated information is relatively noisy or highly correlated with other disclosures. In addition, if competition is imperfect, net trading reveals information about firm value. A portion of the benefits from improved public disclosure substitutes for the information contained in demand (Fischer and Verrec-chia, 1999). Under imperfect competition, volume becomes an additional signal that can reduce the value of disaggregated financial statement information to investors.
While models demonstrate that public disclosure on net reduces information asym-metry between investors (Fischer and Verrecchia, 1999; Gao, 2008), the magnitude of the net effect is not clear because of the noise in and correlation between all of
the other signals available to investors. For instance, Porter et al. (1995), in their case study of the American Sugar Refining Company (ASR), do not find a signifi-cant change in the bid-ask spread around ASR’s decision to publish annual financial statements (footnote 33 on p. 138). A possible reason for this is that investors had access to a significant amount of the information contained in the first annual report before it was published. ASR’s first annual report consisted of a balance sheet and net income. Massachusetts state law required ASR to publish balance sheets in the financial press prior to ASR’s decision to publish annual financial statements. Net income is simply the change in retained earnings adjusted for dividends. Since the financial press reported extensively on dividends, investors could approximate net income based on the balance sheet disclosures without the separate disaggregation of net income. While the results of this case study may not generalize to the set of all disclosures, studies of the disaggregated disclosures required by the Securities Exchange Act of 1934 generally do not find a significant reduction in information asymmetry after firms disclose this new information (e.g., Benston and Hagerman, 1974; Daines and Jones, 2007; Mahoney and Mei, 2006).
H1: Disaggregated financial statement information reduces information
asymme-try between market participants.
2.3
The effect of disaggregation on information asymmetry
between the firm and capital providers
The need for capital is one reason for managers to reduce information asymmetry. A firm’s choice between raising capital and relying on internally generated funds is a function of the information asymmetry between the firm and outside capital providers (Myers and Majluf, 1984). Firms with no information asymmetry, and hence no underpricing from information asymmetry, take advantage of every project with positive net present value by issuing equity. Lang and Lundholm (2000) find that firms increase disclosure prior to seasoned equity offerings (SEO’s) to bring potential investor’s information set closer to that of managers. These firms receive better terms
for their offerings even though a subset of high disclosure firms reduces disclosure after the SEO. Disaggregating financial statement information provides investors with a more precise estimate of the firm’s fundamental value, causing them to discount the firm’s stock less and increasing the likelihood of raising external capital.
H2: Disaggregated financial statement information reduces information
asymme-try between the firm and capital providers.
2.4
Determinants of endogenous disaggregation
Models of disclosure choice find that agency costs and growth options increase the extent of disclosure and that proprietary costs and the richness of the external in-formation environment decrease the extent of disclosure. Increased disaggregation, along with other corporate governance mechanisms, provides parties whose interests conflict with the information necessary to make sure that their interests are pro-tected (Jensen and Meckling, 1976). Firms with more growth options have greater information asymmetry between insiders and outsiders (Smith, Jr. and Watts, 1992). Managers who have information about valuable projects stemming from these growth options can convey that information through increased disclosure. Proprietary costs can lead managers to provide less than full disclosure. By aggregating disclosure, managers can obscure the firm’s production function and prevent potential competi-tors from reverse engineering a profitable firm’s strategy (Darrough and Stoughton, 1990). This preserves economic rents that the firm can extract through lower compe-tition. Porter et al. (1995) document that proprietary costs were much lower in 1907 when the American Sugar Refining Company began providing annual financial state-ments than when the American Sugar Refining Company was founded in the 1890’s and chose not to provide financial statements. When investors have other sources of information about firms, through the financial press or through past interactions in the marketplace, they do not need to rely on the firm itself to disclose as much information.
3
Research design and sample selection
3.1
Research design
Measure of disaggregation
To measure the extent of disaggregation, I collect financial statement information from Moody’s Industrial manuals, following Barton and Waymire (2004). I fit the information I collect into the taxonomy reported in Appendix A. For each of the 46 financial statement items, I create indicator variables that take the value of one if the firm discloses the financial statement item. I use the indicator variables for financial statement information from the income statement to determine whether investors could calculate six income statement subtotals.1 I then use cluster analysis on the full
set of 52 financial statement items to separate the observations into natural groupings using Ward’s hierarchical clustering method. This is an agglomerative hierarchical clustering procedure that merges similar observations into clusters (Dey, 2008). The clustering algorithm maximizes the differences between groups and minimizes the differences within groups.
This method of measuring disaggregation is different than using an index. Using a
1A concern with this definition of disaggregation is that some firms do not disaggregate a given
financial statement item because its value is not material (i.e., financial statement users’ decisions based on statements disaggregating the item would not be different from the decisions reached using financial statements that aggregates the item with other financial statement items) or a firm does not have a given item because of its economics (e.g., intangible assets) or financing decisions (e.g., long-term debt and associated interest expense). As seen in Table 3, the five largest difference are income statement items or subtotals that rely on three disclosures beyond net income: tax expense, depreciation expense, and a distinction between operating and non-operating or financing income and expenses. All firms are U.S. firms and subject to corporate income taxes. While few firms report a loss, firms could carry losses forward for two years to offset future income taxes (Wilson, 2012, p. 22). All firms have at least 4% of their assets invested in long-term assets and 75% of my sample has at least a quarter of total assets invested in property, plant, and equipment (PP&E). Given this distribution, it seems likely that depreciation expense is material for these firms. Lastly 86% of the sample disaggregate non-operating income or interest expense from operating expenses (allowing investors to calculate EBITDA as in Appendix B) or does not disclose tax expense (depriving investors of the ability to calculate EBITDA). Of the 76 observations that disaggregate tax expense but not non-operating income, only 48 (9% of the sample) disaggregate depreciation expense. Overall, this method correctly classifies at least 86% of the sample and may classify 91% correctly. On balance, this evidence indicates that aggregation because of the materiality of the financial statement item does not have a significant effect on classification as a disaggregator or aggregator.
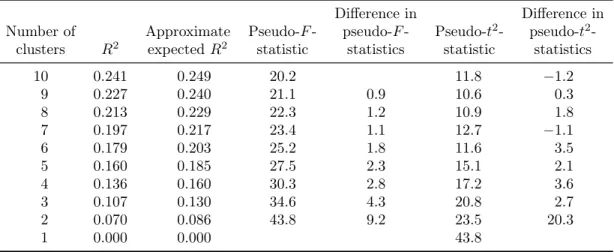
clustering method ensures that the identification of firms as disaggregators or aggre-gators is based on the relative disaggregation of the sample firms’ financial statement information. Creating an index relies on an observer considering certain disclosures to be important. More importantly, an index that counts financial statements implicitly assumes that each item in the index is equally important. Cluster analysis does not make a similar assumption in calculating the differences between clusters. The main drawbacks of using cluster analysis are that choosing the number of clusters to divide the sample into is heuristic and that the resulting clusters may not be reasonable. While there is no accepted criterion for determining the optimal number of clusters, the pseudo-𝐹 - and pseudo-𝑡2-statistics provide an indication of the appropriateness
of dividing the sample into a given number of clusters from a statistical perspective. If the difference between the pseudo-𝐹 -statistic for 𝑛 clusters and the statistic for 𝑛 + 1 clusters is large, then, statistically, it is appropriate to divide the sample into 𝑛 clusters. If the difference between the pseudo-𝑡2-statistic for 𝑛 − 1 clusters and the
statistic for 𝑛 clusters is large, then, statistically, it is appropriate to divide the sample into 𝑛 clusters. In Table 1, both the pseudo-𝐹 - and pseudo-𝑡2-statistics indicate that
it is appropriate to divide the sample into two clusters. I discuss the reasonableness of the results of the cluster analysis in Section 3.3.2
Tests of the effect of disaggregation on information asymmetry between market participants
I use transaction costs as a measure of the information asymmetry between market participants in my test of H1. The main transaction costs equity market participants
face is the bid-ask spread. All equity market participants must absorb the difference between the market maker’s bid and ask prices, the bid-ask spread, when they estab-lish and liquidate positions in a stock. Transaction costs, 𝜆 in the Kyle (1985) model, are a function of the variance of the firm’s fundamental value and the variance of
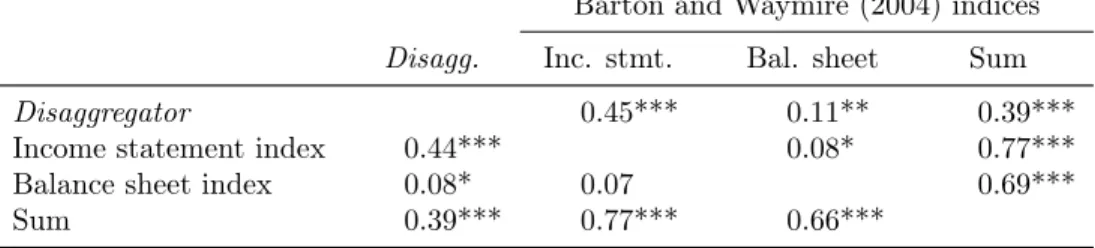
2Table 2 presents the correlations between the cluster-based approach to identifying
disaggrega-tors and the indices that Barton and Waymire (2004) use. The variable Disaggregator that identifies the cluster with disaggregated financial statement information is significantly correlated with both the income statement and balance sheet indices that Barton and Waymire (2004) use and with the sum of the two indices. The correlation is highest with the income statement index.
the quantity demanded by noise traders (i.e., traders without the private information about firm value and, hence, no weight on private information on their estimate of firm value). I use stock volatility over the year contemporaneous with the disclosure as a proxy for the variance of the fundamental value unrelated to disclosure. I use the the volume of the stock traded as a proxy for the variance in noise trading. When the variance of the quantity noise traders demand is high, informed traders are also willing to trade more of the asset. Thus, high volume, whether or not the volume ultimately comes from noise traders, indicates that the variance of the quantity noise traders demand is high.
Firm size is likely correlated with both of the constructs in the Kyle (1985) model. Firm size is negatively correlated with the variance of fundamental value because larger firms receive more attention from market participants and the financial press. This increased public attention increases investors’ understanding of the firm as well as the similarity of investors’ information sets. The greater public attention also makes it less likely that other market participants have an information advantage, increasing noise traders’ willingness to trade the stock after a liquidity shock. These control variables (stock volatility, volume, and firm size) are the same set used in several studies of bid-ask spreads, including studies of the effects of disclosure on measures of liquidity (e.g., Chordia, Roll, and Subrahmanyam, 2000; Christensen, Hail, and Leuz, 2013; Daske, Hail, Leuz, and Verdi, 2008). I control for denominator effects from using the relative bid-ask spread by including the natural logarithm of year-end price. Welker (1995) examines effective bid-ask spreads before decimalization (i.e., when spreads were quoted in eighths) and includes price as a determinant of the effective bid-ask spread. I define all variables in Appendix C.
However, the Kyle (1985) model is an abstraction in which the market maker sim-ply matches buyers and sellers. In reality, transaction costs are also a function of order processing costs, specialists’ monopoly power as market makers, and inventory hold-ing costs (Glosten and Harris, 1988). The information asymmetry component may not be the most significant component of the bid-ask spread (Huang and Stoll, 1997), though the bid-ask spread is definitely related to information asymmetry
(Madha-van, 2000). Thus, the bid-ask spread is a noisy proxy for the information asymmetry between investors.
Model of the endogenous choice to disaggregate financial statement infor-mation
Disaggregation is an endogenous choice during this period. The New York Stock Exchange required firms to present a balance sheet and the income account to rec-oncile the changes in equity, but did not specify what items to disaggregate until 1930 (Shultz, 1936). Therefore, I use instruments to model disaggregation. Because disaggregation is a binary choice, I use a first-stage probit model to predict disaggre-gation, the endogenous treatment choice. To aid in identification, the probit model contains instruments that are excluded from the second stage. I use leverage and the payout ratio as proxies of the agency costs from debtholder-shareholder conflicts and from manager-shareholder conflicts, respectively. Disaggregation can help contracting parties protect their varied interests and reduce agency costs (Jensen and Meckling, 1976). Since the bid-ask spread is a measure of information asymmetry among eq-uity investors, this group has a homogeneous set of interests in the agency conflict so agency costs should not affect trading costs among this group. Therefore, these instruments should be related to the probability of disaggregation but not related to the bid-ask spread. I use the book-to-market ratio to measure firms’ growth options, which should also increase disclosure, including disaggregation. I use the number of firms in the industry and performance as proxies for firms’ proprietary costs. I use age and size to measure firms’ external information environment. Since the information environment directly affects the information asymmetry between investors, these are not instruments that meet the exclusion restriction. The requirements necessary to consistently estimate the instrumented treatment effect are much lower than using linear two stage least squares (Wooldridge, 2010, pp. 939–940). This makes an en-dogenous treatment model (ETM) an attractive research design for this setting given that the proxies for the determinants of disaggregation may not have a very strong correlation with the underlying constructs.
Test of the effect of disaggregation on information asymmetry using the short sale market
Demand from short sellers increases in disagreement about fundamental value, which is a consequence of information asymmetry (Dechow, Hutton, Meulbroek, and Sloan, 2001; Karpoff and Lou, 2010; Miller, 1977). If market participants can estimate future cash flows more precisely for disaggregators, their stocks are less likely to be overpriced. The reduction in potential overpricing will decrease short sellers’ demand to short disaggregators’ stocks because these stocks present relatively less profitable opportunities. However, there is no volume data in the short sale market (also called short interest) for my sample period (Jones and Lamont, 2002) to measure short sellers’ demand directly. Meeker (1932) provides a list of 33 firms with short interest in excess of $500,000 on Novermber 12, 1929. This list does not provide a panel of short sellers’ demand and is compiled shortly after stock market crash in October 1929. Further, the dollar-based cutoff excludes identifying firms with large short interest as a percentage of shares outstanding for small firms (e.g., Asquith, Pathak, and Ritter, 2005; Dechow et al., 2001). While I cannot measure short sellers’ demand directly, short sellers’ higher demand from information asymmetry ceteris paribus increases the cost of shorting a stock (D’Avolio, 2002). In addition to the bid-ask spread, short sellers face two additional costs in shorting a stock. The first is the search costs of finding a share to borrow. Through at least 1932, a group of securities lenders (the “Loan Crowd”) met intermittently throughout the day and at the close of the market to lend shares to short sellers (Meeker, 1932, p. 38). The search costs for the stocks fell when they were added to the Loan Crowd list. Once on the list, the search costs for the stocks this group actively lent were minimal and homogeneous.
The second cost is the loan fee, the explicit cost of shorting a stock. The loan fee is an opportunity cost that short sellers face. Short sellers must post collateral while the stock loan is outstanding (Jones and Lamont, 2002; Lamont, 2004). While the security lender pays interest on this collateral, the interest earned on the collateral (also known as the rebate rate) is lower than the market interest rate. In extreme
cases when demand is very high, the rebate rate is negative, and the short seller pays the security lender interest on the collateral (D’Avolio, 2002). Since the market interest rate is common to all investors, the rebate rate is the key determinant of the price that short sellers pay (Lamont, 2004). The Loan Crowd publicly disclosed the rebate rates paid on the stocks they were willing to lend. The Wall Street Journal published a list of the rebate rates daily from at least 1919 through 1933 (Jones and Lamont, 2002). Using the data on market interest rates and the Loan Crowd’s rebate rates, I calculate the loan fee related to shorting stocks the Loan Crowd was willing to lend as an indirect proxy for short sellers’ demand. As an indirect proxy for short sellers’ demand, the loan fee will include noise from changes in supply. Additional noise in this proxy will come from demand from short sellers engaging in convertible arbitrage, which caused some extreme spikes in demand (Jones and Lamont, 2002).
If disaggregation reduces information asymmetry and, hence, the weight placed on private signals about fundamental value, then short sellers’ demand to short the stock will be lower, reducing the loan fee. To determine the effect of disaggregation on information asymmetry about stocks on the Loan Crowd list, the research design controls for other determinants of short sellers’ demand. Disagreement about fun-damental value is larger when the variance of future cash flows is larger. As with the bid-ask spread, I use stock volatility as a proxy for this uncertainty. Investors in the late 1920’s used short sales to hedge market risk (Meeker, 1932). Since large stocks have the most influence on value-weighted market returns, demand for short-ing large stocks should be larger. The large short positions that Meeker (1932) lists are more likely to be based on many participants hedging market risk rather than on a few short sellers with private information taking very large position. Assuming that the set of firms used to hedge market risk was reasonably stable over my panel and through the October 1929 crash, I use the inclusion on the list as a proxy for demand from hedgers rather than from information asymmetry. Firms with higher past returns and lower book-to-market ratios are also more likely to be overpriced. This potential overpricing increases short sellers’ demand for the stock (Dechow et al., 2001; Beneish et al., 2014). On the supply side, most measures of lendable supply,
such as institutional ownership, are not available during my sample period. However, D’Avolio (2002) finds that firms with higher turnover have higher loan fees. This is consistent with lenders being more likely to sell high-turnover stocks and requiring higher compensation to forgo the option to sell the stock themselves. I estimate the effect of disaggregation using an ETM for the same reasons that I use an ETM to estimate the effect of disaggregation on the bid-ask spread.
Test of the effect of disaggregation on information asymmetry between the firm and capital providers
I use firms’ balance sheets to determine whether firms raise capital during the year. I calculate the difference in the value of long-term debt (bonds and mortgages payable) and the par values of preferred and common stock. If the par value of common stock increases, I also calculate the difference in capital surplus (if disclosed) or the difference in surplus net of income, surplus adjustments, and dividends declared (if the firm does not disclose the capital surplus). I add this change to the change in the par values and the value of long-term debt. If the sum of these changes is positive and greater than five percent of total assets at the beginning of the year, then I identify the firm as raising capital in that year. Adding the changes together excludes refinancing transactions. Excluding refinancing opportunities allows me to focus on how disaggregation affects the information asymmetry between managers and capital providers from growth opportunities rather than the variation in agency costs related to capital structure.
Since raising capital and disaggregation both have binary outcomes, I estimate the effect of disaggregation on capital raising using a bivariate probit model. This accounts for the fact that the errors at both stages are correlated with the regres-sors (Baum, 2013). Using a bivariate probit model also ensures that the predicted probabilities for both the endogenous decision to disaggregate financial statement in-formation and to raise capital fall between zero and one. In the second stage of the bivariate probit model, I control for performance, growth opportunities, and reputa-tion in the capital market, all of which should make it easier for a firm to raise capital.
The controls for performance are stock returns over the fiscal year and accounting performance using the return on assets (ROA). For growth opportunities, I use the book-to-market ratio, stock volatility (Cao, Simin, and Zhao, 2006), and the payout ratio. Firms with high payout ratios do not anticipate needing the capital they pay-out to finance new investments. To measure firms’ reputation, I use age, size, and an indicator variable for an investment grade security.3
3.2
Sample selection
The Center for Research in Securities Prices (CRSP) database reports daily price and volume data beginning on December 31, 1925. To reduce concerns about reverse causality, I examine the effect of disaggregation and other controls on future proxies for information asymmetry: the bid-ask spread, the loan fee, and capital raising. Therefore, my sample begins with firms’ 1926 financial statements to match firms’ financial statements to controls such as stock volatility and turnover. I end my panel with firms’ 1928 financial statements to minimize the effect of the stock market crash in October 1929 on the year-ahead outcomes.
My sample comprises two subsets of U.S. industrial firms with return and volume information in CRSP. The sample comprises industrial firms because these firms offer the most powerful test of the trade-offs from disaggregated disclosure. I exclude rail-roads and public utilities because the Interstate Commerce Commission (Sivakumar and Waymire, 2003) and state regulators (Barton and Waymire, 2004), respectively, used these firms’ financial statements to cap the rates they charged. This regula-tion commits these firms to a specific set of disaggregaregula-tion choices and creates a set of financial reporting objectives that industrial firms do not have. I construct my measure of disaggregation using financial statement items such as inventory, cost of goods sold, and gross profit, which do not extend easily to financial firms, so I exclude financial firms as well.
3During this period, Moody’s rated not only firms’ debt but also their preferred and common
stocks. Basu, Prakash, and Waymire (2004) find that these ratings are related to the level of financial statement ratios such as the return on equity and the current ratio but do not examine the effect of not disaggregating the information necessary to calculate these ratios on security ratings.
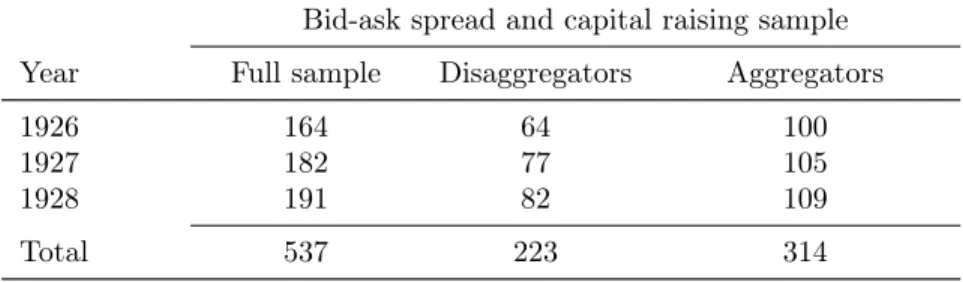
The first subset consists of industrial firms in CRSP for which the “Loan Crowd,” a centralized market for short sellers to borrow stock, sets rebate rates. While the Wall Street Journal published these rebate rates daily, I follow Jones and Lamont (2002) in collecting monthly observations of rebate rates rather than collecting daily observations. Approximately one-fifth of the CRSP industrial firms have rebate rates published in the Wall Street Journal at some point during my sample period. For each firm that appears on the Loan Crowd list at any point over the sample period, I collect financial statement data for all available years whether or not the firm-year has corresponding data on the rebate rate. I use these additional observations in the bid-ask spread and capital raising tests.
The subset of firms with easily shortable stock is not random. Firms on the Loan Crowd list are larger, less volatile, and have higher turnover than the full sample of all stocks. (Compare Panels A and B of Table 6.) In addition to firms with short sale data available, I sort industrial firms in CRSP that never appear on the short sale list by decreasing market capitalization on December 31, 1926. I then collect data on every third firm after randomly selecting the starting number. I repeat the same procedure for firms that enter the CRSP database in 1927 and 1928. Supplementing the short sale sample in this way alleviates concerns that the non-random selection of firms with short sale data influences my tests that do not require an active short sale market.
3.3
Descriptive statistics
Tables 3 and 4 present the percentage of firms in the sample and within each cluster that disaggregate the individual financial statement items listed in Appendix A. These tables also present the difference in the propensity to disclose the various financial statement items and the 𝑡-test that the propensities are equal. Table 3 lists the financial statement items that disaggregators are more likely to disclose sorted by the magnitude of the difference in the propensity to disclose the financial statement items. Table 4 presents the financial statement items that aggregators are more likely to disclose, again sorted by the magnitude of the difference. The first observation is
that disaggregators are more likely to disclose three times as many financial statement items as aggregators are (35 or 76% as opposed to 11 or 24% of the 46 financial statement items). Disaggregators are also more likely to disclose 26 (76%) of the 30 financial statement items with differences significant at the 5% level. In addition, 12 financial statement items in Table 3 have differences with a larger magnitude than the magnitude of the largest difference in Table 4. All of this indicates that the clustering procedure successfully divided the observations into a set of observations with more disaggregated financial statement information and a set of observations with more aggregated financial statement information.
Examining the specific differences in disaggregation between disaggregators and aggregators, disaggregators are much more likely to disclose income statement subto-tals, such as EBITDA, operating income, and gross profit. Disaggregators are also much more likely to disclose the expenses that separate these financial statement subtotals, such as tax expense, depreciation expense, and other income. The largest difference between disaggregators and aggregators is the disclosure of EBITDA. Dis-aggregators are ten times more likely to provide this additional signal of future cash flows that is not perfectly correlated with net income. Since discounted future cash flows determine the value of the firm today, providing a correlated but not identical measure of future cash flows, such as EBITDA, in addition to net income helps in-vestors better estimate the value of those cash flows. All of the ten largest differences are income statement items related to the flow of economic resources into and out of the firm. The financial statement items that aggregators are more likely to disclose are mainly balance sheet items that provide a value at a specific point in time rather than potentially recurring cash flows.
Disclosure of income statement items has a higher odds ratio in classifying firms as disaggregators or aggregators (i.e., the magnitude of the differences for income statement items is larger than the magnitude for balance sheet items). Greater stan-dardization of the balance sheet is consistent with accountants’ focus on the balance sheet in the early 1900’s (Previts and Merino, 1998) as well as with the first audits being verifications of firms’ balance sheets for credit decisions (Ely and Waymire,
1999, p. 24). However, disaggregators are significantly more likely to disaggregate balance sheet items such as tax reserves (similar to “taxes payable”) and accumulated depreciation. Disaggregators are also significantly more likely to disclose capital sur-plus (now called additional “paid-in capital”) and earned sursur-plus (now called “retained earnings”) rather than aggregate these numbers into an ambiguous disclosure labelled “surplus.” The magnitude of the differences for these balance sheet items, however, is simply not as large as the magnitude of the differences in the propensity to disclose income statement items.
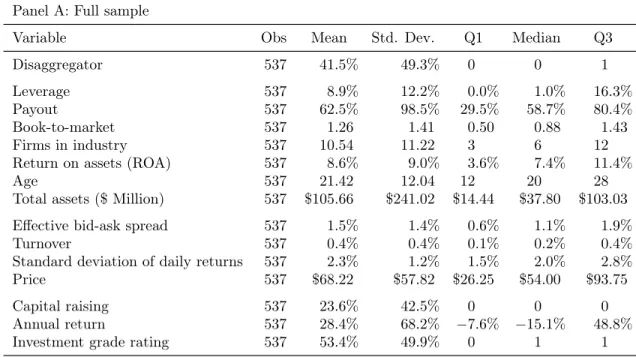
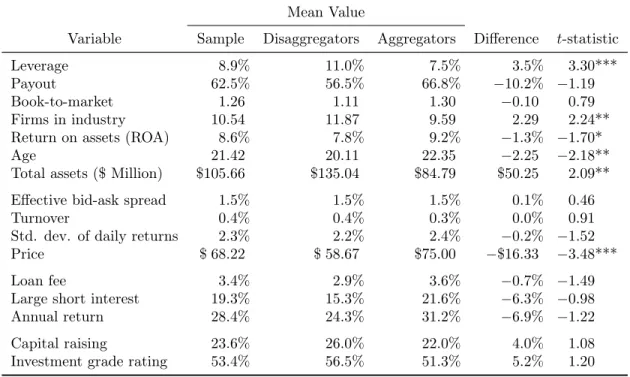
Table 5 provides the number of observations per year and per firm for both the full sample and the short sale subsample. Observations in the sample are spread fairly evenly across all three years. Similarly, disaggregators and aggregators are not clustered in any year. However, the growth in the number of disaggregators for the full sample is larger than the growth in the number of aggregators. I have a full panel (three years) of observations for 71% of the full sample (67% of the short sale sample). Table 6 provides the descriptive statistics for the variables used in this analysis. The payout ratio (the ratio of dividends paid to net income) is very large. In the early 1900’s, investors debated whether firms should retain any profits beyond what was needed to replace long-lived assets because retaining earnings circumvented investors’ veto over new projects (Previts and Merino, 1998). The agency costs of resources retained in the firm prompted investors to demand high payout ratios. The mean (median) effective bid-ask spread (the absolute bid-ask spread scaled by stock price) for my sample is 1.5% (1.1%), which is similar to some studies of modern markets (e.g., Welker, 1995) and lower than the effective bid-ask spreads of small modern firms (e.g., Cheng, Liao, and Zhang, 2013). The distribution of the effective bid-ask spread is highly skewed. Following other studies (e.g., Christensen et al., 2013; Daske et al., 2008; Welker, 1995), I regress the natural logarithm of the effective bid-ask spread on its determinants. The distribution of the loan fee (presented in Panel B) is not as highly skewed as that of the effective bid-ask spread. Therefore, I regress the untransformed loan fee on its determinants. Firms with an active short sale market for their stocks were much larger than the full sample of firms. Also, these firms’
stock was more liquid and less volatile than stocks overall.
4
Results
4.1
Univariate tests
Table 7 presents a univariate analysis of the characteristics of disaggregators and ag-gregators. Given the endogenous choice to disaggregate financial statement informa-tion, a number of the determinants of disaggregation are significantly different across disaggregators and aggregators. Firms with higher agency costs from debtholder-shareholder conflicts (higher leverage) are more likely to disaggregate. Firms with higher proprietary costs (fewer competitors and higher performance) are less likely to disaggregate. Younger firms with a shorter track record for investors to follow are more likely to disaggregate. Contrary to the intuition that larger firms rely on a better external information environment rather than disaggregation, larger firms are more likely to disaggregate. Larger firms have more assets and are more likely to have different types of assets with different types of cash flows. This heterogeneity may make disaggregation more natural, regardless of the information environment. The significant differences in agency and proprietary costs underscore the importance of using a research design that addresses the endogenous choice to disaggregate financial statement information.
Disaggregators and aggregators do not have significantly different effective bid-ask spreads. However, aggregators have a higher stock price than disaggregators. Controlling for denominator effects in the distribution of the effective bid-ask spread by including price as a control is important for the research design. Disaggregators have lower loan fees, though the difference is not significant at conventional levels. Disaggregators are also slightly (but not significantly) more likely to raise capital in the following year. The univariate tests do support my hypotheses, but any univariate results would have been tenuous. These tests do not control for other determinants of my proxies for information asymmetry or the endogenous choice to disaggregate
financial statement information.
4.2
Multivariate tests
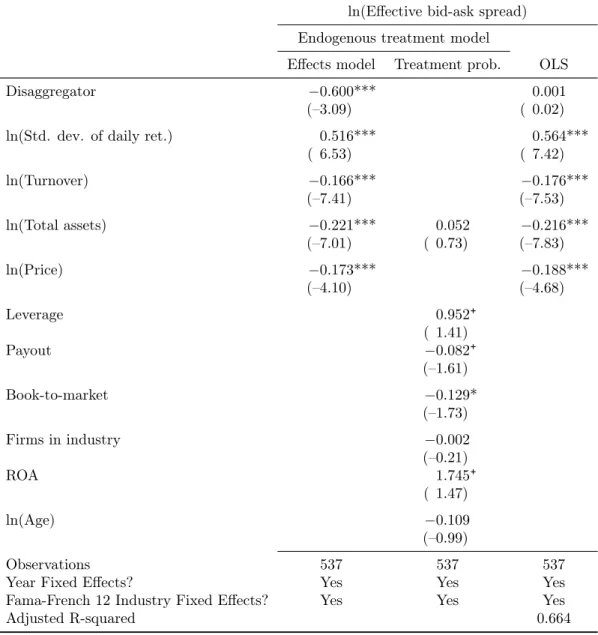
Table 8 presents the results of an ETM regression of the natural logarithm of the me-dian effective bid-ask spread in year 𝑡 + 1 on disaggregation and other determinants of the effective bid-ask spread in year 𝑡.4 The results of the ETM regression indicate
that the effective bid-ask spread is significantly lower for disaggregators. The control variables are highly significant and have the expected signs in the second-stage model. Consistent estimation of an ETM requires that the probability of treatment varies with covariates in the first-stage prediction model (Wooldridge, 2010, pp. 939–940). A subset of the excluded instruments is significantly related to the decision to disag-gregate. The results indicate that disaggregators have 45% lower5 effective bid-ask
spreads than aggregators.
The estimation of ETM regression hinges on the strength and validity of the in-struments (Puhani, 2000). Also, the results from two-stage estimates are inherently biased. Econometricians often suggest also presenting ordinary least squares (OLS) regressions as one way to help assess whether the choice of instruments is crucial to the results (e.g., Angrist and Pischke, 2009; Larcker and Rusticus, 2010). Therefore, I also present ordinary least squares (OLS) regression of the effect of disaggregation on the effective bid-ask spread. In the OLS regression, disaggregation has almost no effect on the effective bid-ask spread. OLS assumes exogenous rather than systematic assignment of disaggregation. If disaggregation does reduce information asymmetry, firms with the highest net benefits from disaggregation (i.e., firms that inherently have higher information asymmetry) endogenously choose to disaggregate financial statement information to reduce their level of information asymmetry to a low level.
4I use a more efficient full-information maximum likelihood (FIML) method to estimate the ETM
results rather than a limited-information maximum likelihood, or two-step, estimator that uses the inverse Mills ratio an additional explanatory variable in the second stage of the selection model. The two-step estimator imposes an implicit assumption on the distribution of the outcome but requires significantly less computing power to calculate relative to the FIML estimator. While the FIML estimator does not impose any assumptions on the data generating process, the estimator relatively sensitive to the exclusion restriction (Puhani, 2000).
Firms with inherently lower levels of information asymmetry have less to gain from disaggregation because they already have a low level of information asymmetry. A researcher observes that both types of firms have low levels of information asymmetry, but the reasons for this outcome are completely different. By ignoring the counter-factual level of information asymmetry before the endogenous choice to disaggregate, the OLS estimate of the effect may be biased toward zero. Given that both estimates may be biased, I place more weight on the results that ETM estimate which explicitly addresses the endogenous choice to disaggregate financial statement information.
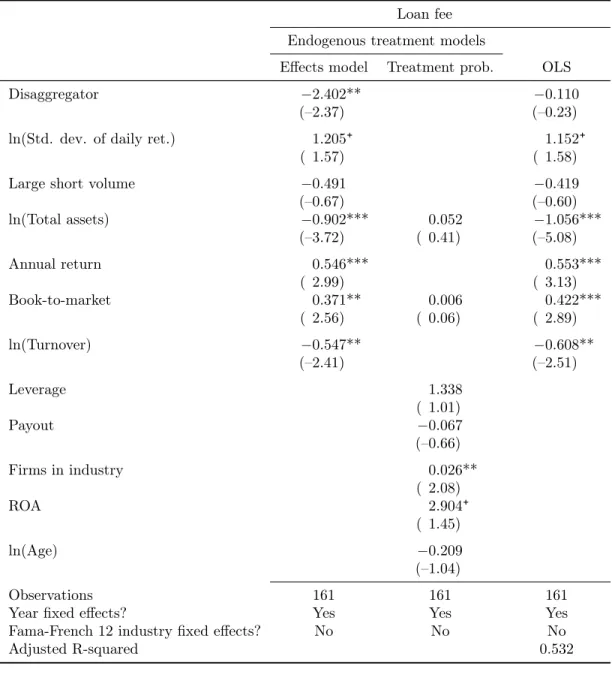
Table 9 presents the results of the ETM regression of the median loan fee in percentage points in year 𝑡 + 1 on disaggregation and other determinants of the loan fee in year 𝑡. After considering the endogenous disaggregation decision, the ETM estimate is significantly negative. The reduction in the loan fee is 72% of the mean loan fee.6 Short sellers must place a large weight on their private information in
order to initiate a short position. This indicates that sophisticated investors place significantly more weight on their private signals when the firm does not provide alternate signals of future cash flows. For comparison with the ETM results, I also present the OLS estimate of the effect of disaggregation. In the OLS regression, disaggregation has an insignificantly negative effect on the loan fee. While firms are unlikely to actively choose to lower the costs to short sellers, they may want to decrease the demand from short sellers (Lamont, 2004), which will reduce the cost of short selling. If firms that are more likely to interest short sellers choose to disaggregate to reduce short sellers’ demand, then short sellers’ demand, and the loan fee, will be low. If other firms have low short interest for other reasons and choose not to disaggregate, short sellers’ demand, and the loan fee, will also be low. Therefore, the OLS estimate may be biased toward zero.
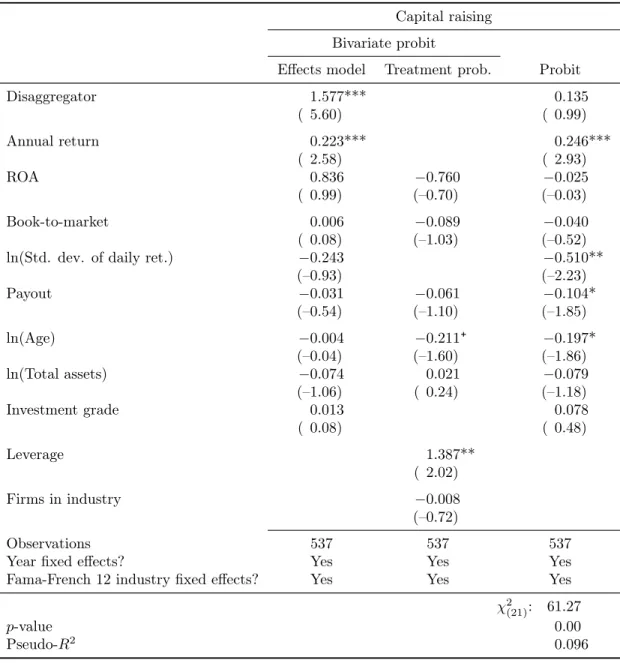
Table 10 presents the results of a bivariate probit regression of raising capital in year 𝑡 + 1 on disaggregation and other determinants of the probability of raising cap-ital in year 𝑡. Disaggregation significantly increases the probability of raising capial in the bivariate probit model. The marginal effect from the bivariate probit model
6This is calculated as 2.402
(calculated according to Nichols, 2011) indicates that disaggregation increases the probability of raising capital by 51 percentage points. Given that, at the sample mean for control variables, the probability of a disaggregator raising capital is 10%, an increase of this magnitude is quite large. There are two points that make such a large estimate more plausible. The first is that these are fairly basic disclosures. For example, disclosing depreciation expense and providing potential creditors with EBITDA will increase the probability of securing a loan by helping these investors es-timate what the cash flows available to repay the debt will be. Secondly, the difference between disaggregators and aggregators may be concentrated in the extremely low probability of raising capital for firms that switch from disaggregators to aggregators. The seven (sixteen) observations where firms decrease (increase) their level of disag-gregation greatly reduces the power of tests for the effects of these changes. However, the effect would be consistent with investors harshly punishing firms that deviate from the equilibrium sustained by the repeated game of annual financial reporting. The Folk Theorems could justify a sustained equilibrium, such as high-quality finan-cial reporting, in a repeated game where the game itself is a commitment device. A necessary condition for this equilibrium is that investors have a credible strategy to minimize the maximum payoff that the firm can achieve after deviating from equilib-rium. Locking firms out of the capital markets may be such a min-max strategy to punish firms that defect from the equilibrium level of disaggregation. The validity of the instruments is least plausible for this specification.
While the functional form of the probit model for the first stage can identify the effect (Wooldridge, 2010, pp. 939–940), the results of selection models are most fragile when there are no excluded instruments (Puhani, 2000). In the probit regression, disaggregation has an insignificantly positive effect on raising capital, though the magnitude of the 𝑡-statistic is much larger than those from the OLS estimate of the effect on the effective bid-ask spread and the loan fee. Not addressing the endogeneity of the disaggregation decision may bias the results if firms less likely to raise capital are the same firms to use disaggregation to reduce information asymmetry.
4.3
Robustness
Variations of the main tests
Bid-ask spreads during this period are quoted in eighths, making the absolute bid-ask spreads discontinuous. While scaling the discontinuous absolute bid-ask spread by price creates the continuous effective bid-ask spread, scaling also makes the effective bid-ask spread dependent on price (Callahan, Lee, and Yohn, 1997). The effect of information asymmetry on price is ambiguous (Akerlof, 1970; Harrison and Kreps, 1978) and potentially affects the estimated relation between disaggregation and the effective bid-ask spread. In addition, the significant difference in price between dis-aggregators and dis-aggregators in Table 7 makes price an important determinant of the difference in the effective bid-ask spread across disaggregators and aggregators. A way to remove the dependence on price is to estimate an endogenous treatment Poisson regression of the effect of disaggregation on the absolute bid-ask spread. The results of this estimation in Table 11 indicate that disaggregation significantly reduces the absolute bid-ask spread. Disaggregators’ bid-ask spread is 0.74 eighths7 or 9.23¢ lower
per share traded. While the magnitude of the reduction on a per-share-traded basis may seem small, it translates into a mean (median) savings of approximately $87,000 ($23,000) in the late 1920’s for a firm-year. These values are approximately 0.08% (0.08%) of the mean (median) firm’s market value of equity. The benefit in terms of the market value of equity is approximately half of the upper end of the effect of adopting International Financial Reporting Standards on liquidity that Christensen et al. (2013) find. The results from a Poisson regression, which does not rely on instruments to identify the effect, is negative and almost marginally significant (one-sided 𝑝-value: 0.11). The magnitude of the effect according to the Poisson estimate is 19% of the previous estimate,8 yielding a transaction cost savings of 1.5 basis points
of market value per year.
7This is calculated as 𝑒−1.340− 1 = −0.738
Additional tests
Chang, Cheng, and Yu (2007) use abnormal returns around the lifting of restrictions on short selling in the Hong Kong stock market to measure the extent of disagreement about prices while the constraints on short sales were binding. While there were no formal restrictions on short selling in my setting, adding a stock to the Loan Crowd list essentially reduced the search costs for short sellers to zero and eliminating a key barrier to shorting a stock (Lamont, 2004). If short sellers did not have a ready private supply of shares to borrow before the stock was added to the short sale list, aggregators should be more likely to join the Loan Crowd list and have lower returns than disaggregators because there is more disagreement in price stemming from the higher level of information asymmetry around disaggregators. Further, additions to the Loan Crowd list were based on increases in short sellers’ demand rather than firms’ choices (Jones and Lamont, 2002), making the additions more clearly exogenous events.
Table 12 shows the frequency of additions to the Loan Crowd list by date and disaggregation cluster. As Jones and Lamont (2002) note, stocks join the Loan Crowd list in waves. From February to April 1926, almost as many stock joined the list each month as joined the list during all of 1927. This clustering in additions leads Jones and Lamont to speculate that firm-specific factors are not significant determinants of joining the list. The composition of the additions in terms of disaggregation is not significantly different from the composition of my full sample. However, the full sample overweights firms that appear on the short sale list at some point. The full sample may not be a good benchmark against which to compare the disaggregation decisions of firms added to the Loan Crowd list. The subsample of firms that never appear on the Loan Crowd list are a more plausible sample against which to compare the additions since additions, by definition, are not on the Loan Crowd list. The number of additions that disaggregate financial statement information is different from the subsample of firms that never appear on the Loan Crowd list, and the difference is marginally significant.