CONTRIBUTION TO THE STUDY OF
TENSION PLES
UNDER CYCLIC LOADING
by
ALAIN MARCEL GOULOIS
Dipl. Ing., Ecole Centae de (1976)
Pacis
M.S., UniveQuity o Wisconsin - Madison (1976)
Submitted to the Depatment
of
Civit Engineeing
in Patia FuR4itment o the Requitement o the DegeeQ o
Doctot oa Phitoaophy
at the
Masachusett
Intitute
of Technotogy
Decembe 19g2.
Q
Aain M. Gouois, 1982The author hereby gcrants to M.I.T. pe ni Ion to epoduce and
to distibute copies od th th document in whoe ot in part.
I i
Dep'XO
pnt
od
Civi
Engineeuing, December 1982.
- AI
/I
. ]I
Cetiied by
R. V. Whittman, Thesis SupewviuoL. Accepted by
F.
Moe,M
, V Depatmen
te
Committee.
OF TECHNOLOY
_;
D
F
(:Q
1
(.
ArchiveS
LIBRARIES
Signatue oa Athot
-CONTRIBUTION TO THE STUDY OF
TENSION PILES
UNDER CYCLIC LOADING
by
Alain Marcel Goulois
Submitted to the Department of Civil Engineering on December 13, 1982 in partial fulfillment of the requirements for the Degree of Doctor of Philosophy
ABSTRACT
This thesis focuses on the study of a single tension pile embedded in clay and subjected to undrained cyclic loading conditions of the type experienced by Tension Leg Platform foundations during a storm. The proposed methodology makes possible the following of the soil-pile contact degradation and the
estimation of the resulting redistributions of stresses and strains occuring during the passage of the storm as well as the vertical displacements of the foundation.
Three stages are distinguished. First a theoretical study of the cyclic behavior of a class of elasto-plastic models (Iwan models) used to represent
the pile and the soil is presented. Then the effects of average stresses on the cyclic behavior of Plastic Drammen Clay are discussed. The results of 12 constant volume stress-controlled direct simple shear (DSS) tests are used to introduce a new format of presentation allowing for easy interpolations and extrapolations of the data over a wide range of stresses. Finally the
development of the computer code TLPILE is detailed. It integrates the
mechanical model and the soil degradation data into an analytical tool leading to estimates of the cyclic behavior of tension piles which are in general agreement with experimental evidence. Parametric studies reveal the benefits from having a stiff pile, and suggest that present regulations are adequate for the particular configurations and soil studied.
Thesis Supervisor : R.V. Whitman
a
Dominique,
Cazos,
Falix,
Adriano,Maie-Ag
ne,
Steve,Suzanne,
Jano,
Batbarta,
Colette,
Caie,
Phcppe,
PauL, Piheoto, Patice,David,
Haan,
John,
Hugo, Martthe,Aziz,
^Miche,
Jean-Pietre,
RSmi,Syvie,
EZicabeth,
Atbert, Guy, Cudine, Victor, ChLstiane, Piere, Anne,Simone,
Judy,
Andtee,
Rotand,
inotu,
Mac,
Gouiche,
Sandine,
Ametine,
Yogi,Bobby,
Adee,
Seag e,
Georgette,
Jean-Jacques,
Nicoe,
Waidemat,
IsabeeLe,
Nicola s,Betnatd,
Madeeine,
tHene, Lu,Samih,
Maurice,
Jean,
Syevianne,
Michaet,Yve,
Miguel, Marce,Franco,
Huguette,
Chantat,
Staney,
Ctaude,
Maie, Mavtceee,Joe,
Odette,
Pedro,
Renee, Geaorgn, Atain,Ghilaine,
Alike,Katin,
Rog t,Atin,
Matine,Alfredo,
Jean- Luc,ichel,
Chstin.te,
Pattick,
ejane, Lucien,Francia,
ACKNOWLEDGMENTS.
The athor wishes to
express
hi deepest appreciation to the
Societe
Nationaie
E
Aquitaine
ot
zuggezting
and
ponsoing
this reeatch
in
an
ideal
atnosphere oa tust.
He
is
paAticuAy
thankdut to
Mr.
Caude Cochard, M. Reynad Bonmati,
and M.
Chrles
Vernet
fot
theit conztat
uppot.
ProeSsot
Robet
V. Whitman
has
advised
the
athor
throughout
his woth.
His
acute engineering judgment and the hatLpne4 of
his comment6 have been invauabZe, as was his human support in
diiicut
moment.
Ptroezosm
ChaZees
C.
Ladd and
Amtr
S. Azzouz
have
provided
continuous guidance
a
membes o the doctora2
committee.
The author
is
vey
grateu or
theiA
assistance
and thei avaiabtlty in time o heavy ptosiona2
commitment.
Dr%. Kaate Hoeg and his coeegue oad the Norwegian Geotechnicai
InstLtte,
and epeciay
Suzanne Lacase, Knut Andersen and
KjeeZ Ka.Rxirud,
have
activey contributed
to
thki the
4iz
which
was
tuy
in&ktted white the author was a Feleow at N.G.I..
Thei
uppot
has
been
autes,
as was their
tienship,
and the
testing
pogam woud neveL have
been teatized
without
them.
Joe
Gozz, Steve HaZe, Mike Motison
and Yogi have temendousZy
heZped the author in the p
ese
ntation of
ths
th
thesis
despite
the consideabe obstaclez ceated by gatdicism and handwiting.
But
the tue
bden
o
this
work
rested on the houtde
od
Dominique
who
has
made it ai
pos.ibZe.
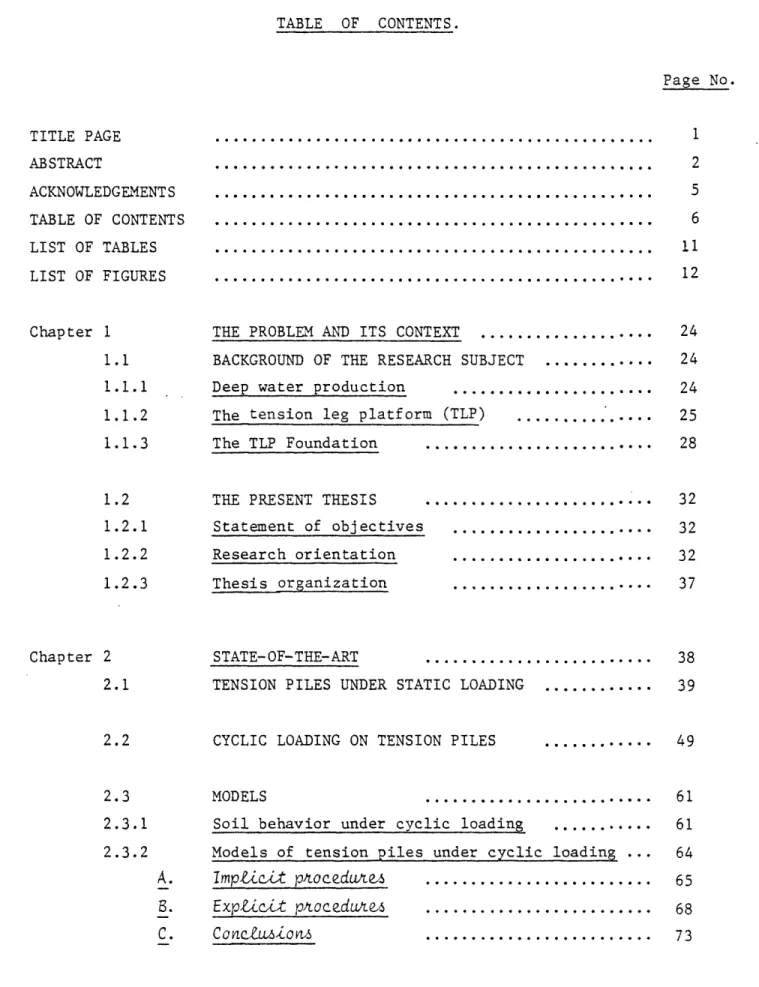
TABLE OF CONTENTS. Page No. TITLE PAGE ... ABSTRACT ... ACKNOWLEDGEMENTS ... TABLE OF CONTENTS ... LIST OF TABLES ... LIST OF FIGURES ...
Chapter 1 THE PROBLEM AND ITS CONTEXT ...
1.1 BACKGROUND OF THE RESEARCH SUBJECT ... 1.1.1 Deep water production ... 1.1.2 The tension leg platform (TLP) ... 1.1.3 The TLP Foundation ...
1.2 1.2.1 1.2.2 1.2.3
THE PRESENT THESIS Statement of objectives Research orientation Thesis organization Chapter 2 2.1 2.2 2.3 2.3.1 2.3.2 STATE-OF-THE-ART
TENSION PILES UNDER STATIC LOADING
CYCLIC LOADING ON TENSION PILES
MODELS ...
Soil behavior under cyclic loading ... Models of tension piles under cyclic loading ...
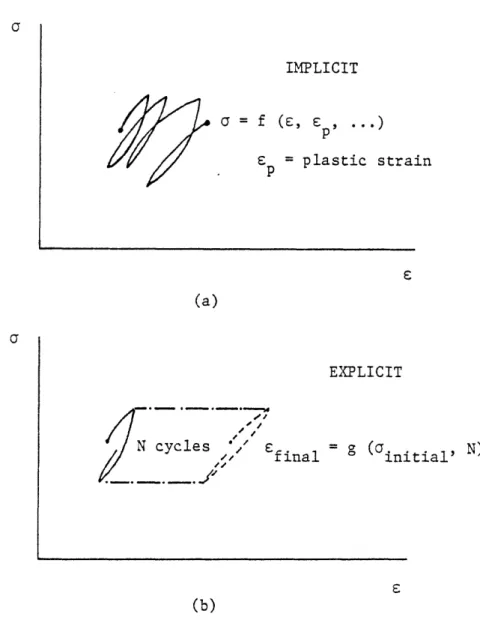
A. Imptict
ptocedue
...
B. Explicit pocedures ... C. CancZuzions ... 1 2 5 6 11 12 24 24 24 25 28 32 32 32 37 38 39 49 61 61 64 65 68 73...
...
...
...
. . . . . . . .. .. . .Chapter 3 THE PILE MODEL ... 74
3.1 FUNCTION OF THE PILE MODEL ... 74
3.2 FIRST DESCRIPTION OF THE PILE MODEL ... 78
3.3 BEHAVIOR OF THE PILE MODEL UNDER CYCLIC LOADING .. 81
3.3.1 An introductory example ... . 81
3.3.2 Masing's rules and Iwan models ... 87
3.3.3 Properties of Iwan models ... 88
A. The Ptandtt body ... 92
B. The geneAaized P-body and the in~Unte P-body .. 96
C. Iwan modez and Random aembLiez ... 106
D. A physical analog to wan modeL ... 107
E. A ew extension o PeAoz's etults ... 111
3.3.4 Shakedown analysis ... 118
A. Meean' s theorem ... 119
B. A 4imple pie model ... 123
3.4 BACK TO THE DESCRIPTION OF THE PILE MODEL ... 126
Chapter 4 CONTRIBUTION OF AVERAGE SHEAR STRESSES TO THE CYCLIC DEGRADATION OF CLAY ... 135
4.1 BACKGROUND ... 135
4.2 TEST CONDITIONS ... 148
4.2.1 Equipment ... 148
A. The SS appa ... 148
B. The height contto mechanism ... .. 150
C. The data acquizition yztem ... 150
4.2.2 Clay and specimen ... 152
Chapter 4.2.3.A. B. C. 4.3 4.4 4.4.4.1 4.4.2 4.4.3 4.5 4.5.1 4.5.2 4.6 Consotidation ...
Drtained hea and creep ...
Cycic loading ...
RESULTS OF THE CYCLIC TESTING
SYNTHESIS OF THE RESULTS ... Iso- and isiso-y ve networks ... Degradation of the iso-y network ... Degradation of the iso-y network ...
a
cve---COMMENTS AND INTERPRETATIONS ... Shape of the strain contour diagrams
A. The iAst cycle oa loading ...
B. Ater the A t cycle ...
Interpretations of the variable cyclic tests
A. Andesen'4 procedwue ... B. Extension to v # 0 ... C7'Je. SUMMARY Chapter 5 5.1
TLPILE : THE ANALYTICAL TOOL MODIFICATION OF THE SOIL-PILE
216 216
....AMETERS...
PARAMETERS
...
NUMERICAL ASPECTS OF THE PILE MODEL
SOIL DEGRADATION DATA BASE ....
ORGANISATION OF TLPILE AND ITERATION SCHEME
Page No. 155 155 156 158 173 174 186 187 198 198 198 207 208 208 211 215 5.2 5.3 5.4 223 230 . . .. . . . .. . . . .. . . . .. . . . . . .. . . . .. . .... 237
LE
Page No.
EXAMPLES OF APPLICATION OF TLPI Presentation of the examples The basic example
A. Dciption o the input
B. Static toadinqs
C. Cyctic oadnqg
Variations around the ba,
A.
A
geomettic
patamteu
a) Thicknes b)
DiameteT
c)
Choice o tempate
B. SaAety patametes Conclusions . . . e ·. . . . sic exa sic exa! 244...
244
...
249
...
249
...
249
...
252
mple ... 257...
257
·
·...
.257
·
·...
.260
...
263
...
265
...
267
Chapter 6 6.1 6.1.1 6.1.2 A. B. C. 6.2SUMMARY, CONCLUSIONS AND RECOMMENDATIONS ...
SUMMARY
...
Recapitulation of objectives ... Contributions ...
The Pe. Modes ...
The soai degradation data ...
TLPILE ...
CONCLUSIONS AND RECO~MMENDATIONS ...
References Appendix 3 3.A 3.B SHAKEDOWN ANALYSIS INTRODUCTION SHAKEDOWN ANALYSIS 5.5 5.5.1 5.52. 5.5.3 5.5.4 270 270 270 270 271 272 273 276 283 291 291 294 . . . . . . . . . . . . . . . . . . . . . . . . . . . .. .. .. .. . . . . -- - - - I . 0 . . . . !, . . . . . .. .. .. .. .. .. .. .. .. .. .. ..
3.B.1 3.B.2 3.B.3 3.C 3.C.1 3.C.2 3.C.3 Appendix 4 4.A 4.B 4.C 4.D 4.E Appendix 5 5.A 5.B 5.C Background ... Terminology ... Theorems ... EXAMPLES OF APPLICATION OF SHAKEDOWN ANALYSIS . Presentation of the examples ... No separation : the "pile foundation" case .... Separation : the superficial foundation case ..
COMPLEMENTARY EXPERIMENTAL RESULTS ... GENERAL DATA ... PREPARATION AND INDEX PROPERTIES... CONSOLIDATION, SHEAR AND CREEP ... CYCLIC LOADING ... COMPARISON OF TESTS G AND O ...
LISTINGS OF COMPUTER PROGRAMS AND DATA FILE ... SUBROUTINE CYCDEG ... PROGRAM TLPILE ... DATA FILE FOR EXAMPLE /1/ ...
Page No. 294 299 303 309 309 311 321 329 329 332 338 345 358 363 363 372 396
LIST OF TABLES
Title
Mathematical models for symmetric loading
Origin of the clay
Summary of test conditions ...
Essential test parameters at all stages
of loading ...
Shear stresses applied
Definition of examples
Various definitions of the ultimate capacities and factors of safety ...
Summary Table No. 3.3.1 4.2.1 4.2.2 4.3.1 4.3.2 5.5.1 5.5.2 Page No. 90 152 157 160 161 248 267 275 6.1.1
LIST OF FIGURES.
Fig. No. Title Page No.
1.1.1 Tension leg platform for Hutton field . . ... 27
1.2.1 Schematic of the force applied to the top
of the foundation ... 33
1.2.2 Shear stresses during cycling ... 34
2.1.1 Measured versus calculated ultimate
capacities in tension ... 41
2.1.2 Correlation of ultimate friction capacities
in tension and in compression ... 43
2.1.3 Sustained tension loading - history of the
pile top displacement (131) ... 46
2.1.4 French recommendations for the testing of piles .... 47
2.1.5 Plancodt tension pile : load-deflection curves and creep-curves from static tests S2 and S3.
Determination of the creep load. (After Puech and
Jezequel 1891) ... 48
2.2.1 Load Displacement response under cyclic loading
-Empire test site. (After Kraft et al. 1561) ... 51
2.2.2 a) Types of loadings applied to the Plancoet pile. b) Time history of the pile top displacement during
test C21.
c) Load distributions in the pile during test C21.
LIST OF FIGURES (Continued)
Title Page No.
a) Time history of the pile top during test C12.
b) Time history of the pile top during test Cll.
c) Time history of the pile top during test T2. (After Puech
Comparison of static and cyclic Plancoet Pile ... displacement displacement displacement 1861) ... 53 creep loads -...e.. ... e 55
Comparison of time histories of top pile displacements at Cran and at Plancoet.
(After Puech 1871) ... 55
Cyclic loading applied to the pile head.
(After McAnoy et al. 1701) ... 57
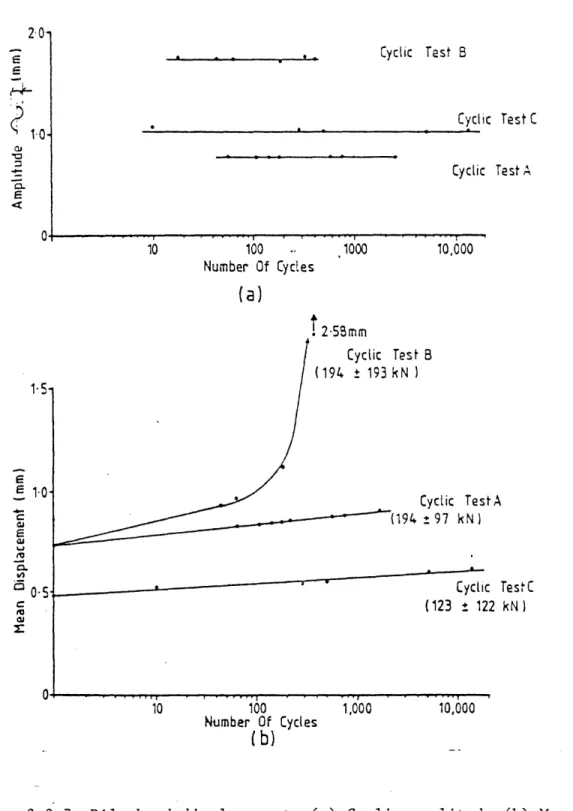
Pile head displacements (a) cyclic amplitude (b) mean. (After McAnoy et al. 1701) ...
Load distributions. (After McAnoy et al. 1701)
Schematics of implicit and explicit treatments of cyclic degradation ...
Explicit scheme
Loading at pile top
58 .... 59 62 75 75 3.2.1 Pile Model Fig. No. 2.2.3 2.2.4 2.2.5 2.2.6 2.2.7 2.2.8 2.3.1 3.1.1 3.1.2 79
LIST OF FIGURES (Continued)
Title
A simple Iwan Model
Introductory example,
Introductory example,
Extended Masing Rules
first loading curve
successive loadings
Decomposition in series and parallel of an Iwan Model ...
Riener's rheological tree ...
Typical St Venant body stress-strain diagram ....
An unacceptable Hooke body stress-strain diagram ..
Schematic of the Prandtl body
First deformation curve ...
Geometrical interpretation of Equation 3.2 ...
Unloading from the first deformation curve ...
Slope discontinuity at A ...
Stabilization to a closed loop ...
Example of stabilization under regular cyclic
loading ... Fig. No. 3.3.1 3.3.2 3.3.3 Page No. 82 3.3.4 84 3.3.5 85 3.3.6 89 91 92 93 3.3.7 3.3.8 3.3.9 3.3.10 3.3.11 3.3.12 3.3.13 3.3.14 3.3.15 94 95 95 97 99 102 103 105
LIST OF FIGURES (Continued)
Title
A physical analog to a P-body
Physical analog of a generalized P-body ...
Example of stabilization under regular cyclic loading ...
Analog of an asymmetric P-body
Page No.
108
110
112
113
Construction of the asymmetric first deformation curves ...
Cyclic responses of an elasto plastic element
Graphical decomposition of the stress
Changes of stresses
Simple pile model ...
Recap of the results of the pile example ...
"t-z" curves. (From Ref. 1221) ...
Stress strain relationships for DSS specimen at several distances away from the pile corresponding to pile loading conditions. (Private communication from Kavvadas) ... Construction of "t-z" curve Fig. No. 3.3.16 3.3.17 3.3.18 3.3.19 3.3.20 3.3.21 3.3.22 3.3.23 3.3.24 3.3.25 3.4.1 3.4.2 115 119 121 122 123 125 126 129 131 3.4.3
LIST OF FIGURES (Continued)
Title
Algorithm used in the decomposition in Prandtl bodies ...
Update of Figure 3.1.1 ...
Rigid pile in uniform NC clay exhibiting normalized behavior T = T ...
ave cons
Combinations of T
ave and Tc causing failure
Combinations of T and T causing different
ave c
strains - Vicksburg silty clay ...
Loading patterns ...
Cyclic strength contours
Optimum resistance value of ... ave
Shear loading and notations
Test stress range
The experimental set up
Description of profile for Danviksgt.50301, Drammen. (After N.G.I.) ... Loading schedule Fig.. No. 3.4.4 Page No. 3.4.5 4.1.1 132 4.1.2 4.1.3 133 136 138 4.1.4 4.1.5 4.1.6 4.1.7 4.1.8 4.2.1 4.2.2 140 140 142 143 145 146 149 151 154 4.2.3
LIST OF FIGURES (Continued)
Title Page No.
Pulse shape ...
Relative positioning of the tests and summary of results ...
Results of tests
Q
,
,
and©
Results of tests and ®Results of tests and ®
Results of tests
®
and@
Results of test ® ...
Results of test ...
Comparison between test
®
and segments of tests® and
...
Degradation of the cyclic shear modulus
Andersen's results 1 21
a) Section of iso-yc network at N = 50 cycles ... b) Section of iso-yave network at N = 50 cycles ...
a) Section of iso-yc network at N = 100 cycles ... b) Section of iso-yavavee network at N = 100 cycles ..
Fig. No. 4.2.4 4.3.1 4.3.2 156 159 · ~... .165 4.3.3 4.3.4 4.3.5 4.3.6 4.3.7 4.3.8 166 167 168 169 170 171 · ·... .172 175 176 177 178 179 4.3.9 4.4.1 4.4.2 4.4.3
LIST OF FIGURES (Continued)
Title Page No.
a) Section b) Section a) Section b) Section a) Section b) Section of iso-yc network at N C of iso-y network at ave of iso-ye network at N of iso-y network at ave of iso-y network at N of iso-y network at ave = 200 cycles .... N = 200 cycles ... = 500 cycles .... N = 500 cycles ... = 1000 cycles .... N = 1000 cycles ..
a) Sections of iso-yc surface for yc = 0.15 %
at various numbers of cycles ... b) Sections of iso-yc surface for yc =0.25 %
at various numbers of cycles ... c) Sections of iso-yc surface for yc = 0.5 %
at various numbers of cycles ...
a) Sections of iso-yave surface for ave = 2.5 % at various numbers of cycles ... b) Sections of isO-yave surface for ave = 3 %
at various numbers of cycles ... c) Sections of iso-yave surface for ave = 4 %
at various numbers of cycles ... d) Sections of iso-yave surface for yav = 6 %
at various numbers of cycles ...
a) Sections of the iso-yc network at N = 100
and N = 1000 ... b) Sections of the iso-yave network at N = 100
and N = 1000 ... 4.4.4 4.4.5 4.4.6 180 181 182 183 184 185 4.4.7 4.4.8 4.4.9 188 189 190 191 192 193 194 195 196
LIST OF FIGURES (Continued)
Title Page No.
a) Effective stress paths for undrained static simple shear tests. (After Andersen 12 ) .... b) Stress-strain curves for undrained static
DSS tests ...
Stress strain relationships for plastic Drammen clay ...
Undrained DSS on Lierstranda quick clay with consolidation under T cons 0. (After Bjerrum
cons
and Kenney 11il) ...
Use of asymmetric P-bodies to model effect of
consolidation under T ... cons
Estimation of y
ave at N = 1
Comparison of iso-yave networks ...
Andersen's procedure ...
Use of data base in Andersen's procedure
Prediction of test Andersen's procedure
with fit on ave ... ave
4.5.10 Prediction of test
with fit on yave ave
(O Andersen's procedure
· ., ee . e ee · · eeeeeeeee e . eee .e. e 214
4.5.1 4.5.2 4.5.3 200 200 201 202 4.5.4 4.5.5 4.5.6 203 205 4.5.7 4.5.8 4.5.9 206 209 210 213
LIST OF FIGURES (Continued)
Fig. No. Title Page No.
5.1.1 a) Storm loading on Illite (T = 0). av e
b) Storm loading on Bentonite ( = 0) ... 218 ave
5.1.2 Andersen's procedure. Use of the N = I curve 219
5.1.3 a) Static loading after cycling. (After Andersen 12 ).
b) Construction of stress-strain relationships
after cycling ... 220
5.1.4 Modification of the stress-strain relationship
with cycling ... 222
5.1.5 Artifice used to impose the permanent displacement
to the "fixed" reference 222
5.2.1 a) P-body and the equivalent linear force and internal forces.
b) Stress-strain diagram explaining the
equivalence ... 223
5.2.2 Relative position of the result of the elastic solution with respect to the starting and
yield points ... 224
5.2.3 Example of determination of the next P-body to yield . 225
5.2.4 Global numbering and global stiffness matrix .226
226 Flow chart of Pile Model computations
LIST OF FIGURES (Continued)
Title
Numerical check of the behavior of the Pile Model subjected to a loading similar to the one of
Figure 3.3.15 ... a) Section of iso-yc (Estimated) ... b) Section of iso-yc (Estimated) ... a) Discretization of b) Discretization f network at N = 5000 cycles network at N = 5000 cy cles ... network at N = 5000 cycles iso-y network at N = 100 iso-y network at N = 100 ave Partial axisymmetric network ...
view of the iso-y
ave = 4%
Simplified flow-chart of subroutine CYCDEG ...
Iteration scheme ...
Basic variables used in TLPILE (1) ...
Basic variables used in TLPILE (2) ...
Flow chart of TLPILE ...
Force displacement curve to failure, basic example ...
a) Force distribution in pile, static loading
b) Shear stress distribution on pile static loading .. Fig. No. 5.2.6 Page No. 228 5.3.1 5.3.2 231 232 233 234 235 5.3.3 5.3.4 5.4.1 5.4.2 5.4.3 5.4.4 5.5.1 5.5.2 236 239 241 242 243 250 251
LIST OF FIGURES (Continued)
Fig. No. Title Page No.
5.5.3 a) Force-displacement at pile top, example /1/.
b) History of displacement at pile top, example /17 ... 254
5.5.4 a) Force distribution in pile, example /1/, lower load level.
b) Shear stress.distribution on pile, example /1/,
lower load level ... 255
5.5.5 a) Force distribution in pile, example /1/, upper load level.
b) Shear stress distribution on pile, example /1/,
upper load level ... 256
5.5.6 a) Force-displacement at pile top, example /5/ uniform wall thickness of 3".
b) History of displacement at pile top, example /5/
uniform wall thickness of 3" ... 258
5.5.7 a) Shear stress distribution in pile, example /1/ uniform wall thickness of 2".
b) Shear stress distribution in pile, example /5/
uniform wall thickness of 3" ... 259
5.5.8 a) Force-displacement at top, example /6/ pile diameter 48".
b) History of displacement at pile top, example /6/
pile diameter 48" ... 261
5.5.9 a) Force distribution in pile, example /6/ pile diameter 48".
LIST OF FIGURES (Continued)
Fig. No. Title Page No.
5.5.9 b) Shear stress distribution on pile, example /6/
pile diameter 48" ... 262
5.5.10 a) Force-displacement at top, example /3/ 12-pile template
b) History of displacement at pile top, example /3/
12-pile template ... 264
5.5.11 Force displacement relationships and histories of the displacement at the pile top for various values
of the factor of safety F.S ... 266
5.5.12 Permanent displacement versus factor of safety F.S. .. 268
6.2.1 Potential domains of application of soil degradation
1 THE PROBLEM AND ITS CONTEXT
The Tension Leg Platform is certainly one of the favorite topics in
the offshore industry today because it might be the best option to produce
oil in deep waters*...
1.1 BACKGROUND OF THE RESEARCH SUBJECT
Most of the major oil companies have been involved for several years
now in the preliminary engineering of the Tension Leg Platform (TLP). What
are their motivations ? What exactly is a TLP ? And what type of problems
will the geotechnical engineer be faced with ? Such are some of the key
questions we should first consider.
1.1.1 Deep water production
Deep water discoveries of oil and gas have been made over the last
years, the presence of which cannot be ignored in today's energy-avid
society. Exploration techniques are now very well mastered to water depths
of some 3 000 feet and the first drilling by 6 000 feet of water is seriously
envisioned. New leases of blocks in deep water are made in large number
every year. In the United States the government, which had been until now
limiting these leases to some parts of Southern California, the Gulf of
* The term"deep" waters is very much dependent on the environmental conditions ; in the Gulf of Mexico it could be depths greater than 1000 ft, while in the North Sea "deep" water would start around 650 ft.
Mexico and some East cost areas, has recently announced its intention to
issue exploration permits along the entire coast line. And this trend
is not limited to the US ; Norway has discovered major reservoirs by deep
waters and important new fields are thought to exist in Easter Canada,
Western Australia, in the Mediterranean sea, etc ...
The very difficult environment associated with large water depths
has required the development of totally new concepts in parallel with
extensions of the traditionnal jacket supports. But, as water depth
in-creases, the cost of the latter becomes prohibitive and their dynamic
behav-ior becomes problematic (their natural frequencies approaching the peak of
the sea wave spectrum), leaving the whole field open for innovation.
One way to minimize the impact of environmental loading is to use
compliant structures (the natural frequencies of which will be much smaller
than the peak of the sea wave spectrum). Four main concepts are presently
considered : semi-submersibles with catenary mooring, guyed towers,
articu-lated towers and tension leg platforms. Discussions of the pros and cons
of each concept can be found for example in Huslid et al., 1982 1471. At
the present time, feasibility studies have a tendency to favor the TLP over
the others and this explains the tremendous interest shown by the industry
for this new concept, which will now be described in some detail.
1.1.2 The Tension Leg Platform (TLP)
The tension leg platform has best been described by CONOCO engineers
as "a huge upside-down pendulum, with buoyancy replacing gravity"*. The
* "Hutton's TLP-CONOCO Reveals The Shape of Thing To Come", Offshore Engineer, Feb. 1980.
Tension Leg Platform is composed of two parts : a floating structure and
an anchorage system of vertical "legs" attached to the sea bed. These legs
are always in tension - even in the worst environment conditions - and
insure that the buoyancy of the platform is always in excess of its
displace-ment*. As a direct consequence the structure will have a very high vertical
rigidity, and essentially no heave motion. One such structure is represented
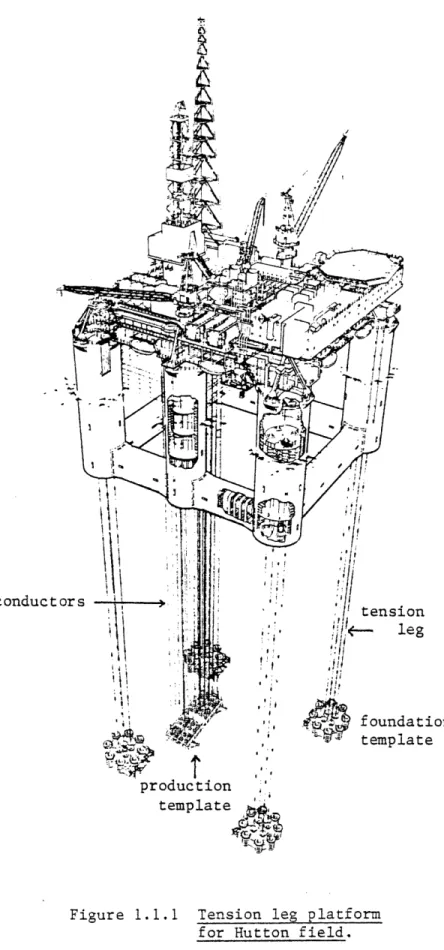
in Figure 1.1.1 : it is the first production TLP to be constructed and will
be installed on the Hutton field in the Northern North Sea in 1983 by CONOCO**.
This figure clearly shows the groups of legs positioned at the four corners
of the deck. There are four legs per corner connecting to the same
founda-tion template, and therefore a total of 16 legs for the entire structure.
The network of conductors visible in the center part of the structure, in
between the deck and the production template, corresponds to the production
risers and the injection lines. This network is itself maintained in constant
tension, which is one of the key advantages of the TLP as it minimizes fatigue
in the risers, eliminates the need for large heave compensators, and permits
the installation of the well heads on the deck. Other advantages of the TLP
concept include :
· a very limited sensitivity to water depth,
. the fact that it is an"early production system", - wells can be
predrilled before the installation of the structure and be producing
immediately after installation, which is very rapid since the whole
* Weight of the water displaced by the structure.
** See "Evolution of the Tension Leg Platform Technology" by J.A. Mercier
production ,
template
Figure 1.1.1 Tension leg platform for Hutton field. conduct
floating structure can be towed to the site fully equipped, - and
the foundation templates can be preinstalled
-that it is operational 90 % of the time,
and that it can be salvaged at the end of production.
There are also problems associated with this new concept. The behavior
of the risers and of the tension members under hydrodynamic conditions and
fatigue is certainly the most complex of these issues. In the design stage
the structure is also quite sensitive to weight, but it is the foundation
problem which will mostly draw our attention. This is a situation where the
foundation becomes a major issue affecting the feasibility of an offshore
project as a whole*.
1.1.3 The TLP Foundation
What type of loading will the Hutton TLP apply to its foundations ?
The newest information (Mercier 1741) indicates, per foundation template** :
. a mean load, due to pretension, of 3 550 tonnes***.
. a maximum load of 8 700 tonnes,
· and a minimum of = 0 tonne.
The actual foundation design calls for 8 piles per foundation template
(0
72 in, driven 60 m and grouted to the template sleeves). The horizontalforces should remain less than 10 % of these vertical forces and at this
level are not considered to present a significant problem.
* This situation can be compared with the design of the Ekofisk reservoir, the first gravity structure in the North Sea.
** The weight of the legs has been considered, but not the weight of the foundation template itself. These loads are deduced from loads at the surface.
The very nature of this loading has proved to be a psychological
handicap. Quite naturally designers have started worrying about the
behavior of the foundation with relation to its ability to withstand
"108 load reversals during its 20 year design life", about creep, about
possible large permanent displacements under extreme loading conditions,
about "pullout" etc ... All concerns which can be associated to the
"nail-out-of-the-wall" syndrome. The technical press has also given a large echo
to this wide-spread preoccupation :
"... Cyclic loading superimposed on the static pretension load of TLPs represents one of the most complex and challenging areas for geotech-nical research and development. Cyclic loading may have a detrimental effect on the side friction of tension piles. Elastic elongation of the pile under cyclic loading leads to two-way cyclic loading and heavy degradation of strength along the upper part of the pile, and further down the pile one-way cycling may tend to increase creep velocity...".
(Petroleum Engineer, May 1982)*
"... A major influence in the overall feasibility of the TLP concept is how the seabed soil around anchor piles would perform under cyclic loading
in tension...". (Offshore Engineer, Feb. 1980)**
One may wonder why only piles have been mentioned as potential
solutions. Gravity foundations have also been considered : in such systems
* "Deep Water Operations Demand Safe, Stable Anchoring" by Olsen O.A. et al.
large masses in the foundation templates insure a total security against
the fatigue effects previously mentioned. It provides a good example of the
"change of statistical universe" advocated by De Mello in his Rankine Lecture
1731. It is also presents the advantage of having a better understood
behavior.
However the gravity option presentsmajor disadvantages. The installation
of gravity templates in large water depths and with tolerances* of a few
inches on the positioning is a fantastic task. The necessary support vessels,
cranes, etc... represent an enormous mobilization cost and new techniques
would have to be tested. There are two more good reasons for the lack of
enthusiasm of the industry : first, piles are a proven technique and offshore
civil engineering is conservative, and secondly the "drillers" have total
priority, and they don't like the idea of having these monstrous templates
restricting the area available around the wells.
The final choice is however a question of economics and of course of
site conditions.
"... Both gravity and piled anchorage schemes provide viable solutions technically and economically... However it has been confirmed that a pile solution offers the more versatile
system to suit a larger range of field situations**..."t
* The levelness of the set of the four templates is a key requirement as well as their relative positioning. Mercier, during the discussion of his paper
1741, has talked of "a distance between diagonals equal to within 1.5 meters". ** Perret G.R. and Webb R.M., OCT 3881, p. 264, 1980 "Tethered Buoyant Platform
As a matter of fact more and more engineers are thinking today of
using hybrid solutions which will include both piles and gravity.
Let us now see how this thesis will attempt to contribute to our
1.2 THE PRESENT THESIS
1.2.1 Statement of objectives
In an effort to improve our understanding of the basic behavior of a
TLP pile foundation during the passage of a storm, this work has focused on
the study of a single tension pile embedded in clay and subjected to
undrained cyclic loading conditions.
The objective of the research is to contribute to the development of
methodology that will ultimately allow us to follow the evolution of the
pile-soil contact degradation and to estimate the redistributions of stresses
and strains occurring during the storm as well as the resulting displacements
of the foundation.
1.2.2 Research orientation
As a matter of introduction to the present thesis it may be useful to
present the logic of the research with simple ideas based on plain engineering
judgment.
Whereas the pile-soil system is a very complex one, the examination
of the problem at-hand reveals a comparatively simple pattern of loading.
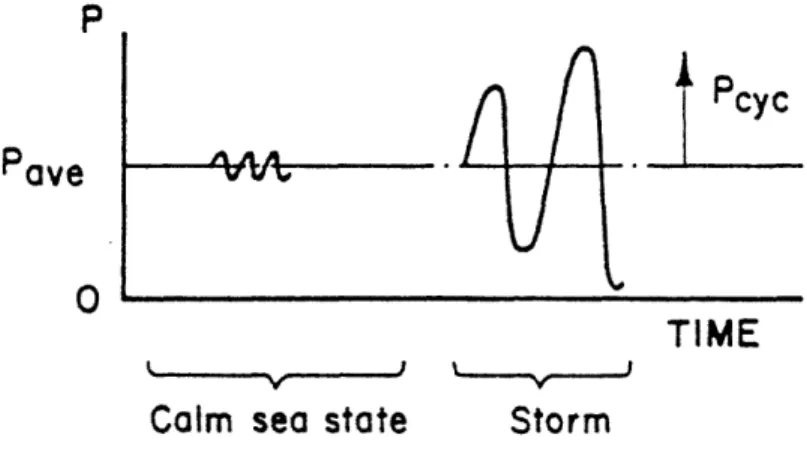
The external force, P, applied to the top of the foundation is not only in
permanent tension but it is also characterized by fluctuations, P cyc, imposed
by the sea state around a mean value, Pave' which can be, in a first
Pave
r Ipcyc
i
-TIME
Calm sea state Storm
Figure 1.2.1 Schematic of the force applied to the top of the foundation.
Consequently the overall system is force-controlled, and it seems thus
logical to envision the analysis of the local pile-soil behavior from a
stress-controlled point of view. Intuitively it is apparent that the value
of
Pave,
as compared with the pile ultimate capacity, may have a critical impact on the overall behavior of the foundation. A given value of P canbe associated with various shear stress distributions*, each one corresponding
to a different history of loading. During calm sea states, and along a large
part of the pile, one expects that the soil will creep and consolidate and
therefore modify its physical characteristics, so that a particular average
shear stress distribution, Tcons, will develop. Thus this calm sea period
will directly affect the pile behavior during the next storm. During the
* Shear stresses applied on the soil immediately adjacent to the pile, on a surface parallel to the pile surface and in the pile direction.
P
Ipassage of this storm the shear stress distribution will change. At a given
time one can think in terms of a distribution T associated with the max
maximum value of P during the cycle, P , and another distribution T in
corresponding to Pin The mean of these two distributions will be called
ave ( + in) / 2 ; while the fluctuation around this mean is termed
ave max min
= (Tmax - Tin) / 2 as shown in Figure 1.2.2.
The distribution of at an instant during the storm will usually ave
be different from that of T , the shear stress distribution at the end
cons
of consolidation, but both will nonetheless be in equilibrium with P ave Along a large part of the pile, shearing will thus occur with a significant
mean value aves It can furthermore be expected that a large range of
values of and T will be encountered along the pile. Based on these
ave c
preliminary observations we may now envision the research directions in some
more details.
Depth
There are essentially three research topics which must be properly
tackled if we want to be able to reasonably understand the behavior of
such a tension pile :
1. We need a pile-soil model that will insure the compatibility of the
displacements of the pile and of the soil as well as the equilibrium
of the forces in the whole system. The estimation of the shear
stress distributions previously mentioned is a direct result of the
application of such a model. The choice of the soil-pile parameters,
which describe the contact between the soil and the pile, is certainly
one of the most delicate problems ; in the case of static loadings
imposed to the pile, the profession has already developed methodologies
for making such a choice, but very little is known when the loading
is more complex and involves successive unloadings and reloadings.
An additional problem may stem from the fact that with a given
set of soil-pile parameters the pile-soil model may accumulate
permanent displacements and residual stresses at each successive
application of a cyclic loading at its top. It will be of paramount importance to properly understand the behavior of the model under
cyclic loading if we want to be able to differentiate between this
phenomenon and the effect of the "soil cyclic degradation" which
is the object of the next point.
2. The soil fatigues under cyclic loading, and as a direct consequence
the characteristics of the soil-pile contacts (the soil-pile parameters)
of physical properties due to the repetition of loading.
It is a fundamental point of this thesis that the average shear
stresses existing along the pile before and during the storm should
be considered amongst the governing parameters of the degradation.
However the introduction of two new parameters (T and T ),
cons ave
in an area of soil mechanics where classically only T is considered,
is a formidable complication, and onemust restrict the
problem to a more practical formulation. The simplest starting
point is to study the cyclic behavior of the soil under a constant
value of average shear stress, i.e. with T = T , which ave cons
corresponds to adopting at the local level a characteristic of the
global loading, P = constant. Our objective will be to accumulate ave
a relevent set of experimental data on the fatigue of clay under
cyclic loading with Tve = cons while covering the wide range of
stresses encountered along the pile.
3. The third issue is to integrate the pile-soil model and the degradation
data into a consistent enginerring tool. One needs to properly define
how the soil degradation affects the pile-soil parameters and how our
limited data base can be used while the distributions of T and
max
T change as a cyclic force P is applied to the pile top. Finally the elaboration of an iteration scheme that respects the
physical characteristics of the phenomenon and properly integrates
the pile-soil model and the degradation data is a key requirement
of the procedure.
All these issues must be considered in detail if we intend to develop
1.2.3 Thesis organization
Chapter 2 presents an overview of the state-of-the art on the design,
testing and modeling of tension piles under cyclic loading. The emphasis
is placed on the test data obtained on instrumented piles tested in-situ
and on the analysis of theoretical models which generated the first impulses
of the present work.
Chapter 3 analyzes in detail the chosen pile-soil model, called the
"Pile Model", by providing a complete description of its behavior under
cyclic loading and in the absence of degradation of the soil-pile parameters.
The methodology used to estimate the soil-pile parameters from the local soil
properties is also described at this stage.
Chapter 4 details the program of tests which was carried out in order
to gather information on the degradation of Plastic Drammen Clay under cyclic
loading with Tave = cons. This chapter also reports these results in a
format allowing for easy interpolation and extrapolation of the data to a
wide range of stress conditions.
Chapter 5 then integrates the results of the two previous chapter
into a computational computer tool called TLPILE and presents examples of
its application to a typical offshore pile.
Chapter 6 summarizes the key contributions of this thesis and
2. STATE OF THE ART
The present chapter summarizes the information gathered in the
technical literature on topics directly related to the behavior of tension
piles under cyclic loading. We shall focus our attention on three issues :
1. static pile tests, and more specifically the equivalence of skin
friction in clay for tension and compression and the effect of
sustained loading on piles,
2. cyclic tests on tension piles, with the main emphasis placed on
in-situ testing, and
3. theoretical models presently available to follow/explain/predict
the behavior of tension piles under cyclic loading.
Additional information on the cyclic behavior of clays relevent to
2.1 TENSION PILES UNDER STATIC LOADING
The least that can be said at the present time is that our experience
with tension piles is limited, and it could be added that for piles under
constant tension it is almost inexistent. Over the years the interest for
tension piles has essentially been associated with the foundations of high
voltage transmission towers, with those of high rise buildings and, more
recently, those of offshore jacket platforms. In all these cases the nature
of the loading is alternatively compressive and tensile and the mean loading
is compressive. Let us now review the information gathered from static
tension tests run in connection with the development of these structures.
The foundations of transmission lines involve very short
concrete-cast-in-situ bored piles. Sowa 951, who presented in 1980 an extensive review on
this subject, has concluded that in the case of cohesive soils the ultimate
pulling capacity of these piles could be reasonably well estimated from the
relationship between the cohesion c and the undrained shear strength as
proposed by Tomlinson. However in view of the scatter he recommended "a
suitable factor of safety to be selected", as well as pulling tests on
important projects. In the case of sandy soils the concluded that the scatter
of K values is significant and that "it is not possible to select a value of
K with a sufficient degree of confidence to estimate the pulling capacity of
cast-in-situ piles in sandy soils" and pulling tests were strongly recommended.
Driven piles have been frequently tested in tension but only a few tests
have been reported in the literature. Nearly all the piles that were studied
had an embedded length smaller than 80 ft with an average size of roughly
sustained loading of several hours or days to quick tests of a few minutes.
Most of the piles tested were steel pipe piles but one also finds precast
concrete and H-piles.
In 1980, Olsen at the University of Texas at Austin started
research founded by the American Petroleum Institute, whose objective
is to compile and analyze the maximum number of pile load tests of any type
(compression, tension, or both). In this study the observed ultimate
capac-ities are compared with those predicted by the various methods presently in
use in offshore design, namely for clays :
· the API RP 2A method,
the a method of Tomlinson,
the method of Burland,
. and the X method,
and for sands :
the N-value method.
Figure 2.1.1 gives an overview of the results obtained from tension
tests. The top diagram relates to clay and the RP2A method and the bottom
one to sand. The abscissa corresponds to the calculated value of the
ulti-mate pulling capacity and the ordinate refers to the measured value.
On the basis of all the tests analyzed,Olson concluded that :
1. in clay the RP 2A method gives the most consistent agreement between
calculated and measured ultimate capacities,
2. the prediction is far better for clay than for sands. A typical
factor of safety, against ultimate failure, to be applied in clay
would be two while a factor of three should be applied to sands,
o I f W. 0 -o Qn r° g To a) in clay lb 'a0 aa 600 o00
OU-CALC [KIS) TrEI5 iN CLRT MP2
100o
b) in sand
se. r R!
ultimate capacities for the higher loads as shown by the slopes of
the regression lines (this observation was systematic with
all the test results).
These results indicate that the level of accuracy in the estimation
of the tension capacities is quite comparable to that traditionally obtained
in compression thereby justifying the procedure recommanded by API. The RP 2A
code II does not differentiate between skin friction in tension and in
compression in the case of clay, nor does the Canadian Foundation Engineering
Manual 118I or the "Rules for the Design, Construction and Inspection of
Offshore Structures" established by DnV 261. Furthermore all these codes
suggest the application in clay of the same factors of safety in compression
and in tension.
To further document the equivalence tension - compression Figure 2.1.2
shows measured values of ultimate friction capacities for piles in clay
tested in both compression and in tension (Chan 1191, Cox et al. 1211). It
can be seen that these results correlate very well, another indication that
the ultimate skin friction in clay can be taken as equal in compression and
in tension. (The results of Cox et al. also show that residual stresses may
play some role since the first type of test applied (compression or tension)
seems to give consistently a higher ultimate friction than the second one).
The ultimate base resistance in the compression tests was estimated from
the RP 2A recommendation (q = 9c ).
The estimation of the ultimate pulling capacity of piles in sand is a
more controversial topic. The failure mechanisms in sand are much more
affected by surface effects and as a result several theories predict a
A 3 U
a
.0
0
20 40 60 80 100 120 140 160 180 200 TENSION (tons) 0 Chan 191 A Cox et al, I Cox et al,Figure 2.1.2 Correlation of ultimate
. 211. Compression, then- tension. 21. Tension, then compression.
friction capacities in tension and in compression.
200o 180 160 140 in C
-z
0
03o an w a: C-120 100 80 60 40 20 0---recognize this possible difference and RP 2A limits the value of K to 0.5
while the others simply state that the skin friction in tension should be
chosen different from that in compression.
Another very interesting topic is that of sustained loading on piles.
Until now we have only discussed the ultimate pile capacity but significant
displacements may be accumulated when the pile is subjected to a sustained
loading lower than its ultimate capacity. There is very little information
available on this subject for tension piles, and this is quite unfortunate
since this phenomenon is of great interest in the study of TLP foundations.
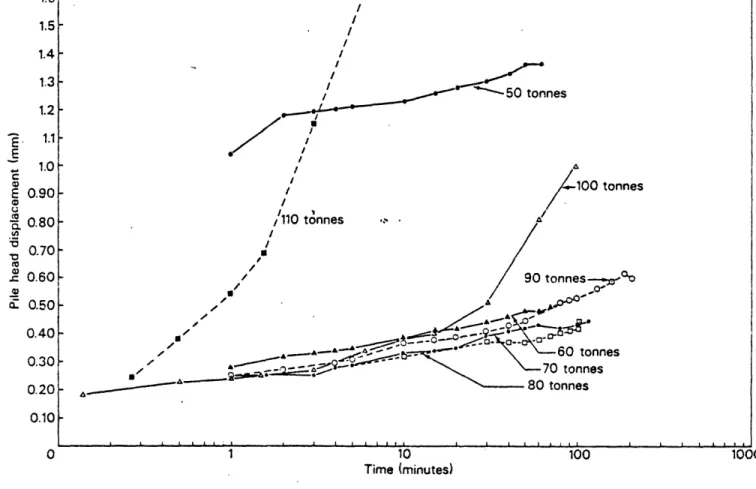
Gallagher and St John 1311 have reported results of sustained tension
loading on piles in the form of time versus pile head displacements for
different loads applied (Figure 2.1.3). The ultimate pulling capacity of
this pile is roughly 120 tonnes. It appears that for a load greater than
approximately 90 tonnes (75 % of the ultimate pulling capacity) there is a
change in the pattern of increase of the displacement with time leading to
creep failure.
The type of tests reported in Figure 2.1.3 have been directly included
in the French recommendations for the testing of piles 1271. Figure 2.1.4
recaps the principal aspects of this procedure. Each load step is applied
for a period of 90 minutes (sometimes 60 minutes) during which the
displacement is recorded on a log scale (diagram 1). The different rates
obtained for each load are then plotted (diagram 3) and usually show a
marked transition between a quasi-linear increase at low loads and a sharp
rate increaseat high loads. The transition load is called the creep load
("charge de fluage"). The acceptable load is then defined from this creep
This procedure has been applied on tension piles by Puech and Jezequel
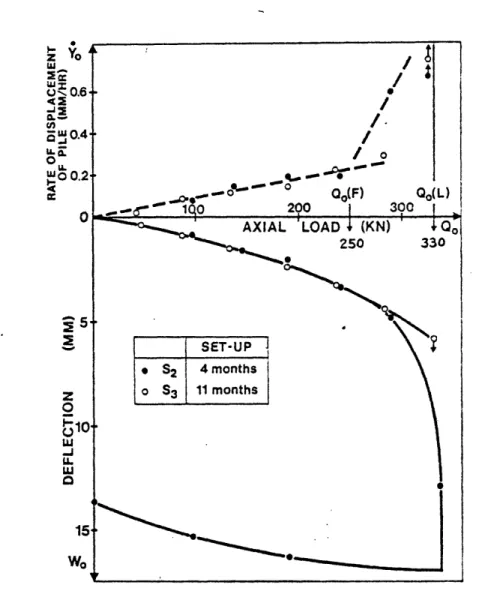
89. Figure 2.1.5 shows that in their example the creep load * corresponded
to 75 % of the ultimate pulling capacity - as in the case of Gallagher and
St John -. For a much longer period of application of the load (larger
than 100 or 90 minutes of the preceding examples) we may find that the
creep load is lower than given by these procedures. There is unfortunately
no information available on this critical issue.
10 Time (minutes)
Figure 2.1.3 Sustained tension loading - history of the pile top displacement.
(After Gallagher and St John 311). 1.0 1.5 1.4 1.3 1.2 1.1 / I / / iI/ -tonnes'-50- I S E-E E 0 ca Q. '0 CL 1.0 0.90 0.80 0.70 0.60 0.50 0.40 0.30 0.20 0.10 0 1 100 1000 r . I I I I . . . . I . I I . . I I . . . I . I I . I . I . I
; '30 3o 1; ' ii /~~~~~~~~~ ?' j :tII , . , ^ _I I I I i ;~ t, 2 i r. (Jrrm t, mne 2 m ) ,, ' 20 .-'. z~. -; "~ ,072 ? s. 7 ,7 0 1- 3o0 .~ oO ,?5 40 ,', ~20 :. ~ ;£_ r3 .r · O 3,E _
~ ~ ~
~ _ ' . * ., . 2) *) Z~~ §~~ 5') 7) :'T li[>~; 1~ - i ' _ _ , Q _~~~'t' ... ... . . . - . . . ., % 2. -li :- ---. - --.-- .___ .20-- --.- '-'- _ __-.-~~~~~~~~~~~~Z
~i
i~~~~~~~~-
r --- -·--- 7----
.-- \`,
---,,'16~~~~~~~~~~~~
-'."--',-. * .. . , ' -.- .a~~~~~~~~~~~.
¢,'r
*
#
ar.t;.
"' - 3 mrr,.~:~
i~~~~' r-- X---
i . ; I. -*~~~~~~~~~~~~~~~~~~~~~ i . t _~~~~~~~~~~~~~~~~~~~~~~~~~~~~~~~~~~~~~~~~~~~~~~~~~~~~~~~~~~~~~~~~~~~~~~~~~~~~FF
Figure 2.1.4 French recommendations for the testing of piles.
3 11 3
0)
", 'P / /' t -I on:% , , .1, I ,, i Y 13,i t4 !Do-~~~~~~~~~~~~~~~~~ )0-_ .. _ ., . _ ,_ . . ... Ii -St-ZF-~F r3 Iz o w UJ U 0.6.
o 0.4,
UL 00.
wo 0.2, !-0z
o 10 LU -J U. 15 wo // IO /..o- °" Oo(F) Qo(L)
1q:0 200 300 AXIAL LOAD (KN) Q 250 330
SET-UP
\
S2 4 months o S3 11 months i LFigure 2.1.5 Plancoet tension pile - load-deflection curves and creep-curves from static tests S and S . Determination of the creep load.
(After Puech and Jezequel 1891).
-- ~ ~ ~ _
I
2.2 CYCLIC LOADING ON TENSION PILES
This review focuses on in-situ testing of piles but for reasons of
completeness we should first comment on the tests which have been run on
model piles of small dimension*. Many researchers have tested such model
piles under cyclic loading (usually under controlled strain conditions)**
and some under both cyclic loading and tension 1881.
Overall it is extremely difficult to interpret these tests which are very
affected by test conditions. The shafts used are very stiff compared to
actual piles and as a consequence the study of the redistribution of stresses
during cycling is difficult, if-not impossible. The results are erratic and
often contradictory (for example in the evaluation of excess pore pressures
during cycling 1841), and their extrapolation to actual pile sizes is
extreme-ly delicate. Overall it is felt that the model tests do not constitute yet a
satisfactory source of information for the design of TLP foundations and we
shall focus uniquely on in-situ piles of more practical sizes (diameters of
20 to 50 cm and length of 5 to 17 m). Note that even with these piles
the application of the results will require significant extrapolations for
offshore piles of 1.5 m-diameter and 100 m-length.
These are numerous problems associated with in-situ testing of piles
under cyclic loading the least of which is certainly not the proprietorship
of the data. These tests are extremely costly and their results are kept in
some secrecy. The discussion that will follow is based on the few papers
which have been released in the literature but it does not represent an
accurate image of what is really known. Four test programs have been reported :
the "Empire test program" in the USA 1561, the BRE test program in Great
* Usually in the laboratory.
Britain (1311, 1701), the NGI test program in Norway 1521, and the IFP test
program in France (1891, 1861, 1871),all of them being funded by oil companies.
These tests are very complex to run, they require a sophisticated
instrumentation and some key choices of procedure to be made. Apart from
the choice of the pile and of the soil one has to select an installation
procedure (driving or jacking), the number of cyclic tests to be run on each
pile, the duration of the rest periods between tests, the loading period,
shape, amplitude,duration, etc... The number of parameters is such that the
results should be treated case by case.
It is very important to notice that none of these programs have
considered the application of a sustained average tension load prior to
testing. In other words the piles were cycled from zero-load conditions.
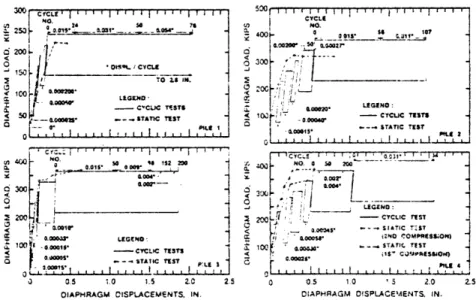
Kraft et al. (1561, and also Cox et al. 1211) have reported in 1981
some of the results obtained at the Empire Test Site in 1975 on four 14 "
(35.6 cm) -diam, open-ended, sections of steel pipe piles driven into strong
underconsolidated clays at depths varying from 150 ft to 360 ft. Their tests
were composed of various combinations of tension, compression and cyclic
loadings. In many cases, and in the own words of the authors, "qualitative
rather than quantitative conclusions (had) to be drawn from the test data".
These tests were load-controlled. Typical load-displacement responses under
cyclic loading are given in Figure 2.2.1. The one-way cyclic loading applied
did not affect the ultimate capacity, but large displacement began to
accu-mulate when the maximum load reached 80 % of the static capacity. It can be
observed from Figure 2.2.1 that the cyclic stiffness of the pile was not
300 CICLE I | i Y ,__,.__ L YCLE a-l ,o , , zs . o 200 CO i ° -- LGCOD 'C' CL:IC TST -1 ; CT T I~SC I I I ---I 4STIC I I I I T I i L LT , I a 0.5 1.5 2.0 2. OIAPHRAGM CISPLACEMENTS, IN.
400
O S ,'i'; ll?ll
CYCI - '
- ...
_ ''/i ' LJ
< tOP ;, o
~-
-CYCUC IST _;
.fX
_00to.
0.
oi
-- -. STATIC TEST¢ . i , ; ,_ , , , , I -o ,i ,l -- 1C '
.i .I
O ' $I
_ TArTII i.
?TIN
·' .00 6wI. CAMSP 0 0.5 1.0 ' 2.0 2.5OAPHRAGM D0SPLACE'ENTS. IN.
Figure 2.2.1 Load - Displacement response under cyclic loading - Empire test site'
(After Kraft et al. 1561).
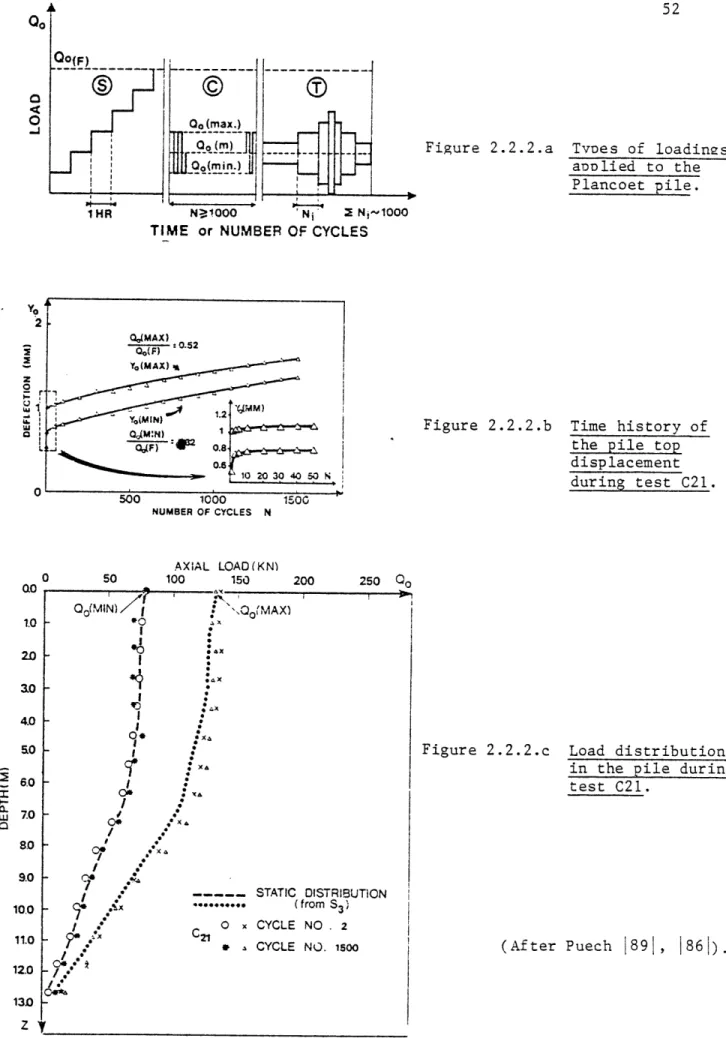
Puech et al. (1861, 1871, 891) have reported very interesting results
on a 13 m long closed-ended steel pipe pile driven into recent deposits
of marine sediments including compressible silts, loose sands and silty
clays. (Plancoet site) Figure 2.2.2.a shows the type of loadings applied
to this pile : static (S), cyclic (C) and storm (T). (The static tests
corresponds to those of Figure 2.1.5). Figures 2.2.2.b and 2.2.3.a to c
give the displacements of the top of the pile as a function of the number
of cycles for 4 tests called C21, C12, Cll and T2.
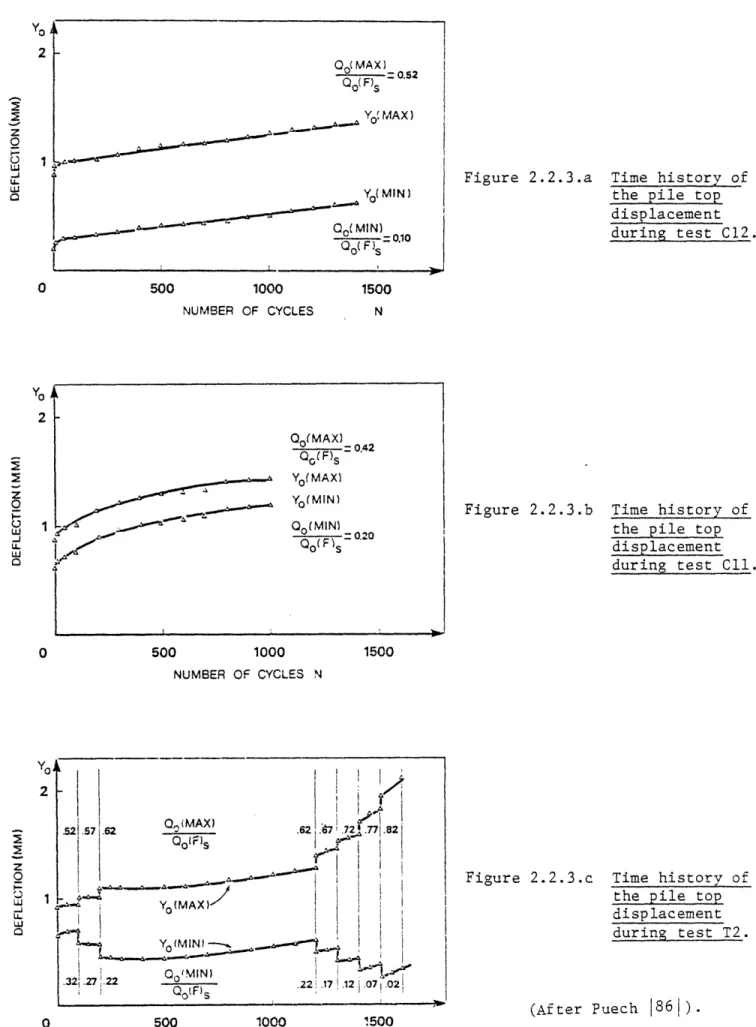
Tests C21 and C12 (Figures 2.2.2.b and 2.2.3.a) have the same maximum
loads (defined from the creep load, Q (F)s, of Figure 2.1.5) of Q (max) =
0.52 Q (F)s, and they both show a steady accumulation of the deformation
with no indication-of future stabilization. Test Cll (Figure 2.2.3.b) has a
lower maximum load of Q (max) = 0.42 Q (F)s and shows a clear tendency to
Figure 2.2.2.a TvDes of loadings aDDlied to the Plancoet pile. yot 2 CoMAX) 0.52 _ Qo( F) - . L- J CF) 0.8 3VJ NUMBER OF CYCLES N NUMBER OF CYCLES N AXIAL LOAD(KN) 50 100 150 (3 ,rrr - I---1tOui
Figure 2.2.2.b Time history of the pile top displacement during test C21.
200 250 Qo
Qo(MIN)/ : ',Qo (MAX)
-
.:.x
f X. 0* wv I / 0 / .* x-I --
_
_ STATIC
.4x
...
7x C Z! O x CYCLE , , CYCLE C* I .*t DISTRIBUTION (from S3 ) E NO . 2 - NO. 1500Figure 2.2.2.c Load distributions in the pile during test C21.
(After Puech 1891, 861).
O
-J
TIME or NUMBER OF CYCLES
0 1.0 20 3.0ao 4.0 5.0 ir
I
. C 6.0 7.0 80 9.0 10.0 11.0 12.0 130 __ ', --2 - , _ . .~~~ -* Arn -F z500 1000 NUMBER OF CYCLES Q (MAX)° 0 0.52
Yo!
MAX
)
L. Yo( M IN )i--'~-"'" QCo MIN)_ 0 1
! _
_Qo
(
F)s
...
Figure 2.2.3.a Time history of the pile top displacement during test C12.
1500
N
Figure 2.2.3.b Time history of the pile top displacement during test Cll. 500 1000 1500 NUMBER OF CYCLES N
i
z0
LU 0 0 500 1000 1500 NUMBER OF CYCLES NFigure 2.2.3.c Time history of the pile top displacement during test T2. (After Puech 861). Yo 2 2 z
0
LU LU CLL 1 0 Yo 2z
2 1 _J U, LU 0 s - -, -, -, I al, III I I k ' ,I Istabilize. The middle of Test T2 (Figure 2.2.3.c) has the highest Q (max)
of all and shows a marked acceleration of the displacement with time. Puech
considers the maximum load as the crucial parameter of the loading and
suggests that the range of acceptable loads be limited to Q (max) < 0.6 Qo
(F)s (and therefore Q (max) < 0.45 Qult) with this type of soil.
It can also be observed from these tests that the cyclic stiffness of
the pile does not change much with the cycling. In the preceding figures
the curves corresponding to the maximum and minimum load stay parallel to
each other, even in the case of the storm loading (Figure 2.2.3.c).
Puech also pointed out that the first 50 cycles or so are not
representative of the long term behavior (see insert in Figure 2.2.2.b), and
may lead to unsafe conclusions. Figure 2.2.2c shows the load distributions
in the pile during test C21 at cycles 2 and 1500 and compares them to the
static distributions of test S3. There is a clear transfer of the load
towards the tip of the pile under the maximum load, but under the minimum
load the cyclic and static distributions are essentially identical.
Puech also defines a cyclic creep load by considering the rate of
displacements of the pile (under the maximum load), and compares it to the
static creep load of Figure 2.1.5 (see Figure 2.2.4). The cyclic creep load
is found to be equal to 60 % of the static creep load.
Puech et al. 1871 also reported some preliminary results obtained with
a 17 m piles driven in an homogeneous slightly overconsolidated (OCR = 2)
plastic clay (Cran site). It appears that the behavior of the pile under
cyclic loading is strongly affected by the nature of the soil. Figure 2.2.5
compares the evolution of the top displacement with time for two sets, one at
100 200 300 Qo AXIAL LOAD (KN)
Figure 2.2.4 Comparison of static and cyclic creep loads - Plancoet Pile.
200 00 0 600 800 10O0 N
NUMBER OF CYCLES
Figure 2.2.5 Comparison of time histories of top
pile displacements at Cran and at Plancoet.
(After Puech 871). o 1
z
-W w N a.o
- w 0 .5 0I--z
'.s U C-, W > U . O -Uj> 0.5 0.4 u.. 0.2 AYo(C): YO (max) -Yo (max)N: 1
PLANCOET Q(max) CLF)AY tat CLAY 0.1 --- ---- TI - ---O ,\ q ;I LT S -,,