Monitoring of Activities
DNPW realizes that monitoring of bee-keeping and caterpillar collection is essential in deciding if these activities are achieving their objectives without causing any serious ill-effects to the environment. To this end, DNPW established studies to monitor the yield and in-come from caterpillars, changes in the nature and magni-tude of illegal activities, and the prevailing public atti-tudes. This process is crucial for successful adaptive ma-nagement; it is still too early to report specific results, but there are some positive indications about the project. Thus preliminary assessments of the yield of caterpillars in 1990 showed that it varied with the frequency at which fire occured in the area, with high yields of caterpillars, occurring in experimental subplots that are burnt early each year (Munthali & Mughogho, 1992), presumably because it increased the availability of green fodder for the caterpillers. Subplots that are not burnt also produced higher yields than those which are burnt late in each year. Certain caterpillar species do not occur at all in burnt areas. This finding could be useful in educating the neigh-bouring communities to help minimize wildfires in the Park, as hot fires reduce the yield of caterpillars pre-sumably by killing them.
Overall, there was a reduction in the extent of illegal activity from the beginning of monitoring, although minor offences increased in 1991 (cf. Mkanda, 1991). The early indications are that tree felling started to decline in 1990, the year in which caterpillar collecting began in the Park. The decline in illegal activities occurred long after incidents of arrests had started to dwindle, suggesting that intensifying law-enforcement effort had very little effect on curbing tree cutting.
A baseline public opinion survey showed that bee-keeping and caterpillar collection are beneficial as sources of food and income for the participating communities (Mkanda & Munthali, 1994). The majority of respondents indicated that they would like to partake of these activities; consequently the results are a reflection of positive attitudes among the locals, and hence sufficient justification to expand the activities.
REFERENCES
ANON. (1991). Forest management for the protection of edible caterpillars in Africa. The Food Insects Newsletter, iv(2), pp. 1-9.
BELL, R.H.V. (1984a). Monitoring illegal activity and law enforce-ment in African conservation areas. Pp. 317—51 in Conservation
and Wildlife Management in Africa (Eds R.H.V. BELL & E.
MCSHANE-CALUZI). US Peace Corps, Washington, DC, USA: [not available for chacking].
BELL, R.H.V. (19846). Traditional use of wildlife resources in protected areas. Pp. 297-316 in Conservation and Wildlife
Management in Africa (Eds R.H.V. BELL & Z.
MCSHANE-CALUZI). US Peace Corps, Washington, DC, USA: [not available for checking].
JACHMANN, H. (1984). The Ecology of the Elephants in the Kasungu
National Park, Malawi; with Specific Reference to Manage-ment of Elephant Populations in the Brachystegia. Biome of Southern Central Africa. Ph.D. thesis, University of Groningen,
The Netherlands: [not available for checking].
LUCAS, P.H.C. (1988). The Parks/People Interface: Living with our
Neighbours. Paper presented at the Endangered Wildlife Trust
Symposium on National Parks, Nature Reserves, and Neigh-bours, Johannesburg, RSA: [not available for checking]. MKANDA, F.X. (1991). Possible solutions for the encouragement of
positive attitudes towards national parks and game reserves in Malawi. Nyala, 15(1), pp. 25-37.
MKANDA, F.X. & MUNTHALI, S.M. (1994). Public attitudes and needs around Kasungu National Park, Malawi. Biodiversity and
Conservation, 3, pp. 29-44, illustr.
MUNTHALI, S.M. & MUGHOGHO, D.E.C. (1992). Economic in-centives for conservation — an experiment on bee-keeping and Saturniidae caterpillar utilization by rural people. Biodiversity
and Conservation, 1, pp. 143-54.
MYERS, N. (1994). Eco-refugees: a crisis in the making. People and
the Planet, 3(4), pp. 6-9, illustr.
SADC Secretariat (1988). SADC Regional Economic Survey. Gaborone, Botswana: [not available for checking].
WYK, A.W. VAN & ANDERSON, J.L. (1988). Tribal Resource Areas
in Ka Ngwane: A Promising Start. Paper presented at the
En-dangered Wildlife Trust Symposium on National Parks, Nature Reserves, and Neighbours, Johannesburg, RSA: [not available for checking].
FRANCIS X. MKANDA, MSC (Edinburgh) Senior Parks and Wildlife Research Officer Department of National Parks and Wildlife PO Box 30131
Lilongwe 3 Malawi.
On the Natural Biological Regulation of the Environment
INTRODUCTION
T
he Second UN Conference on Environment and De-velopment, held in June 1992 in Rio de Janeiro, directed attention widely to the interrelation between socio-economic development and the environment — not only for governmens but also for the general public. The vital role of ecology in the evolution of Mankind has been widely acknowledged (see, for example, Gorshkov, 1987, 1990,1993; Gorshkov & Kondratyev, 1990; Govshkov et ai, 1992,1994; Meadows & Meadows, 1992; Tolbaetal, 1992; Anthes, 1993; Azuelaef al., 1993; Broecker, 1993; Cotton & Pielke, 1993; Katz et al., 1993; Losev et al, 1993; Turner, 1993; Woodley et al, 1993; Kondratyev et al;, 1994a, 1994ft; Polunin & Nazim, 1994). However, the documents of the Conference have not been suffi-ciently concrete, problem-oriented, and binding, to be effective in practice (Grubb et al., 1993; Holmberg et al., 1993; Ip, 1993; Kondratyev, 1993; Kondratyev et al, 1994a, 1994b). Hence, there is due need for further dis-cussion of the concepts for solutions of the global changeproblems. The objective of the present contribution is to continue such a discussion on the basis of a recent concept of Biospheric stability (Gorshkov, 1987, 1990, 1993; Gorshkov etal, 1990,1992,1994; Losev et al., 1993).
THE WATER CYCLE
Local properties of the atmospheric environment are mainly characterized by mixing ratios of important chemical compounds, by changes of temperature and pressure, and by solar radiation flux. The rotation of the Earth itself and around the Sun causes the diurnal and seasonal variations in these environmental parameters. Solar energy drives basic global element and substance cycles, the water-cycle being such a basic-substance cycle. The annual amount of evaporated and precipitated water is of the order of 5 x 10⁵ Gt of H2O (1 Gt = 109
tonnes) for the entire Earth, of which only about 7.5 x 10⁴ Gt of H2O falls onto land. One-third of the latter part comes from the oceans and goes back to the oceans by
river run-off, and two-thirds (5 x 10⁴ Gt of F^O/a) eva-porate from land surfaces, mainly by evapotranspiration from land vegetation (Chahine, 1992).
The natural chemical composition of the environment still changes due to emissions of substances from the Earth's crust — mainly by volcanic activity but also by loss of substances from the Earth's mantle. However, the total mass of substances that are subject to chemical change reaches only lCH2 Gt/year (Degens et al., 1984), i.e. 10~7 times that of the water-cycle. This characterizes the observed high chemical stability of the natural environment. It should be remembered, on the other hand, that equilibrated chemical changes are very substantial: every year about 0.5 Gt of methane (CH4) are oxidized, as well as far more than 10~2 Gt of nitrous oxide, carbon monoxide, and other 'trace' gases. Roughly 4 Gt of O3 are formed about the Earth's surface and destroyed per year. The balance of biogeochemical cycles of substances in Nature is very near to an equilibrium. For example, all the evaporated water is precipitated. The water-budget com-ponents can be calculated from sea-level changes, soil moisture, freshwater reservoirs, and atmospheric water content, as well as from characteristic lifetimes of water molecules in the atmosphere and the ocean. These life-times are the ratios of water masses in the respective reservoirs to yearly global evaporation or precipitation, giving 10 days for the atmosphere and about 3,000 years for the ocean.
The observed changes in atmospheric moisture show local imbalances of evaporation and precipitation during about ten days. Assuming a constant global atmospheric water-mass of 104 Gt for the last 10,000 years, the ratio between atmospheric water-vapour mass (104 Gt of H2O) and total water-mass evaporated during these 10,000 years (5 x 10⁹ Gt of H2O) is roughly 10~6, i.e. evaporation balances precipitation with an accuracy of six significant figures. Accounting for changing ice-sheets, every 100,000 years reduces this accuracy to 10"4, if the total ice-mass of 2 x 10 Gt of H2O (Chahine, 1992) is halved
and doubled during this period.
ABIOGENIC CHANGES IN THE CHEMICAL COMPOSITION OF THE ENVIRONMENT
In contrast to physical cycles of substances, the chemical variations in the atmospheric environment due to emis-sions from the Earth's crust are not as well balanced. These non-equilibrium processes still result from initial conditions at the planet's formation, and are, as in the case of volcanic activity, one-way processes (Budyko et al., 1985). Therefore, despite a low relative rate of the res-pective chemical changes of the environment, they can be substantial during a long time-period. For example, inor-ganic crustal carbon gets to the environment at a rate of ~ 10-2 Gt of C/a (Degens et al., 1984). The inorganic carbon reservoir in the atmosphere, as well as the organic carbon in vegetation, are of similar magnitude and contain roughly 103 Gt of C. Therefore, a doubling of the mass of carbon in the atmosphere by natural emissions from the Earth's crust could take place during a period of only about 105 years.
Many substances transported to the environment from the Earth's crust react chemically in the environment and change its composition. Such changes could make the environment unacceptable by, and hence inimical to, life.
The continuous existence of life on Planet Earth for about three thousand million years indicates, however, that there have been no such drastic changes.
THE CLOSED NATURE OF THE CARBON CYCLE
Life accelerates the chemical changes in the environment by four orders of magnitude compared with crustal pro-cesses (Gorshkov & Kondratyev, 1990; Govshakov et al., 1992, 1994; Losev et al., 1993). This is due to the syn-thesis of organic substances at a rate of about 100 Gt of C/a (60 Gt of C/a on land and 40 Gt of C/a in the world ocean (Degens et al., 1984)). The total reservoir of or-ganic carbon in the environment (atmosphere, vegetation, waters, and soils) is roughly 2 • 103 Gt of C. The synthesis of organic carbon is nearly balanced by its decomposition, without which carbon storage in organic compounds could double within decades.
The observed stability of the inorganic carbon content in the environment, in particular the CO2 reservoir in the atmosphere, during 100,000 years (Degens et al., 1984), proves that synthesis and decomposition of organic sub-stances are balanced to an accuracy of four significant figures.
It should be emphasized here that it is sufficient to know the orders of magnitude only to judge the closed nature of biogeochemical cycles. Absolute values of net primary production of The Biosphere, and organic and inorganic carbon reservoir contents, can be estimated only to an accuracy of roughly a factor of 2. However, such an uncertainty does not strongly affect the calculated balance between synthesis and decomposition.
BIOLOGICAL STABILITY OF THE ENVIRONMENT
We now wish to evaluate the precision with which the world's biota can maintain synthesis and decomposition of organic substances when disturbed. As the transport of inorganic carbon from the Earth's crust to the atmospheric part of the environment is roughly 10~2 Gt of C/a, and since about 107 Gt of C have been buried during the last 600 million years, 104 times the inorganic carbon reservoir (~ 103 Gt of C) of the atmosphere have had to be removed from it.
The main process achieving the balance after dis-turbance is the burial of organic carbon in sediments controlled by biota. Paleo-data show that the mass of organic matter buried during the Phanerozoic period as sediments is roughly equal to the input from the Earth's crust (Budyko et al., 1985). The fossil-fuel deposits (coal, oil, gas) now used by Mankind, are only 10-3 times the total sedimented organic carbon.
The rate of sequestering of organic carbon (the dif-ference between synthesis and decomposition), is equal to the emission of inorganic carbon to the environment. The precision of this balance is the ratio between some 103 Gt of inorganic carbon in the environment and 107 Gt of organic carbon buried in sediments, i.e. 10*4.
The emission rate of inorganic carbon from the Earth's crust is the difference between that given out as gas and that resulting from the weathering of rocks. Obviously, the biota do not affect the level of carbon emission from the Earth's crust; however, they can change the rate of weathering (Schwartzman & Volk, 1989). The weather-ing and degassweather-ing rates and their difference, determinweather-ing
172
the flux of inorganic carbon to the environment, are of the same order of magnitude (Budyko et al., 1985), but the amount of carbon from weathering is smaller than that in 'the emitted flux. Hence the compensation process, which maintains the carbon reservoir's size in our environment, is the burial of organic carbon in sediments.
We should note that the net release of oxygen into the atmosphere, caused by organic substances buried in sediments, has built up in the environment to 106 Gt of O2, 103 times the organic (103 Gt of C) and inorganic (103 Gt of C) carbon pools in the environment, but a factor of 10 less than the carbon buried in sediments (~ 107 Gt of C), as part of the oxygen was used for oxidizing products of volcanic eruptions. Therefore the present-day reservoir of oxygen in the environment cannot be changed markedly by biota: burning all the organic matter in the environment could reduce the reservoir of oxygen by only one per mille. Burning all known resources of fossil fuel (~ 104 Gt of C) would bind only about 1 % of atmospheric oxygen. However, the continued slow burial of organic matter in sediments and thus the net release of oxygen, com-pensates for the oxygen spent to oxidize volcanic exhal-ations. This maintains the concentration of oxygen at a rather constant level with about a 1CH* accuracy.
The results discussed have led to the proposition that biota (life) control atmospheric environmental chemistry (Lovelock, 1982; Gorshkov, 1993). The control is achie-ved mainly by inorganic chemical compounds determin-ing the 'greenhouse' effect of the atmosphere, the Earth's albedo, and the spectral composition of solar radiation reaching the Earth's surface. The control mechanism is: biogeochemical cycles bind excess inorganic matter in organic substances, i.e. synthesis slightly surpasses de-composition or vice versa.
MECHANISM OF BIOTIC CONTROL OF THE ENVIRONMENT
The main portion of the organic mass that is directly affected by biota is made up of soil humus and dissolved organic compounds in the ocean (oceanic humus). Soil humus can be rapidly decomposed by Bacteria, as is confirmed by reduced fertility of many cultivated soils in the current century. Yet the soil humus storage may increase only slowly (Schlesinger, 1990), whereas the oceanic humus may grow rapidly, due to increase of its production by oceanic biota (Gorshkov, 1993; Losev et al., 1993). On the other hand, oceanic humus can de-crease, but slowly, as is determined by the usually slow rate of decomposition of dissolved organic matter, and if production by oceanic biota is sharply decreased. Undis-turbed natural communities on land and in the ocean — the natural biota — can thus control practically all aspects of the environment that are important for life.
It may be that the water-cycle, described early in this Communication, is not stable without life. An enormous synthesis rate of organic substances (if compared with abiotic variations) enables it to restore rapidly, i.e. nor-mally within decades, acceptable conditions of the en-vironment after externally imposed strong fluctuations. In view of this sturdy impact of biota on the abiotic en-vironment, their violation, as well as changes in the ge-netic programmes of natural species, could lead to rapid and harmful changes in the environment.
It may well be that the most dangerous global changes result from the violation of the compensation mechanisms of natural biota, rather than from other human activity
(environmental pollution included). If these compen-sation mechanisms would function with the same effi-ciency as they do among the undisturbed biota, the present industrial activity could lead to smaller than the observed global changes.
PRESENT GLOBAL CHANGES OF THE ENVIRONMENT AND POSSIBILITIES TO PREVENT THEM
At present, some 61% of the ice-free land surface of the globe has already been cultivated, with untouched land areas supporting natural biotic communities constituting only 39% (Tolba et al, 1992). The observed carbon-cycle changes can be characterized in the following way. The use of fossil fuels results in a CO2 emission rate to the atmosphere of mf = 5.5 ± 0.5 Gt of C/a. The atmosphere
accumulates carbon at a rate of ma = 3.5 ± 0.2 Gt of C/a.
The ocean takes up carbon from the atmosphere (by mixing into the ocean's interior) at arate of ms = -2.0 ± 0.8
Gt of C/a (IPCC, 1994). According to mass conservation calculations:
m*f + ms + mb = ma, mb = mw + mb s,
where mb = mbi + mbs sums the changes of organic carbon
mass on land and in the ocean. An analysis of changes in the storage of dissolved organic carbon in the ocean mbs
shows that it increases, and rates as high as mbs ~2 Gt of
C/a have been postulated by one of us (Gorshkov, 1987, 1990, 1993). However, we have to emphasize that the strongly varying estimates have one thing in common: prediction of an increased amount of dissolved organic carbon in the ocean. Thus more research on the 'biological pump' in the ocean is very important (Kondratyev et al.,
1994a).
An increased assimilation of carbon by the oceanic biota should be considered as a natural response of the weakly-disturbed oceanic biota to the anthropogenic disturbance of the atmosphere and land biota. With a comparably weak disturbance of the environment, for example the CO2 concentration increase of about 25% compared with pre-industrial times, the rate of return to the undisturbed state, i.e. the rate of the additional assi-milation of carbon by the oceanic biota, should be pro-portional to the deviation from the undisturbed state AMa
= 150 Gt of C (Friedli et al., 1986; Tolba et al., 1992). Therefore, ms = ks • AMa, with ks determining the speed of
a return to a balanced system; ks is estimated by 0.013a"1.
The preindustrial turnover time TS of carbon in the atmo-sphere is fairly similar for the ocean and the land biota, leading to:
T
s = Pao/Pbs ~ 14 years for ocean and
T
l - Uao/Pbl ~ 10 years for land
with uao = 590 Gt of C as the undisturbed value (Friedli et al., 1986) and Pbs = 40 Gt of C/a and Pbl = 60 Gt of C/a for
the net primary production of the oceanic biota(s) and land biota (1) (Gorshkov, 1993). Therefore, the relaxation coefficient for the undisturbed land biota is
The undisturbed land biota could additionally assimi-late mb m= ki0 • AMa, if there were not limiting factors
such as nutrients and water as well as solar radiation. The *A11 such 'm's in these equations etc. should have a dot over them. — Ed.
most recent estimate of my = 1.4 ± 1.5 Gt of C/a, as given by IPCC (1994), leads to a lq between roughly zero and 0.02a-1, with 0.01a-1 as the most probable value. Mainly it is the undisturbed land biota which thus assimilate 1.5 Gt of C/a additionally.
An immediate question thus is: How much of the emissions from fossil fuel consumption could be taken up by the undisturbed land biota? The question can be rough-ly answered from the data given above. The completerough-ly recovered land biota would absorb carbon from the atmosphere at the rate of mt,i0 = 3 Gt of C/a for the present
additional load, thus would be able to reduce present growth of CC>2-levels to a half.
It should be mentioned that the disturbed biota do not recover immediately after ceasing or strongly reducing economic activity. Natural plant communities form in a succession that may last for hundreds of years. However, the ability of biotic regulation of the environment may recover, much more rapidly, during several tens of years. As far as the role of primary productivity of cultivated land is concerned, it reaches natural levels in some countries but is far from it in most areas.
CONCLUSION
The main consequence of the above estimates is: Pre-servation of the capacity of natural ecosystems to recover from disturbances. Two joint avenues of desired future behaviour are obvious: Restoration of land biota to the extent that it is possible in all countries, and increase (reduction of use) of energy efficiency (consumption per caput) in all industrialized countries. Research in natural sciences has to concentrate on narrowing the uncertainties in the carbon cycle — especially through studies on the oceanic biological pump, on fostered carbon storage in managed ecosystems, and on additional carbon storage in natural ecosystems. Similar thoughts on a possible global-change policy have been expressed by Anthes (1993) as well as by Cotton & Pielke (1993).
It should be emphasized that all values given are first estimates. Their main purpose is to stimulate discussion and further research while refraining from embarking on only partial solutions — for example the need of a vast efficiency revolution but in the absence of any policy for conservation or restoration of land biota.
REFERENCES
ANTHES, R.A. (1993). The global trajectory. Bull. Amer. Meteorol. Soc, 74(6), pp. 1121-30.
AZUELA, A., CARABIAS, J., PROVENCOS, E. & QUDRI, G. (1993). Desarollos Sustenable: Hacia Una Politica Ambiental. UN AM,
Mexico: 179 pp.
BROECKER, W.S. (1993). Labor Erde: Bausteine fiir einen
lebens-freundlichen Planeten. Springer-Verlag, Berlin, Germany: 300
pp.
BUDYKO, M.I., RONOV, A.B. & YANSHIN, A.L. (1985). [History of the Atmosphere.] Gidrometeoizdat, Leningrad, USSR: 207 pp.
[in Russian].
CHAHINE, M.T. (1992). The hydrological cycle and its influence on climate. Nature (London), 359, Nr 6394, pp. 373-9.
COTTON, W.R. & PIELKE, R.A. (1993). Human Impact on Weather
and Climate. AST&R Press (Geophys. Sci. Ser., No. 2), Fort
Collins, Colorado, USA: 288 pp.
DEGENS, E.T., KEMPE, S. & SPITZY, A. (1984). Carbon dioxide: a
biological portrait. In The Handbook of Environmental
Chemistry, Part C, 1 (Ed. O. HUTZINGER) Springer-Verlag,
Ber-lin, Germany:[not available for checking].
FRIEDLI, H., LOTSCHER, H., OESCHGER, H., SIEGENTHALER, U. &
STAUFFER, B. (1986). Ice core record of the 13C/12C ratio in atmospheric CO2 in the past two centuries. Nature (London), 324, Nr 6094, pp. 237-8.
GORSHKOV, V.G. (1987). Variations in the global content of organic carbon in the oceanic and land biota. // Nuevo Cimento. Ser. 1, 10C(4), pp. 365-80.
GORSHKOV, V.G. (1990). [Energetics of the Biosphere and
Environmental Stability.] VINITI, Moscow, Russia, 218 pp. [in
Russian].
GORSHKOV, V.G. (1993). [Present changes of the environment and possibilities to prevent them.] Doklady Russian Acad. Sci., 332(6), pp. 802-5 [in Russian].
GORSHKOV, V.G. & KONDRATYEV, K . Y A . (1990). Conceptual
aspects of ecological studies: the role of the energy and mass exchange Geofis. Int., 29(2), pp. 61-9.
GORSHKOV, V.G., KONDRATYEV, K . Y A . & LOSEV, K.S. (1992).
[Global ecological perspectives.] Bull. Russian Acad. Sci., Nr 5, pp. 70-81 [in Russian].
GORSHKOV, V.G., KONDRATYEV, K . Y A . , DANILOV-DANILYAN, V.I.
& LOSEV, K.S. (1994). Environment: From New Technologies
to New Thinking. Ecological Foundation Publ., Moscow,
Russia: 24 pp.
GRUBB, M., KOCH, M., KOY, T., MUNSON, A. & SALLIVAN, E. (1993). The Earth Summit Agreements: A Guide and Assessment.
Earthscan Publ. Ltd., London, England, UK: 208 pp.
HOLMBERG, J., THOMSON, K. & TIMBERLAKE, L. (1993). Facing the Future. Beyond the Earth Summit. Earthscan Publ. Ltd.,
London, England, UK: 48 pp.
IP, D. (1993). Sustainable development: beyond today's fashion.
Sustainable Development, 1(2), pp. 4—7.
IPPC (Intergovernmental Panel on Climate Change) (1994).
Ra-diative Forcing of Climate Change: The 1994 Report of the Scientific Assessment Working Group of IPCC, World
Mete-orological Organization, Geneva, Switzerland: [not available for checking].
KATZ, L.S., ORRICK, S. & HONIG, R. (1993). Environmental Pro-files: A Global Guide to Projects and People. Garland Publ.,
New York & London: xxvi + 1083 pp., illustr.
KONDRATYEV, K. YA (1993). [Second UN Conference on Environ-ment and DevelopEnviron-ment: some results and perspectives.] Bull.
Russian Acad. Sci., Nr 2, pp. 169-73 [in Russian].
KONDRATYEV, K . Y A . , DANILOV-DANILYAN, V.I., DONCHENKO, V.K.
& LOSEV, K.S. (1994a). [Ecology and Policy. Acad. Sci., St. Petersburg, Russia: 376 pp. [in Russian].
KONDRATYEV, K . Y A . , MORENO-PENA, F. & GALINDO, I. (19946). El Cambion Global: Medio Ambiente y Sociedad. Universitad de
Colima, Mexico: 48 pp.
KONDRATYEV, K . Y A . & CRACKNELL, A.P. (in press). Observing Global Climate Change. Taylor & Francis, London, England,
UK: (in press).
LOSEV, K.S., GORSHKOV, V.G., KONDRATYEV, K . Y A . , et al. (1993). [Ecological Problems of Russia.] VINITI, Moscow, Russia:
349 pp. [in Russian].
LOVELOCK, J.E. (1982). Gaia: A New Look at Life on Earth. Oxford University Press, New York, NY, USA: pp.
MEADOWS, D.H. & MEADOWS, D.L. (1992). Beyond the Limits:
Global Collapse or Sustainable Future. Earthscan Publ. Ltd,
London, England, UK: 320 pp.
POLUNIN, N. & NAZIM, M. (Eds) (1994). Population and Global
Security (Environmental Challenges II). Foundation for
En-vironmental Conservation, 7 Chemin Taverney, 1218 Grand-Saconnex, Geneva, Switzerland: xi + 285 pp., illustr.
SCHLESINGER, W.H. (1990). Evidence from chronosequence studies for a low carbon-storage potential of soils. Nature (London), 348, pp. 232-4.
SCHWARTZMAN, D.W. & VOLK, T. (1989). Biotic enhancement of weathering and habitability of Earth. Nature (London), 340, Nr 6233, pp. 457-60.
TOLBA, M.K., EL-KHOLY, O.A., EL-HINNAWI, E., HOLDGATE, M.W., MCMICHAEL, D.F. & MUNN, R.E. (Eds) (1992). The World Environment 1972-1992: Two Decades of Challenge. UNEP,
TURNER, B.C., II (1993). The Earth as Transformed by Human
Action. Cambridge University Press, Cambridge, England, UK:
736 pp.
WOODLEY, S., FRANCIS, G. & KAY, J. (1993). Ecological Integrity
and the Management of Ecosystems. St Lucil Press, Delray
Beach, Florida, USA: 220 pp. V.G. GORSHKOV
St Petersburg Institute of Nuclear Physics 188350 Gatchina, St Petersburg, Russia,
HARTMUT GRASSL, Director
World Climate Research Programme do World Meteorological Organization
Case Postale 2300
CH-1211 Geneva 2, Switzerland,
KIRILL Y. KONDRATYEV, Councellor
Research Centre for Ecological Safety Russian Academy of Sciences
Korpusnaya Street 18
197042 St Petersburg, Russia, &
K.S. LOSEV
Institute of Scientific Information Usiyevicha 20a
125219 Moscow, Russia.
Some Indications of Global Warming in Ghana
INTRODUCTION
S
tudies of current atmospheric dynamics project a tem-perature increase of 2-5°C over different regions of the world during the next century — a rate unprecedented in the past 10,000 years. Already, Ontoyin (1993) has in-dicated a temperature increase in Ghana in the period rang-ing from 1945 to 1990, and Larmie (1993) has shown that, since 1974, temperatures within the Densu Basin, and of the Densu River, have increased by about 3.5% and 4.02%, respectively, which he attributes to climatic change.Consequently the Second World Climate Conference, held in Geneva in 1990 prescribed sustained research towards elucidating any possible change in the global climate system, and also making projections about short-term national and regional climate analyses. The present work is mainly in response to this; it comprises analyses of the temperature changes taking place in Ghana, from
1931-60 to 1961-90.
DATA RESULTS AND ANALYSES
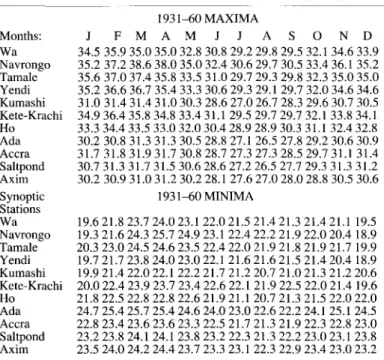
Monthly maximum and minimum temperatures for 1931-60 and 1961-90 have been abridged as the overall monthly means in Table la, for 11 synoptic stations in Ghana, which alone has kept adequate records. The 1961-90 data have also been abridged into mean temper-atures for the months and decades in Table Ha. One set of analyses compares the 1931-60 period with the 1961-90 one; this relates to the mean maximum and the mean minimum temperatures for the various months. Summary results are given in Tables Ib and Ic on page 175.
A detailed analysis of mean temperatures for the three recent decades in 1961-90 (Table Ha) is given in Table lib below:
A comparison of the overall means of the three decades is as follows:
TABLE la
Mean Monthly Temperatures in Ghana (°C).
1931-60 MAXIMA Months: J F M A M J J A S O N D Wa 34.5 35.9 35.0 35.0 32.8 30.8 29.2 29.8 29.5 32.1 34.6 33.9 Navrongo 35.2 37.2 38.6 38.0 35.0 32.4 30.6 29.7 30.5 33.4 36.1 35.2 Tamale 35.6 37.0 37.4 35.8 33.5 31.0 29.7 29.3 29.8 32.3 35.0 35.0 Yendi 35.2 36.6 36.7 35.4 33.3 30.6 29.3 29.1 29.7 32.0 34.6 34.6 Kumashi 31.0 31.4 31.4 31.0 30.3 28.6 27.0 26.7 28.3 29.6 30.7 30.5 Kete-Krachi 34.9 36.4 35.8 34.8 33.4 31.1 29.5 29.7 29.7 32.1 33.8 34.1 Ho 33.3 34.4 33.5 33.0 32.0 30.4 28.9 28.9 30.3 31.1 32.4 32.8 Ada 30.2 30.8 31.3 31.3 30.5 28.8 27.1 26.5 27.8 29.2 30.6 30.9 Accra 31.7 31.8 31.9 31.7 30.8 28.7 27.3 27.3 28.5 29.7 31.1 31.4 Saltpond 30.7 31.3 31.7 31.5 30.6 28.6 27.2 26.5 27.7 29.3 31.3 31.2 Axim 30.2 30.9 31.0 31.2 30.2 28.1 27.6 27.0 28.0 28.8 30.5 30.6 Synoptic 1931 -60 MINIMA Stations Wa 19.6 21.8 23.7 24.0 23.1 22.0 21.5 21.4 21.3 21.4 21.1 19.5 Navrongo 19.3 21.6 24.3 25.7 24.9 23.1 22.4 22.2 21.9 22.0 20.4 18.9 Tamale 20.3 23.0 24.5 24.6 23.5 22.4 22.0 21.9 21.8 21.9 21.7 19.9 Yendi 19.7 21.7 23.8 24.0 23.0 22.1 21.6 21.6 21.5 21.4 20.4 18.9 Kumashi 19.9 21.4 22.0 22.1 22.2 21.7 21.2 20.7 21.0 21.3 21.2 20.6 Kete-Krachi 20.0 22.4 23.9 23.7 23.4 22.6 22.1 21.9 22.5 22.0 21.4 19.6 Ho 21.8 22.5 22.8 22.8 22.6 21.9 21.1 20.7 21.3 21.5 22.0 22.0 Ada 24.7 25.4 25.7 25.4 24.6 24.0 23.0 22.6 22.2 24.1 25.1 24.5 Accra 22.8 23.4 23.6 23.6 23.3 22.5 21.7 21.3 21.9 22.3 22.8 23.0 Saltpond 23.2 23.8 24.1 24.1 23.8 23.2 22.3 21.3 22.2 23.0 23.1 23.8 Axim 23.5 24.0 24.2 24.4 23.7 23.3 23.1 22.3 22.9 23.4 23.0 23.2 1961-90 MAXIMA J F M A M J J A S O N D 34.2 36.5 36.9 35.6 33.7 31.3 29.6 29.1 30.1 32.7 34.6 34.2 35.2 37.6 38.9 38.2 36.0 33.0 31.1 30.3 31.2 34.2 36.2 35.1 35.6 37.6 37.7 35.9 34.0 31.4 30.1 29.8 30.5 33.0 33.4 33.1 35.3 37.1 37.2 35.7 33.6 31.2 29.7 29.3 30.3 32.3 34.7 34.5 32.0 33.5 32.9 32.3 31.3 29.5 28.0 27.7 28.6 30.1 31.2 30.7 33.9 35.7 35.3 34.2 32.6 30.6 29.3 29.2 30.0 31.5 33.0 32.9 33.8 34.8 34.0 33.0 31.9 30.0 28.8 29.0 30.0 31.3 32.7 32.8 31.8 32.5 32.7 32.5 31.9 30.0 28.8 28.5 29.4 30.9 32.3 32.1 32.1 32.7 32.5 32.2 31.3 29.2 28.0 27.9 29.0 30.5 31.6 31.7 30.6 31.3 31.3 31.3 30.3 28.5 27.2 26.6 27.4 29.2 30.6 30.6 30.0 30.8 30.9 30.9 30.0 28.4 27.4 26.9 27.4 28.5 29.9 30.0 1961-90 MINIMA 19.3 22.2 24.4 24.6 23.7 22.4 21.8 21.6 21.5 22.0 20.8 19.3 19.5 22.0 24.5 26.1 25.1 23.3 22.7 22.3 23.7 22.2 20.2 19.0 19.5 22.9 25.0 25.2 24.1 22.7 22.4 22.2 22.0 22.2 20.9 18.9 19.7 22.4 24.2 24.4 23.4 22.2 21.9 21.7 21.5 21.6 20.0 18.9 20.3 22.1 22.2 22.3 22.2 21.6 21.2 21.0 21.2 21.5 21.6 20.7 19.9 23.6 24.8 24.9 24.2 23.1 22.8 22.5 22.4 22.7 22.4 20.8 22.1 23.1 23.3 23.4 23.0 22.2 21.6 21.3 21.5 21.9 22.4 22.1 24.6 26.0 26.0 25.9 25.2 24.3 23.7 22.0 23.4 24.5 25.1 24.5 23.4 24.0 24.2 24.2 23.9 23.1 22.5 22.2 22.4 22.9 23.5 23.3 22.9 23.8 23.9 23.9 23.6 23.0 22.5 21.8 22.3 22.8 23.0 22.0 23.4 24.4 24.4 24.2 23.6 23.2 23.1 23.1 22.9 23.3 23.2 23.2