HAL Id: hal-02541114
https://hal.archives-ouvertes.fr/hal-02541114
Submitted on 21 Apr 2020HAL is a multi-disciplinary open access archive for the deposit and dissemination of sci-entific research documents, whether they are pub-lished or not. The documents may come from teaching and research institutions in France or abroad, or from public or private research centers.
L’archive ouverte pluridisciplinaire HAL, est destinée au dépôt et à la diffusion de documents scientifiques de niveau recherche, publiés ou non, émanant des établissements d’enseignement et de recherche français ou étrangers, des laboratoires publics ou privés.
Long term study of directly hybridized proton exchange
membrane fuel cell and supercapacitors for transport
applications with lower hydrogen losses
Divyesh Arora, Caroline Bonnet, Mainak Mukherjee, Suphaporn
Arunthanayothin, Anantrao-Vijay Shirsath, Martin Lundgren, Martin
Burkardt, Stephen Kmiotek, Stéphane Raël, François Lapicque, et al.
To cite this version:
Divyesh Arora, Caroline Bonnet, Mainak Mukherjee, Suphaporn Arunthanayothin, Anantrao-Vijay Shirsath, et al.. Long term study of directly hybridized proton exchange membrane fuel cell and supercapacitors for transport applications with lower hydrogen losses. Journal of Energy Storage, Elsevier, 2020, 28, pp.101205. �10.1016/j.est.2020.101205�. �hal-02541114�
Page 1
Graphical Abstract
Highlights
Fuel cell directly hybridized with supercapacitor is realistic for FC hybrid vehicle.
Direct hybridization is not detrimental to the FC durability.
Direct hybridization allows to operate with reduced minimum gas flow rate.
Reduced minimum gas flow rate is only sustainable in direct hybridization mode.
Page 2
Long term study of directly hybridized proton exchange membrane fuel cell
and supercapacitors for transport applications with lower hydrogen losses
D. Arora2,1, C. Bonnet1, M. Mukherjee1, S. Arunthanayothin1, A. Shirsath1, M. Lundgren3, M. Burkardt3, S. Kmiotek3, S. Raël2, 1, F. Lapicque1*, S. Guichard21
Laboratory for Reactions and Chemical Engineering, CNRS – University of Lorraine, BP 20451, 54001 Nancy, France
2
Group of Research in Electrical Engineering of Nancy (GREEN), University of Lorraine, 2 Avenue de la Foret de Haye, BP 90161, 54505 Vandoeuvre-lès-Nancy, France
3
Department of Chemical Engineering, Worcester Polytechnic Institute, MA 01609 Worcester, USA
Abstract
Fuel cells (FC) and supercapacitors (SC) directly hybridized allow instantaneous response to peak energy demands in transportation applications. Under urban driving cycle, Fuel Cell Dynamic Load Cycling (FC_DLC), gases are fed with a minimum gas flow rate, corresponding to a safety limit current density (iSL), inducing hydrogen oversupply. To reduce this oversupply, the present work focuses on iSL impact on the FC performance and durability. Two iSL conditions (0.2 and 0.05 A cm-2), were investigated under long-term FC_DLC runs with or without hybridization. At low iSL, hybridization allows 8 % reduction in hydrogen oversupply; in addition, non-hybridized FC lifetime was found two-time shorter than that of hybridized FC. Erosion of the microporous layer of the gas diffusion layer (GDL) evidenced by scanning electron microscopy at the cathode, results in poorer water management, in consistence with the sudden voltage drops observed and the high increase in through-plane gas permeability in the GDL.
Keywords: Direct hybridization; Durability; Hydrogen saving; Proton exchange membrane
fuel cell; Safety limit current; Supercapacitor.
Corresponding author: Dr. Francois Lapicque francois.lapicque@univ-lorraine.fr
Phone number: (+33) (0) 372 74 37 61 – Fax number: (+33) 383 322 975
Page 3
Acronyms and abbreviations
CD Current density, A cm-2
Cdl Diffusion layer capacitance, F
CPE Constant phase element
CV Cyclic voltammetry
ECSA Electrochemical active surface area, cm2 cm-2 Pt
EIS Electrochemical impedance spectroscopy
FC Fuel cell
FC_DLC Fuel cell dynamic load cycling
GDL Gas diffusion layer
HS Hybrid source
iFC Fuel cell current density, A cm-2
iSL Safety limit current density, A cm-2
Ki Inertial permeability, m
Kv Viscous permeability, m2
LSV Linear sweep voltammetry
MEA Membrane electrode assembly
MPL Microporous layer
MPS ESS
Macro-porous substrate Energy storage system
n Exponent
OCV Open circuit voltage, V
Q Pseudo capacitance, F s1-n
Rct Charge transfer resistance, cm2
Rdc Diffusion resistance, cm2 R Ohmic resistance, cm2 SC i Supercapacitor Current density, A cm-2
SEM Scanning electron microscopy
v Fluid velocity, m s-1
ΔL Thickness of the media, m
ΔP Pressure drop, Pa
η Viscosity of the fluid, Pa m
ρ Density of the fluid, kg m-3
air Stoichiometric factor of air
Page 4
1. Introduction
According to the Carbon Trust report, by 2050 one-third of all the middle-sized cars would be fuel cell electric vehicles (FCEVs) and of which, proton exchange membrane fuel cell (PEMFC) technology has been forecasted to take up the market share [1]. In the current scenario, PEMFCs face numerous challenges like slow response at high current demand, low durability, high cost, relatively large system size and high weight required for safe hydrogen storage on-board [2-3]. The slow response time of a fuel cell (FC) can be alleviated by connecting the FC with an energy storage system (ESS) such as batteries or supercapacitors (SC) to form a hybrid source (HS). The presence of ESS aids to reduce stress on the FC as discussed by Lukic et al [4].
Current research work for the FC system is targeted to durability and the cost related to electrodes and platinum catalyst. Along with the durability, optimization of global hydrogen demand is also a prime concern for FC electric vehicles. FC systems are operated at over-stoichiometric requirement factors for the fuel gases to avoid the starvation condition, which induces appreciable waste of hydrogen in a normal scenario.
In a FC during cyclic operation, gases are usually overfed via two techniques. First, as flowmeters need time to adjust their flow rate, change in flowrates for positive current steps is usually anticipated by a few seconds to avoid transient but dramatic starvation. Secondly, as an additional technique to favor transport of the water along the channels [5], minimum flow rates of the gas are supplied to the cell for zero or low energy demand periods: these flow rates correspond to the safety limit current density (iSL) owing to Faraday’s law at the two electrodes. When the current produced by the fuel cell (iFC) is lower than iSL, the flow rates of gases are then set to iSL as per Faraday’s law, taking into account the stoichiometric factors of both gases; else, they are set by iFC. For the European Harmonized Fuel Cell Dynamic Load Cycle (FC_DLC) used to emulate the behavior of fuel cells in transported application [5], it is
Page 5
recommended to fix iSL at a current density of 0.2 A cm-2. Thus, three sources of gas overfeed are to be considered in cyclic operation.
With growing demand of FC vehicles and sustainability of resources, it is imperative to control the amount of hydrogen feed so as to reduce fuel losses. Additionally, over-feeding has an impact on the overall system and it also makes the onboard hydrogen storage problem more acute. Therefore, it is important to search for improved strategies of hydrogen supply in the cell. In this context, a hybridized FC with energy storage device allows a better fuel saving than the non-hybridized FC. Concerning the ESS, it is better to work with SC over batteries because of slow charging, whereas SCs can charge more quickly. In addition, unlike batteries, SCs can endure a large number of charge/discharge cycles without degradation. It has also been shown in [6-7] that a FC hybridized with SC has a higher fuel utilization than a FC hybridized with batteries.
Besides, FC can be coupled with the SCs either via power converters (indirect hybridization) or not (direct hybridization). In indirect hybridization, the global hydrogen demand is optimized by controlling the power distribution between the FC and its associated energy storage. The effective power distribution management of the FC and the SCs in the hybrid vehicle system is done either by using optimization techniques based on the state of charge of SC [8-9] or by submitting the systems to neural network [10]. In contrast, a directly hybridized system does not require any such technique for the control of the system but manages the current distribution in the hybrid source naturally, depending upon the capacity of the SC hybridized, with the only disadvantage that this contribution between FC and SC cannot be controlled. Hence, one degree of freedom is lost in controlling the system [11]. In fact hybridization in general also enables smoothing of the FC current and thus reduces power losses associated with internal connections between the FC and the SC. It has also been shown [12] that the above-mentioned anticipation periods can be avoided with direct
Page 6
hybridization in FC_DLC runs because of the smoothing effect of SC in the fuel cell current. Consequently, direct hybridization improves the efficiency of the hybrid system; moreover, a reduced FC area could then be considered in the design of the hybrid source for a given energy demand [12-13].
The present work intends to decrease the hydrogen overfeeding by reducing the safety limit current density (iSL)level. Two iSL levels are consideredhere, corresponding to current density 0.2 and 0.05 A cm-2, for a 100 cm2 PEM single cell, either alone or hybridization with a stack of 3 paralleled SCs, each of 3000 F. Moreover, the durability of the cell on reducing such iSL value has to be investigated: as a matter of fact, in case that durability is reduced by iSL reduction, this strategy for lower hydrogen feed will appear worthless. Whilst comparing the hybridized FC with non-hybridized FC operating at high iSL the durability of the FC was shown to be not visibly improved by the presence of the SC [12].
Two aspects have been considered in this paper by varying iSL: (i) the overall hydrogen supply during one cycle, depending on the operating mode, and (ii) the durability of the cell membrane electrode assembly (MEA) components in long-term FC_DLC cyclic operation. The durability test was evaluated regularly by the in-situ state of health by electrochemical characterization e.g. electrochemical impedance spectroscopy, cyclic voltammetry, and linear sweep voltammetry, and the ex-situ or post-mortem inspection of the gas diffusion layer (GDL) by scanning electron microscopy (SEM) and gas permeability measurements, to characterize degradation phenomena at different iSL values and operating modes.
2. Details of experiments and test conditions 2.1. Description of the hybrid source
The 100 cm² single PEM fuel cell (UBzM, Germany) was equipped with a seven-layer MEA. The MEAs employed were composed of a Nafion® 212 50 µm thick membrane, Pt/C
Page 7
electrodes with a 0.4 mg cm-2 and 0.2 mg cm-2 catalyst loading at the cathode and at the anode respectively, and of a 285 µm thick GDL (Freudenberg, Germany) including a macro-porous carbon fiber paper and a carbon black micro-porous layer. Once mounted in the fuel cell, the fresh MEA was preconditioned at a constant load current of 1 A cm-2 for 24 h to allow maturation of its various components.
Three 3000 F supercapacitors (Maxwell BCAP3000 P300, 3V, 3.75 Wh) mounted in a parallel stack with the equivalent capacitance of 9000 F was directly hybridized to the fuel cell in parallel with two 0.80 m long Stäubli cables (600 V, 125 A) using 6 mm plugs. This overall circuit formed was the hybrid source (HS) for tests of hybridization.
2.2. Description of test conditions
Stoichiometric factors H2 and air were fixed at 1.2 and 2.5 respectively, following previous tests masde in the lab. In HS configuration, the gases were supplied to the FC with these factors, based on the current delivered by the fuel cell, iFC. Additionally, hydrogen and air were overfed at low current to favor water evacuation. Finally, in the non-hybridized configuration, the two flow rates were anticipated 5 seconds prior positive current changes in the cycle. In all tests shown here, the fuel cell temperature was maintained at 55 oC using a thermostatic bath, and the FC hybrid system operated at atmospheric pressure. The humidity of the inlet air was kept constant at 57 % whereas hydrogen was fed dry.
The test bench was controlled by Control-desk software with a dSPACE® real-time electronic card with Matlab-Simulink® mathematical environment for all essential control parameters such as reference setting (inlet gas flows, and load current), data acquisition and safety shutdown as used in a previous work [11].
In the FC_DLC cycling protocol, for which one period lasts 20 minutes, current and voltage of both the PEMFC and SCs were measured and recorded every 0.1 s along with the set points
Page 8
of both gas flow rates and the reference value of the load current imposed in the cycle. This load current was varied in the range 0 to 100 A (0 – 1 A cm-2).
3. Methodology
As expressed above, the objective of this study is to understand (i) the possible reduction in hydrogen overconsumption upon reducing safety limit current density (iSL) (in this paper, hydrogen consumption corresponds to the hydrogen supplied to the FC), and (ii) to investigate the impact of iSL on the degradation of the MEA, with and without the presence of SCs. Four long-term runs have been carried out and measurements were recorded until the FC reached a 20 % power decay threshold from its initial power output.
3.1. Hydrogen consumption
The volume of hydrogen spent in one cycle is obtained from measurements by integrating the hydrogen flow rate over the cycle period. To be precise, the hydrogen demand by the fuel cell working alone is governed by the contribution of three factors – in addition to hydrogen faradaic oxidation; (i) the over-stoichiometric factor of hydrogen which generates a 20 % excess, (ii) the above 5 s anticipation in the hydrogen flowrate for positive current steps, and (iii) the safety limit current density.
3.2. Long-term runs and evaluation of the MEA state of health
In long-term runs, for the reference point, the first assessment of the MEA was done just after pre-conditioning (maturation) at 1 A cm-2 for 24 h. Afterward, the characterization was performed at regular intervals of approximately 100 h cycling to identify the MEA state of health in terms of membrane resistance, catalyst activity, mass transport/transfer capacities of the MEA, and fuel crossover. For this purpose, the cell was operated alone, using various electrochemical characterization techniques [14-15] as described below.
Page 9
Chronopotentiometry tests were carried out at various current density (CD) values from 0.1 to 1.2 A cm-2 for 10 min, allowing the cell voltage to reach a steady level. All tests were run in duplicate trials. The steady cell voltages led to establishing of the polarization curve (not shown), i.e. the variation of the steady cell voltage with the current density.
Electrochemical impedance spectroscopy (EIS) measurements were carried out from 0.1 to 1.0 A cm-2, covering the CD range in the cycling protocol. The amplitude of the signal was at 10 % of the selected current density with a frequency ranging from 10 kHz to 0.1 Hz, thus allowing the resistances to charge and mass transfers to be observed in addition to ohmic phenomena. Interpretation of the spectra was carried out as described in previous papers [12] and led to an estimate of the ohmic resistance, R, the cathode charge transfer resistance, Rct, and the diffusion resistance of the cathode, Rdc related to the Warburg placed in series with Rct in the cathode circuit. The capacitive contribution was represented by a constant phase element (CPE), with pseudo capacitance Q, and exponent n. The little visible anode contribution in the spectra was assumed to consist of a charge transfer resistance fixed at 10 % of Rct, in parallel with the same CPE as for the cathode. In most cases, exponent n was in the range 0.9 – 1, corresponding to well-defined electrochemical interfaces, and equivalent diffusion layer capacitance (Cdl) could be estimated from pseudo capacitance Q.
For estimation of the fuel crossover and the electrochemical active surface area (ECSA), the air feed was replaced by an argon stream at 0.3 NLs-1 (normal litres at 273.15 K and 1 atm), whereas hydrogen was fed at an equivalent flow rate in the anode chamber. Both gases were fully saturated when admitted into the cell. Hydrogen crossover through the membrane was estimated from the cathode current at 0.4 V measured in linear sweep voltammetry (LSV) at 2 mV s-1 as discussed by Inaba et al. [16] and Lapicque et al. [17]. The current measured is related to the permeated flow rate in accordance with Faraday’s law. ECSA could be
Page 10
determined by cyclic voltammetry (CV) between the OCV and 0.6 V at 30 mV s-1, according to the procedure developed by Sakai et al. [18] and Chaparro et al. [19].
3.3. Post-mortem analysis
Post-mortem analysis concerns analysis of the gas diffusion layer (GDL), which is the intrinsic component of PEMFC, useful for the transport of gases and the removal of water produced. As a matter of fact, water management is a very critical issue concerning the performance and the durability of PEMFC.
The GDL comprises a microporous layer (MPL) and a macro-porous substrate (MPS). The MPL is valuable inter alia for removing water produced at the catalyst layer, and MPS supports inter alia the transport of the reactant gases from the channel to the catalytic layer and the liquid water removal to the bipolar plate. If the MPL is damaged, gases diffusion and liquid water evacuation are affected which is evident by the flooding on the catalyst layer, evidenced by performance decay and sudden negative voltage peaks. Thus, reasons to investigate GDL degradation are also of great importance [20-21].
To study the reasons for GDL degradation due to hydrophobicity loss, the surface morphologies of GDLs were observed by scanning electron microscopy (SEM). To further characterize the MPL degradation, in-plane and through-plane gas permeabilities in the GDL were estimated [22-24].
The permeability of the aged GDLs was compared with a fresh GDL. It was determined by using samples of the GDLs in a home-made measuring cell. 20 mm diameter disks were taken from the center of the GDL. Nitrogen was injected continuously through the inlet pipe section having a diameter of 5 mm. By shutting one gas outlet or the other, nitrogen either flows perpendicularly through the GDL layer or is forced to circulate radially in-plane from the inlet central pipe to the peripheral area of the porous disk before being collected by the circular
Page 11
groove (Figure 1) as explained in [25]. For both through- and in-plane flows, the material permeability was obtained from the variations of the pressure drop as a function of nitrogen flow rate through the GDL.
Figure 1: Home-made cell to measure in-plane and through-plane permeabilities – a) design and b) actual cell [25].
In general, for low flow fluid velocities and at single phase, Darcy’s Law is used to describe flow through a porous media by relating the pressure drop (ΔP) through the investigated sample to the fluid velocity (v) using a linear relationship (Eqn.1).
(1)
where ΔL is the thickness of the media in m, η is the viscosity of the fluid in Pa s, Kv is the viscous permeability in m2.
4. Results
4.1. Hydrogen consumption
The direct application of Faraday’s law in the fuel cell (FC) corresponds to (i) = 1, (ii) no flowrate anticipation time and (iii) no safety limit current density (iSL= 0). In these conditions for a cycle period of 20 minutes, the minimum hydrogen consumption by faradaic oxidation of hydrogen was calculated for the 100 cm2 FC as 3.86 NL per cycle, corresponding to the mean value of the load reference current of the cycle, equal to 27.7 A. However, for actual
Page 12
operation of the fuel cell alone, the hydrogen demand was calculated as 5.92 NL cycle-1 with = 1.2, together with the 5-second-long anticipation period for flow adjustments and safety limit current density (iSL = 0.2 A cm-2), corresponding to 54 % overconsumption [11]. On integrating the hydrogen demand over a cycle leads to find out the share of individual factors contributing to this over-consumption. The individual contributions can be defined by the factors defined below:
(i) 37 % by the H2 over-stoichiometric factor (1.2, instead of 1),
(ii) 52 % by the current corresponding to the minimum H2 flow rate (iSL = 0.2 A cm-2), (iii) 11 % by the H2 flow rate anticipation of 5 seconds before positive current slopes. The advantage of the direct hybridization with the presence of three supercapacitors in parallel has been previously shown for 0.2 A cm-2 safety limit current density [11]: as shown in Figure 2, the hydrogen over-consumption can be reduced from 54% to 29% by the hybridization. This was achieved by suppressing the anticipation in gas flow rate increase, and to the fact that at high currents, the FC is assisted by the SC so hydrogen feed is lower than for FC alone as shown by blue color in Figure 3.
Page 13
Figure 2: Overconsumption of hydrogen vs safety limit current density for FC alone and hybridized system.
By changing the safety limit current density from 0.2 A cm-2 to 0.05 A cm-2, the fuel cell contribution in the dynamic load cycle in the hybridized configuration was unchanged since it depends only on the capacitance of the SC hybridized. Even without hybridization, an appreciable amount of hydrogen can be saved by iSL reduction, with an overconsumption only at 28 % (Figure 2). With hybridization of FC to the SC, this overfed hydrogen was further reduced from 29 % to 20 % (Figure 2). The change in control strategy is shown in Figure 3, where the hydrogen feed for the hybridized FC is plotted for both iSL values. The difference in the two profiles of hydrogen flow illustrates the hydrogen saving by the green areas. It is mostly visible for low and middle range current demand (from approximately 100 to 800 s in the cycle). For higher currents, the hydrogen feed was not affected by the safety limit current, since iFC > iSL. Consequently, for iSL = 0.2 A cm-2, hydrogen flow rate was controlled and maintained constant according to iSL. Once iSL was reduced to 0.05 A cm-2, hydrogen flow rate followed the current delivered by the FC, whose value was mostly lower than 0.2 A cm-2 and was always higher than 0.05 A cm-2 in the above-mentioned period of the cycle. Therefore, in this case, the above 20% overconsumption corresponds only to the over-stoichiometric factor.
Page 14
Figure 3: Hydrogen supply for hybridized FC with respect to FC_DLC at different safety limit current density condition.
4.2. Results from polarization curves in terms of power decay
The polarization curves recorded at regular intervals indicate on the aging induced by the cyclic operation in terms of voltage decay (Figure 4). Comparison of the voltage decay for the various configurations highlighted the durability of the FC when FC is hybridized or not. For more accurate description of the degradation, the decay in fuel cell power performance (from 100 h over a lifetime) was calculated. It has to be reminded that the first 100 h of cycling have been achieved without hybridization for all configurations: it has actually been observed that this common cycling period allowed complete maturation of the MEA since the voltage recorded afterward was 20-30 mV higher than the one observed after the maturation procedure at 1 A cm-2 for 24 h (data not shown). Beginning of test (BoT) was therefore considered as being after the common 100 h cycling period, starting with MEA having the same treatment, whatever the hybridization mode or the iSL value.
Page 15
Figure 4 presents the polarization curves of four different configurations. It considers for each safety limit current density the configuration of FC alone and hybridized. For each configuration at different safety limit current density, the polarization data after nearly 100 h operation and end of life are shown. For iSL = 0.2 A cm-2, the polarization data for FC alone and hybridized were comparable with only difference of maximum 5% (± 2.5 %), which can also be related to measurement accuracy.
Figure 4: Polarization data of different configurations presenting after 100 h and at the end of life operation. FC is for fuel cell alone; FCSC is for the hybrid source; 0.05 and 0.20 are the iSL levels in A cm-2, and cycling times in hours are also given.
On the contrary, for iSL = 0.05 A cm-2, the results of FC alone and hybridized are not comparable. Rather the polarization data at different current densities obtained by FC alone was similar to that of the hybridized but in half lifetime. To verify that, hybridized configuration at half-life (at 737 h) is also presented in the Figure 4. It indicates lower durability for FC alone at iSL = 0.05 A cm-2.
0 0.1 0.2 0.3 0.4 0.5 0.6 0.7 0.8 0.9 1 0 0.2 0.4 0.6 0.8 1 1.2 1.4 C e ll v o lt ag e / V Current density / A cm-2 FC-0.20-89h FCSC-0.20-113h FC-0.20-1350h FCSC-0.20-1401h FC-0.05-100h FCSC-0.05-93h FC-0.05-706h FCSC-0.05-737h FCSC-0.05-1350h
Page 16
4.3. Power decay presenting durability results
The polarization curve recorded at regular interval expresses on the aging induced by the cyclic operation in terms of voltage decay. Thus, to quantify the degradation, the decay percentage of fuel cell power performance was calculated over the lifetime (Figure 5). Comparison of the voltage decay for the various configurations elucidated the impact of SCs on the durability of the FC and FC MEA. FC power was calculated at a current density fixed at 0.8 A cm-2, even though this current density does not correspond to the maximum power in the first hundred hours.
Figure 5: Power decay curves presenting durability.
FC power degradation appears clearly from the plotted variations of the power with time (Figure 5). The red horizontal line represents the degradation threshold, taken at 20 % decay from its initial power output. From Figure 4, the durability of the FC hybridized system can be estimated for different configurations and iSL conditions. On the comparing the FC alone with FC hybridized system at iSL = 0.2 A cm-2, it can be observed that the FC could be operated for comparable time periods – in the order of 1000 hours. On the contrary, at iSL =
0% 5% 10% 15% 20% 25% 30% 35% 0 100 200 300 400 500 600 700 800 900 1000 1100 1200 1300 1400 P o w e r d e ca y / % Time / h Fuel cell (FC) alone,
iSL= 0.05 A cm-2 Performance decay limit FC hybridized with 9000 F supercapacitor (SC), iSL= 0.2 A cm-2 FC hybridized with SC (9000 F), iSL= 0.05 A cm-2 FC alone, iSL= 0.2 A cm-2
Page 17
0.05 A cm-2, the hybridized FC could operate nearly twice longer than the FC alone, which appears more rapidly degraded by the iSL reduction. This long-term test with FC alone at lower iSL was conducted twice and gave similar results. In hybridized FC system, the MEA lifetime was not affected by iSL conditions. Hybridization does not allow to improve the fuel cell durability at high iSL, imposed by the European test protocol, but a real benefit is observed for lower hydrogen waste condition, i.e. at reduced iSL condition.
Power degradation can be associated with various reasons associated with fuel cell design and its operation. As discussed by Ous et al [24], the key aspects of PEM fuel cell degradation that are associated with water formation, retention, accumulation, and transport mechanisms within the cell. These reasons for degradation can be broadly classified into two major categories namely catastrophic and aging. Catastrophic factors are linked to sudden or early failure, whereas aging factors concern natural, regular degradation due to electrochemical reactions.
To investigate the cell degradation, three phases of fuel cell voltage drop over constant current density have been considered, namely stable operation, slow decay of voltage and sudden drop. However, sometimes it is not easy to differentiate the different stages of fuel cell degradation.
Because of the cycling mode in this study, for investigation of voltage decay, the minimum FC voltage was considered since it could present the case in more realistic way as compared to the maximum FC voltage and the mean FC voltage obtained over a cycle.
Figure 6 presents the different phases of the minimum FC voltage decay obtained over a cycle for different configurations at iSL = 0.05 A cm-2. In case of hybrid FC with SC, the voltage decay is visible after 500 h and it gradually continues until 1250 h, then the decay is more rapid. On the contrary, for FC operating alone, the voltage decay trend appears faster than
Page 18
with SC. Moreover, without SC at iSL = 0.05 A cm-2, sudden voltage drops attributed to transient flooding of the cell structure appear with an increased frequency after 400 h or so (Figure 6). This operation had to be stopped after 706 h, with a very low minimum cell voltage. Presumably water evacuation from the non-hybridized cell becoming very problematic, is detrimental to its performance and provokes its nearly twofold faster end-of-life of the fuel cell core. This clearly indicates the catastrophic failure for the FC operating alone at lower iSL condition, in comparison to others which reflect more occurrence of gradual aging, except in the last 100 hours.
Figure 6: Minimum voltage curves for FC alone or hybridized at iSL = 0.05 A cm-2.
4.4. Contributions of cell resistances from Electrochemical Impedance Spectroscopy
For simplicity, the discussion was restricted to two current density levels i.e. 0.2 A cm-2 and 0.8 A cm-2. The results from the current density of 0.2 A cm-2 were more related to transfer kinetics operation whereas mass transfer limitations can be better observed at the higher current density level. Only cathodic data have been discussed. For some operating conditions, the loops for charge transfer and diffusion control were largely overlapped which
Page 19
rendered the separate estimation of resistances delicate. The sum of these two resistances was thus presented for i = 0.8 A/cm2.
Figure 7 shows the time variation charge transfer resistance (Rct) in Figure 7a and diffusion resistance (Rdc) in Figure 7b over a period of aging with the two iSL conditions during hybridized or non-hybridized FC configurations, at 0.2 Acm-2. It is interesting to note in Figure 7a that for iSL = 0.2 A cm-2, regardless of the configuration, and in the hybridized configuration at iSL = 0.05 A cm-2 the trend for Rct was quite similar with slow impact along cycling. We can note a faster increase at the end of life for the FC hybridized at iSL = 0.05 A cm - 2 than for the two other configurations at iSL = 0.2 A cm-2. On the contrary, at iSL = 0.05 A cm-2, the non-hybridized FC configuration exhibited a rapid Rct increase from 300 h, expressing once more the importance of hybridization for low iSL values.
Similarly, Figure 7b reveals that at the higher iSL value, hybridization has no real impact on Rdc, which increases very slowly over time. One can note also a faster increase at the end of life for the FC hybridized at iSL = 0.05 A cm-2 than for the two other configurations at iSL = 0.2 A cm- 2. On the contrary, for the lower iSL value, the time variation for the hybridized FC is approx. two times slower than with the non-hybridized cell, in relation with extended lifetime by hybridization; nevertheless, Rdc values in hybridization mode were drastically larger than those obtained at the end of life at iSL = 0.2 A cm-2.
The sum of resistances (Rct + Rdc) plotted at 0.8 Acm-2 (Figure 7c) shows a slow increase for the higher iSL condition, irrespective of the hybridization mode. This trend is almost similar for lower iSL value in hybridized configuration with a faster growth in the last 200 h of operation. In the case of a non-hybridized configuration, the increase in the resistance sum happens much earlier and this sum reaches 1 Ω cm2 approximately two times faster.
Page 20
Figure 7: Effect of aging; a) – on charge transfer resistance at i = 0.2 A cm-2, b) – on diffusion resistance at i = 0.2 A cm-2 and c) – on the sum (Rct + Rdc) at i = 0.8 A cm-2.
4.5. Fuel crossover from linear sweep voltammetry (LSV)
Permeation of hydrogen through the membrane in terms of current density for the oxidation of flux was plotted with respect to time after 100 h of load cycling (FC_DLC) operation for the four cases investigated (Figure 8a). The fuel crossover varied insignificantly, irrespective of the hybridization and iSL condition except in the last 100 h of all the tests. In the present study, the variations of fuel crossover indicated that the membrane suddenly degrades by local cracks of perforation, after a time lapse depending on the working conditions.
4.6. Electrochemical active surface area (ECSA) from cyclic voltammetry (CV)
Figure 8b shows the comparison of the decrease in the electrochemical active surface area versus time of operation. The ECSA decay rates were found to be comparable for both hybridized or non-hybridized FC operating mode regardless the iSL conditions. ECSA does
0 0.2 0.4 0.6 0.8 1 1.2 1.4 1.6 1.8 0 200 400 600 800 1000 1200 1400 Rct + Rdc / Ω cm 2 Time / h 0.0 0.2 0.4 0.6 0.8 0 200 400 600 800 1000 1200 1400 Rct / Ω cm 2 Time / h 0 0.2 0.4 0.6 0.8 1 1.2 1.4 0 200 400 600 800 1000 1200 1400 Rdc / Ω cm 2 Time / h Hybridized FC; iSL= 0.05 A cm-2 Hybridized FC; iSL= 0.20 A cm-2 FC alone; iSL= 0.05 A cm-2 FC alone; iSL= 0.20 A cm-2
Page 21
not give information on the aging mode, or at least, the catalytic layer does not seem to be particularly impacted by the operating conditions.
Figure 8: a) Fuel crossover for the four different configurations. b) Electrochemical active surface area for the four different configurations.
4.7. SEM observations
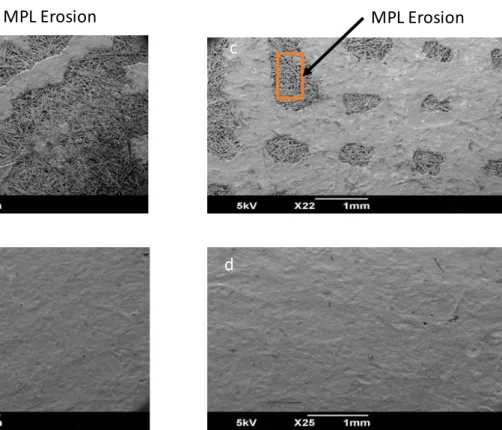
The results presented above led us to focus on the gas diffusion layers (GDL). Only results for iSL = 0.05 A cm-2 are presented since at iSL = 0.2 A cm-2, comparable observations were made on the microporous layer (MPL). In that respect, samples cut from the aged GDLs were observed by SEM both on the MPL side from the cathode and the anode. Figures 9a and 9b present the aged GDL after 706 h of operation from the FC alone under low iSL condition. They were compared with the GDL samples from the hybridized FC at iSL = 0.05 A cm-2 (Figures 9c and 9d) after 1350 h of operation. The anode side does not reveal any MPL erosion irrespective of the configuration. The cathodic GDL submitted to both mechanical stress and more troublesome water evacuation with such a low iSL level was locally delaminated, rendering water management still worse. As a matter of fact, in local areas under the flow pattern channels, the macroporous substrate appears visibly for the two hybridization modes (Figure 9a and c). Analysis of numerous images of the cathode GDL (data not shown) revealed comparable erosion under the channels for both hybridized and non-hybridized FC
0 1 2 3 4 5 6 7 0 200 400 600 800 1000 1200 1400 Hyd ro ge n c ro ss o ve r / m A cm -2 Time / h 0 20 40 60 80 100 120 140 160 180 0 200 400 600 800 1000 1200 1400 EC SA / cm 2P t cm -2e le ct ro d e Time / h b) a)
Page 22
operating mode, but the non-hybridized FC at iSL = 0.05 A cm-2 degraded in almost halftime as compared to other experiments.
Figure 9: SEM images for aged GDLs at iSL = 0.05 A cm-2 for configurations of FC alone after 706 h (a – cathode side and b – anode side) and hybridized FC after 1350 h (c – cathode side and d – anode side).
4.8. Permeability
To confirm and quantify the above observations, gas permeability across the GDL was measured before (reference GDL) and after ageing tests.
The experiments were carried out first, in the through-plane direction and later repeated in the in-plane direction. Further, the pressure gradients versus the average flow velocity profiles (for all the GDLs) were obtained and could be fitted to rel. (1) (figure not shown), leading to permeability estimate. The measurements were repeated for 3 times: the deviations between the data obtained for a given fuel operating mode led to estimate the uncertainty below 10%. The results are presented in Table 1.
MPL Erosion c
MPL Erosion a
Page 23
Through-plane permeability (10-14 m2) ± 10%
In-plane permeability (10-12 m2) ± 10%
Anode Cathode Anode Cathode
Reference GDL 4.67 4.32 6.90 7.99
FC alone, iSL 0.05 A cm-2 4.44 140 7.63 8.41
FC+SC, iSL 0.05 A cm-2 4.53 17.7 7.59 7.67
FC alone, iSL 0.2 A cm-2 3.99 197 8.55 9.89
FC+SC, iSL 0.2 A cm-2 3.80 24.1 8.49 9.79
Table 1: Through-plane and in-plane gas permeability values for hybridized and FC alone configurations at two iSL conditions.
In all cases the through-plane permeability values are lower than the in-plane permeability values. As the resistance generated by the MPL to the gas flow is less noticeable with in-plane than through-plane since the fluid flow is parallel in the MPS and the MPL whereas it has to pass through these two layers in series for through-plane determination.
At the anode sides, the through-plane and in-plane gas permeability values were found to be little dependent on the hybridization mode and iSL values, and comparable to those of the reference GDL, confirming the SEM observations (Figure 9b and d).
At the cathode side, for the in-plane viscous permeability a minor change is observed. However, the through-plane permeability values for both iSL values at the cathode GDL present a 30 or 40-times increase in FC alone configuration than that of the reference fresh GDL. Permeability values appear comparable at the two studied safety limit currents, but at iSL = 0.2 A cm-2 ageing time was doubled. With hybridization, the increasing factor is nearly 4 at 0.05 A cm-2 and 6 at 0.2 A cm-2. The values obtained for the cathode end GDLs are clearly supported by the SEM observations (Figure 9 and Section 4.7). Indeed, the MPL resistance is decreased by its erosion, the pressure gradient is thus reduced resulting in only through-plane permeability increase.
Page 24
5. Conclusions
Conclusive remarks are given below.
1. With the usual operation (iSL = 0.2 A cm-2), the fuel cell current is mostly lower than the safety limit current in the 840 first seconds of the cycle, with low energy demand: in this part of the cycle, efficient water evacuation from the cell occurs by the excess of air at the cathode. By reducing the safety limit current density (iSL), the current density delivered by the cell is usually larger than this limit, which reduces the oversupply.
2. Fuel cell cycling operation with a reduced safety limit current by a fourfold factor has been presented efficiently to save hydrogen: hydrogen overfeeding rate found at 54% in FC-DLC regular cycling mode (without hybridization), can be reduced to 20% by reduction iSL level and upon hybridization of the fuel cell.
3. Without hybridization, reducing iSL from 0.2 to 0.05 A cm-2 for the sake of lower hydrogen overfeeding is possible but was shown to be detrimental to the fuel cell state of health and its durability. Sudden voltage drops attributed to transient flooding were more frequently observed over time. Degradation of the cell concerns mainly the microporous layer which was locally delaminated from the macroporous layer, resulting in the cell end-of-life withing nearly half of its lifetime with the usual iSL level.
4. Hybridization of the cell by SC allows further hydrogen saving to 20% only. Even though the MPL also suffered from the more difficult evacuation of water in the cycle periods with very low gas flow rates, the fuel cell could nevertheless be operated without sudden voltage drops and with a lifetime equivalent to that with iSL= 0.2 A cm-2.
5. Further tests with larger fuel cells and stacks are currently in progress to assess the benefit of hybridization in more real energy conversion systems.
Page 25
Acknowledgments
This work was supported by the French PIA project «Lorraine Université d’Excellence», reference ANR-15-IDEX-04-LUE for the Ph.D. Grant allocated to D. Arora.
Page 26
References
[1] Trust C. Polymer Fuel Cells – Cost reduction and market potential. Carbon Trust 2012:1 - 38. https://www.carbontrust.com/resources/reports/technology/polymer-fuel-cells-cost-reduction-and-market-potential/
[2] Alaswad A, Baroutaji A, Achour H, Carton J, Al Makky A, Olabi AG. Developments in fuel cell technologies in the transport sector. Int J Hydrogen Energy 2016;41:16499– 508. doi:10.1016/j.ijhydene.2016.03.164.
[3] Olabi AG, Khatib FN, Baroutaji A, Wilberforce T, Carton JG, El-Hassan Z, et al. Developments of electric cars and fuel cell hydrogen electric cars. Int J Hydrogen Energy 2017;42:25695–734. doi:10.1016/j.ijhydene.2017.07.054.
[4] Bansal RC, Lukic SM, Emadi A, Jian Cao, Rodriguez F. Energy Storage Systems for Automotive Applications. IEEE Trans Ind Electron 2008;55:2258–67.
doi:10.1109/tie.2008.918390.
[5] Tsotridis G, Pilenga A, Marco G De, Malkow T. EU harmonised test protocols for PEMFC MEA testing in single cell configuration for automotive applications. 2015. doi:10.2790/54653.
[6] Hegazy O, Van Mierlo J, Lataire P, Coosemans T, Smenkens J, Monem MA, et al. An evaluation study of current and future Fuel Cell Hybrid Electric Vehicles powertrains. 2013 World Electr. Veh. Symp. Exhib., IEEE; 2013, p. 1–8.
doi:10.1109/EVS.2013.6915042.
[7] Feroldi D, Serra M, Riera J. Design and analysis of fuel-cell hybrid systems oriented to automotive applications. IEEE Trans Veh Technol 2009;58:4720–9.
doi:10.1109/TVT.2009.2027241.
[8] Rodatz P, Paganelli G, Sciarretta A, Guzzella L. Optimal power management of an experimental fuel cell/supercapacitor- powered hybrid vehicle. Control Eng Pract 2005;13:41–53. doi:10.1016/j.conengprac.2003.12.016.
[9] Li T, Liu H, Zhao D, Wang L. Design and analysis of a fuel cell supercapacitor hybrid construction vehicle. Int J Hydrogen Energy 2016;41:12307–19.
doi:10.1016/j.ijhydene.2016.05.040.
[10] Moreno J, Ortúzar ME, Dixon JW. Energy-management system for a hybrid electric vehicle, using ultracapacitors and neural networks. IEEE Trans Ind Electron 2006;53:614–23. doi:10.1109/TIE.2006.870880.
[11] Yufit V, Campbell J, Brandon NP, Wu B, Offer GJ, Martinez-Botas RF. Simulated and Experimental Validation of a Fuel Cell-Supercapacitor Passive Hybrid System for Electric Vehicles, 2013, p. 5.2-5.2. doi:10.1049/cp.2013.1900.
[12] Gérardin K, Raël S, Bonnet C, Arora D, Lapicque F. Direct Coupling of PEM Fuel Cell to Supercapacitors for Higher Durability and Better Energy Management. Fuel Cells 2018;18:315–25. doi:10.1002/fuce.201700041.
[13] Arora D, Gérardin K, Raël S, Bonnet C, Lapicque F. Effect of supercapacitors directly hybridized with PEMFC on the component contribution and the performance of the system. J Appl Electrochem 2018;48:691–9. doi:10.1007/s10800-018-1188-0.
[14] Yuan X-Z, Song C, Wang H, Zhang J. PEM Fuel Cells and their Related Electrochemical Fundamentals. Electrochem. Impedance Spectrosc. PEM Fuel Cells, London: Springer London; 2009, p. 1–37. doi:10.1007/978-1-84882-846-9_1.
[15] Ciureanu M, Roberge R. Electrochemical impedance study of PEM fuel cells. Experimental diagnostics and modeling of air cathodes. J Phys Chem B 2002;105:3531–9. doi:10.1021/jp003273p.
Page 27
[16] Inaba M, Kinumoto T, Kiriake M, Umebayashi R, Tasaka A, Ogumi Z. Gas crossover and membrane degradation in polymer electrolyte fuel cells. Electrochim Acta 2006;51:5746–53. doi:10.1016/j.electacta.2006.03.008.
[17] Lapicque F, Bonnet C, Huang BT, Chatillon Y. Analysis and Evaluation of Aging Phenomena in PEMFCs. Adv Chem Eng 2012;41:265–330. doi:10.1016/B978-0-12-386874-9.00009-9.
[18] Sakai T. Gas Permeation Properties of Solid Polymer Electrolyte (SPE) Membranes. J Electrochem Soc 2006;132:1328. doi:10.1149/1.2114111.
[19] Chaparro AM, Martín AJ, Folgado MA, Gallardo B, Daza L. Comparative analysis of the electroactive area of Pt/C PEMFC electrodes in liquid and solid polymer contact by underpotential hydrogen adsorption/desorption. Int J Hydrogen Energy 2009;34:4838– 46. doi:10.1016/j.ijhydene.2009.03.053.
[20] Yu S, Li X, Li J, Liu S, Lu W, Shao Z, et al. Study on hydrophobicity degradation of gas diffusion layer in proton exchange membrane fuel cells. Energy Convers Manag 2013;76:301–6. doi:10.1016/j.enconman.2013.07.034.
[21] Tseng CJ, Lo SK. Effects of microstructure characteristics of gas diffusion layer and microporous layer on the performance of PEMFC. Energy Convers Manag 2010;51:677–84. doi:10.1016/j.enconman.2009.11.011.
[22] Gostick JT, Fowler MW, Pritzker MD, Ioannidis MA, Behra LM. In-plane and through-plane gas permeability of carbon fiber electrode backing layers. J Power Sources 2006;162:228–38. doi:10.1016/j.jpowsour.2006.06.096.
[23] Lapicque F, Belhadj M, Bonnet C, Pauchet J, Thomas Y. A critical review on gas diffusion micro and macroporous layers degradations for improved membrane fuel cell durability. J Power Sources 2016;336:40–53. doi:10.1016/j.jpowsour.2016.10.037. [24] Ous T, Arcoumanis C. Degradation aspects of water formation and transport in Proton
Exchange Membrane Fuel Cell: A review. J Power Sources 2013;240:558–82. doi:10.1016/j.jpowsour.2013.04.044.
[25] Mukherjee M, Bonnet C, Lapicque F, Through-plane and in-plane permeability across gas diffusion layers (GDLs): comparison with equivalent permeability of GDLs inserted in bipolar plates for PEM fuel cells, submitted to International Journal of Hydrogen Energy (2019)
![Figure 1: Home-made cell to measure in-plane and through-plane permeabilities – a) design and b) actual cell [25]](https://thumb-eu.123doks.com/thumbv2/123doknet/14531769.533778/12.892.122.784.240.459/figure-home-measure-plane-plane-permeabilities-design-actual.webp)