Constraints on Passive Margin Escarpment Evolution from River Basin Reorganization in Brazil by
Madison M. Douglas
Submitted to the Department of Earth, Atmospheric and Planetary Sciences in Partial Fulfillment of the Requirements for the Degree of
Bachelor of Science in Earth, Atmospheric and Planetary Sciences at the Massachusetts Institute of Technology
June 3, 2016
2016 Madison M. Douglas. All rights reserved.
The author hereby grants to MIT permission to reproduce and to distribute publicly paper and electronic copies of this thesis document in whole or in part in any medium now known or hereafter created.
Author
Signature redacted
Department of Earth, Atmospheric and Planetary Sciences May 11, 2016
Certified
Signature redacted
C brtifedby_ J. Taylor Perron Thesis Supervisor
Ae
Signature redacted
Accepted by_ARCHIVE8
MASSACHUSETTS INtSTITUTE OF TECHNOLOGYSEP 28 2017
Tanja Bosak Chair, Committee on Undergraduate ProgramConstraints on Passive Margin Escarpment Evolution from River Basin Reorganization in Brazil Madison M. Douglas
Department of Earth, Atmospheric and Planetary Sciences Massachusetts Institute of Technology
Acknowledgements:
I would like to thank the MIT geomorphology community; in particular Kimberly Huppert, Maya Stokes,
Dino Bellugi, Seulgi Moon, and Paul Richardson; for providing feedback and encouragement on this project and over the past four years. I would also like to thank Lucia Silva and Nelson Fernandes for
providing insights and assistance into the geology and geomorphology of Brazil, as well as published
cosmogenic erosion rates for the region. Finally, I would like to thank the EAPS undergraduates and EAPS writing advisor Jane Connor, who have provided advice, good cheer and support for this thesis over PB & J sandwiches every week.
Table of Contents
Abstract 5
1. Introduction: Evolution of Passive Margin Escarpments 6
2. Background 8
2.1 The Formation and History of the Brazilian Escarpments 8
2.1.1 Overview and Timing 8
2.1.2 Study Sites 9
2.2 Tracking the Evolution of Drainage Networks 10
2.2.1 Drainage Basin Evolution 11
2.2.2 The Stream Power Law and Chi 13
3. Methods 16
3.1 Constructing Chi Plots 16
3.2 Calculating Drainage Area Exchange 17
4. Results 19
4.1 Elevation vs. Chi Profiles 19
4.2 Comparing Chi to Cosmogenic Erosion Rates 19
4.3 The Importance of Stream Captures 22
5. Discussion 22
5.1 Constraints on Passive Margin Escarpment Evolution 22
5.2 Stream Capture and Escarpment Retreat 24
6. Conclusions 25
Appendix I: "'Be Erosion Rates 27
Appendix II: Supplementary Maps and Chi Plots of Field Sites 30 Appendix Ill: Escarpment Retreat Rates vs. Distance to Coastline 36
References 37
Abstract
Escarpments are present on passive margins around the world, but their evolution is poorly
understood. Some geologists interpret escarpments as stationary features, whereas others have argued
that they are retreating inland faster than a kilometer per Myr. I investigate Brazilian escarpments by determining whether or not the river networks on either side of the escarpment are in erosional
equilibrium with each other. My approach is based on the premise that rivers on opposite sides of a
stationary escarpment would be eroding at the same rate (erosional equilibrium), whereas rivers on opposite sides of a mobile escarpment would be eroding at different rates (erosional disequilibrium). I use a recently developed technique called chi mapping to assess the erosional disequilibrium of river
networks along the Brazilian escarpments. For comparison, I also compile erosion rates on either side of
the escarpments from cosmogenic "Be measurements in the existing literature, and use these to calculate recent retreat rates of the escarpments, which fall between 4 and 40 m/Myr. I determine that chi mapping and cosmogenic erosion rates agree on the direction of escarpment movement, but disagree on the magnitudes of the retreat rates. I also estimate the percentage of drainage area
exchanged by stream capture as the escarpment drainage divide moves across the landscape. Using two different estimation methods, I find that less than 40% of drainage area is exchanged by stream capture, making divide migration the dominant mechanism for drainage basin reorganization. If my estimates of recent escarpment retreat rates are representative of long-term rates, the Brazilian escarpments have retreated up to 5 km since their formation during the Cretaceous rifting event. My analysis shows that the topographic retreat of the Brazilian escarpments could have been driven by drainage basin
1. Introduction: Evolution of Passive Margin Escarpments
Passive margin escarpments are observed around the world, though interpretations of their
evolution vary widely. Theories of escarpment formation and evolution must account for their longevity
over tens of millions of years, their formation along rift zones near the coast, and the potential erosional retreat of escarpments inland. Traditionally, escarpments are thought to be formed as normal fault
scarps along the continental margin during rifting events (Figure 1A; Braun & van der Beek, 2004). Then,
high erosion rates along the escarpment face cause the scarp to retreat inland to the slowly eroding continental plateau. In contrast, escarpments may also form when an oceanic rifting event elevates a pre-existing drainage divide within the continent, which then incises the newly formed coastal plateau
back to the stationary divide (see figure 1B; Sacek et al., 2012; Matmon et al., 2002). Both the parallel
retreat and stationary divide scenarios may be influenced by post-rifting flexural responses and
magmatic activity, further complicating their erosional histories (Braun & van der Beek, 2004; Gallagher & Brown, 1997).
Various studies have used rock exhumation rates derived from apatite fission track (AFT) datasets, basin-averaged erosion rates from cosmogenic radionuclides (CRN), and geologic and
morphometric analyses to constrain the retreat rates of escarpments. These methods generate a variety of estimated escarpment retreat rates and proposed mechanisms for retreat for the same escarpment, indicating that passive margin escarpment evolution is still poorly understood. For instance, the Great Escarpment of Australia may have experienced sustained retreat rates of up to 2 km/Myr according to the parallel retreat model of escarpment formation (Seidl et al., 1996). However, "Be erosion rates along the escarpment do not exceed -35 m/Myr, though the escarpment face is eroding more rapidly the continental interior and coastal plain, indicating the escarpment is retreating less than 35 m/Myr (Heimsath et al., 2006). Therefore morphometric and CRN erosion rates agree that the Great
Escarpment of Australia is retreating, but disagree by around two orders of magnitude on the rate of retreat. A similar discrepancy occurs along the Drakensberg escarpment in South Africa, where AFT borehole records indicate higher denudation rates from -91-69 Ma than those determined by 3 6
CI CRN
studies, indicating a potential for higher escarpment retreat rates in the past (Moore & Blenkinsop,
2006; Flemming et al., 1999). Matmon et al.'s (2002) time-for-space substitutions found global escarpments to be stationary, with escarpments increasing in sinuosity with age. In contrast, "Be and
16Al measurements along the Namibian escarpment indicate a slow retreat rate of 10 m/Myr, due to local river networks being close to equilibrium (Bierman & Caffee, 2001; Cockburn et al., 2000). The
discrepancies between AFT and CRN erosion rates may indicate that escarpments erode more rapidly
early in their life, since AFT denudation rates extend from the time since rifting that the sample was last cooled below the closure temperature (typically >10 Ma), while '0Be erosion rates indicate slower
erosion and retreat of escarpments over the last -100 ka.
In summary, while independent methods have been applied to study escarpment retreat, they
generally found lower retreat rates on shorter timescales and higher retreat rates on longer timescales, but do not have sufficient temporal resolution to determine the lifecycle of an escarpment (Balestrieri et al., 2000). In particular, AFT also records events such as magmatic intrusions and tectonic reactivation in addition to denudation, making it difficult to distinguish between the parallel retreat and fixed divide models of escarpment formation (Braun & van der Beek, 2004; Gallagher & Brown, 1997). However, all models of escarpment retreat include rivers as an important agent in determining the morphology and
location of the escarpment by driving the movement and persistence of their drainage divides.
Therefore, analysis of river networks has the potential to fill in the gaps in the timeline of escarpment retreat, since passive margin rivers record episodes of tectonic rejuvenation and disequilibrium over a long time through stream captures and knickpoints (a steepened reach of a river that typically
propagates upstream as an erosional wave). In addition, models of escarpment retreat rely on bedrock
rivers' erosional power, which has been studied extensively (Howard & Kerby, 1983).
In this paper, I develop a new, independent method of determining whether, and in which direction, an escarpment is moving using recent advances in the analysis of bedrock river networks. I apply this method to several escarpments in Brazil and compare the results with escarpment retreat directions and rates derived from published cosmogenic Be erosion rates. I also determine the mechanisms that exchange drainage area between evolving basins. Following this introduction, in section 2.11 give an overview of the formation of the Brazilian Escarpments and my study sites. In
section 2.2 1 outline current thinking on river network evolution and reorganization, particularly focusing
on the development of chi mapping as a tool to understand river network disequilibrium. In section 3, I outline my methods, and in sections 4 and 5 I present and then discuss my results in the context of the Brazilian passive margin system and as a validation of chi mapping as a tool to assess escarpment retreat.
A. Stationary Drainage Divide
-\ t
t2j
present
.1
Rift
B. Migrating Drainage Divide
\t 4 t3 2
present
*
\
,\
Rift
Figure 1. Conceptual models of escarpment evolution. A) An escarpment forms parallel to the rift zone and is rapidly eroded down to a prominent inland drainage divide. B) The formation of the escarpment creates a new drainage divide which gradually migrates inland along with the escarpment. Note that both scenarios A and B may incorporate variable escarpment retreat rates through time. Adapted
from
Prince et al., 2010.
2. Background
2.1 The Formation and History of the Brazilian Escarpments
2.1.1 Overview and Timing
The creation of the Brazilian passive margin began with the breakup of Gondwana after the Brasiliano-Pan-African orogeny. Continental breakup began between 140-130 Ma and seafloor spreading began -113 Ma along the coast of southeastern Brazil (Gallagher et al., 1994). The rifting event coincided with the deposit of the Parana flood basalts -130 Ma in a failed inland rift valley
(Gallagher et al., 1994). These events were followed by late Cretaceous magmatism and fault
reactivation ~80 Ma which likely caused non-orogenic uplift of the escarpments (Salgado et al., 2014;
Hiruma et al., 2010).
Brazil
*
city
*
Study
Site
Espinhago Range
B l
Serra do Mar
Escarpment
1000 km
Rio de Janeiro
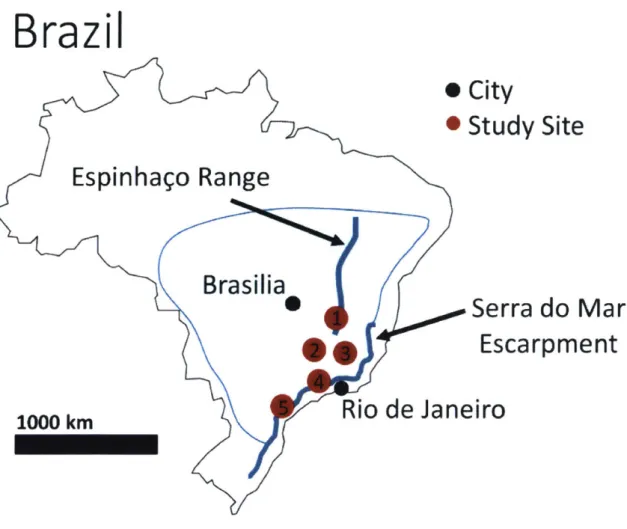
Figure 2. The locations of study sites. 1) EspinhaFo Range, Barreto et al., 2013 2) Cristiano Otoni Step, Cherem et al., 2012 3) Sdo Geraldo Step, Cherem et al., 2012 4) Serra do Mantiquelra and Serra do Mar (North), Salgado et al., 2016 & Rezende et al., 2013 5) Serra do Mar, Salgado et aL., 2014.
2.1.2 Study Sites
In this study, I examine all locations along escarpments in Brazil with published cosmogenic erosion rates on opposing sides of the escarpment (Figure 2). These sites contain a range of lithologies and climatic regimes, but all exhibit strong lithologic controls on river geometry, creating acute or angular bends in steam channels (Salgado et al., 2014). Many sites also experience a large range of precipitation, up to ~1200 mm/yr at a single site (Magaldi, 2013). The first locations I consider are located along the Serra do Mar escarpment on the southeastern coast of Brazil. In the locations examined by Salgado et al. (2014), the coastal plain has an average of 100 m elevation while the highlands have on average 800 m elevation, with a mountain range marking the escarpment. The
bedrock is composed of granites and dikes intruding into much older, Archean gneisses and migmatites.
The region also exhibits N-S and NE-SW trending structures, and receives an average annual
precipitation varying from 1425 mm/yr in the highlands to 3600 mm/yr on the mountain range due to
orographic effects, with the coastal plain receiving the ~1935 mm/yr.
Farther north, I consider the Serra do Mar, hereafter referred to as "Serra do Mar (North)", and
inland Serra da Mantiqueira, which have erosion rates measured by Salgado et al. (2016) and Rezende et al. (2013). In this location on the coast, the Serra do Mar (North) develops into a dissected plateau up to 2000 m high with steep slopes on either side. Moving inland past the Serra do Mar (North) and across a valley, the Serra da Mantiqueira is a graben parallel to the coastline reaching up to 2700 m before
leveling off to a continental plateau. The "double escarpment" was formed -58-20 Ma due to crustal subsidence, and exhibits numerous stream captures and asymmetric valleys that indicate that the local
fluvial systems have yet to equilibrate (Salgado et al., 2016). The escarpments are primarily composed of
granite and gneiss from the Ribeira belt, and contain ENE trending shear zones (Salgado et al., 2016). Precipitation varies highly across the area, between 1700-3000 mm/yr, with both escarpments receiving higher precipitation on their windward slopes and lower rainfall on their continental slopes.
Farther inland, I examine the Sdo Geraldo and Cristiano Otoni steps formed at the divide between the headwaters of three major rivers: the Silo Francisco, Doce, and Paraiba do Sul (Cherem et al., 2012). The Cristiano Otoni escarpment is up to 350 m high while the Sdo Geraldo is up to 550 m high. Both are composed primarily of granitoid rocks, contain few major structures, and have relatively uniform precipitation (only varying by -100 mm/yr geographically).
Finally, I examine the southern Espinhago Range, located on the edge of the Sao Francisco craton where a rift-sag basin formed after the Brasiliano orogeny created a significant topographic break (Barreto et al., 2013). The range is composed of quartzite from the Espinhago Supergroup, carbonates from the Bambui group, and a basement of granites and gneiss. Precipitation also varies significantly, from 1200 to over 1500 mm/yr due to orographic effects.
2.2 Tracking the Evolution of Drainage Networks
Recent advances in geomorphology have paved the way for a more quantitative understanding of river network reorganization. Here I provide a brief overview of how disequilibrium river networks
evolve towards equilibrium, and then explain a technique that has recently been developed for
determining disequilibrium between basins.
2.2.1 Drainage Basin Evolution
Bedrock rivers are frequently described as being either in a state of equilibrium, where fluvial incision rates match tectonic uplift rates to create a steady state profile of elevation versus distance upstream, or in a state of disequilibrium, where either uplift or incision outpaces the other. But river basins can also be in a state of disequilibrium with respect to each other, where one tributary with a
higher erosion rate than its neighboring rivers will tend to expand its drainage area by shifting drainage
divides farther away from itself and towards neighboring streams. Applying this concept to the case of passive margin escarpments, a migrating escarpment would experience a higher average erosion rate along its steep face than on the continental plateau, whereas a stationary escarpment would have equal
erosion rates on either side of the topographic break. Recent developments in CRN techniques, where
the quantity of '0Be in fluvial sediment can be measured to extract a basin-averaged erosion rate, have allowed improved estimates of escarpment movement (von Blanckenberg, 2005). However, measuring erosion rates with CRNs requires substantial time and financial investment in the field and laboratory. In addition, CRNs do not indicate the mechanisms by which drainage divides are reorganizing, only that they are not in equilibrium.
Neighboring drainage basins that are not in equilibrium with each other typically seek equilibrium by exchanging drainage area through two end-member cases: stream capture and drainage divide migration (Bishop, 1995). Drainage divide migration occurs slowly, driven by differences in erosion rates across a divide, and overwrites the river geometry as the divide migrates (Figure 3; Bishop, 1995). In contrast, stream capture, sometimes called stream piracy, occurs when one river erodes into a competing basin and captures its tributary, sometimes even reversing the direction of channel flow (Bishop, 1995). Stream capture preserves the geometry and ecosystem of the captured tributary, and captured reaches are often distinguished by their 'fishhook' geometries, the presence of wind gaps (former river channels that no longer experience fluvial activity), a distinct freshwater ecology, and sediment provenance (Johnson, 1907; Davis, 1895).
ci)
0~
',&Is. I I I I / / / /TIME
I
Divide migration:
Drainage lines erased
C
IY
do
Catue Dranae lne prseve
Figure 3. End-member mechanisms of river network adjustment. Both drainage divide migration and
stream capture have been documented in evolving river networks, but they occur over long timescales which has inhibited efforts to determine the relative importance of the two processes. During divide migration the drainage divide shifts gradually, erasing the previous drainage network as it moves. During stream capture a rapidly growing stream cuts off a tributary from its neighbor, preserving the tributary's original path and creating a barbed geometry in the river. Modified from Bishop (1995).
Determining whether basins are evolving primarily through stream capture or divide migration has proved challenging, though divide migration is hypothesized to be the dominant form of basin evolution (Bishop, 1995). The distinctive geometries of stream capture can also be caused by faults or changes in lithology along the river course (Twidale, 2004). Additional uncertainty in the locations of stream captures comes from their occurrence over a long time scale, leading to a dearth of empirical
observations of captures and constraints on which locations have experienced capture. In addition,
other methods of identifying the locations of stream capture also record the signatures of tectonic uplift and increased incision, making it difficult to disentangle the drainage basin evolution as stream captures typically occur in rapidly evolving landscapes (Brocard et al., 2012). Furthermore, these methods are typically applied in regions with active tectonics, which may contain more numerous faults and higher
lithologic variation over a small area, further convoluting stream capture geometries with asymmetries 12
in drainage basins due to structural controls on the landscape (Prince et al., 2011). However, in any
region, rapidly incising rivers may wipe out the evidence of their capture, leaving maps of captured stream reaches incomplete.
Stream capture is not just an important process in river evolution, but also impacts the ecological
diversity of freshwater species in rapidly evolving landscapes. Numerous studies link stream captures to
expanding ranges and genetic diversification of freshwater fish, and new compilations of DNA and mitochondrial RNA (mRNA) mutation rates allow ecologists to estimate the time of stream capture using the genetic divergence of subspecies (Zemlack et al., 2008; Craw et al., 2006; Waters et al., 2001).
However, stream capture is not the only process that can be responsible for mixing of fish populations: Waters et al. (2001) propose a wide range of scenarios leading to the splitting of populations between rivers, including the joining of rivers as tributaries during low sea levels that then are separated after
glacial recession. A better understanding of the prevalence and dynamics of stream capture will help to
define the link between plate tectonics and biodiversity.
2.2.2 The Stream Power Law and Chi
Chi mapping is a quantitative mapping technique developed by Perron & Royden (2013) and
Willett et al. (2014) that can be used to identify river network disequilibria and forecast drainage divide
motion over large regions. It is based on the stream power law (Whipple & Tucker, 1999), a commonly used expression for fluvial incision rate E with a dependence on stream drainage area A and slope S:
E = KA"'S" (1)
The exponents m and n combine parameters for the basin hydrology and stream geometry, typically with m/n having a value of -0.2-0.6 and m assumed to be unity. The coefficient of incision K
characterizes the basin hydrology, stream discharge, channel width and depth, bedrock lithology and
empirical constants such as the density of water and the gravitational acceleration g. A detailed derivation of the stream power law, including the fluvial and geometric constants that are combined in
K, can be found in Snyder et al. (2000). Note that applying the stream power law implicitly assumes that
there is not a critical basal shear stress necessary to incise into bedrock. While grouping so many
parameters together in m, n, and K leads to problems in isolating climatological and geological effects on rivers, the stream power law matches empirical studies relatively well and serves as a useful description of long-term bedrock river incision (Wobus et al., 2006). Due to the high variation in annual precipitation
within our study sites, I choose to include average annual precipitation P as a separate variable, using
the same equations as Yang et al. (2015).
Perron & Royden (2013) developed chi x to normalize the distance upstream in a river profile by the river's drainage area to better compare river profiles in changing tectonic regimes. They used a river
profile evolution model based on the stream power law:
az U - KP(x)mA(x)m a (2)
Assuming the system to be at steady state (dz/dt = 0), the equation is integrated with respect to x to yield:
z(x) = Z(Xb) + f, (KPxlm)' dx' (3)
with z(xb) as a base level, x as the distance upstream from that base level, and x' a dummy variable. When normalized by an arbitrary drainage area AO and annual precipitation rate Pa, the equation transforms to:
z(x) = Z(Xb) + (KPmAm) X (4)
x
= fx x'))n/n dx'(5)
When stream profiles are plotted as elevation versus chi, rivers at equilibrium form straight lines, with rivers that have different ratios of U/K exhibiting different slopes (Figure 4). These plots also align knickpoints propagating upstream through tributaries that were caused by the same change in base level of the main stem, and plot tributaries co-linearly with the main stem of a river for the appropriate parameterization of the stream power law. For bedrock rivers that are not in equilibrium, the difference in chi values at the channel heads across a drainage divide indicate whether the river profile is evolving to a steeper or gentler slope (Willett et al., 2014). When mapped across a tectonically active region, drainage divides are expected to shift away from tributaries with lower chi values and towards tributaries with higher chi values (Figure 4). These predictions were validated by Willett et al. (2014), who examined the retreat of the Blue Ridge Escarpment in the Southeastern United States and found measured divide migration directions correlated with the predictions made by chi maps, while the difference in basin erosional rates correlated with the difference in chi across a divide. The authors also showed that a sub-basin that was formerly part of the Apalachicola River headwaters but was captured 14
River Profile Gaining Drainage
Area to Equilibrium Equilibrium Stream Profile
River Profile Losing Area to Equilib
Drainage rium
x
X
Figure 4. Simplified Illustration of the Chi mapping technique. A) A
longitudinal
stream profile mapped
in elevation vs chi space demonstrates how expanding drainage basins have concave downwards profiles
with lower values of chi at the tips of their tributaries, while contracting basins have concave upwards
profiles and higher values of chi at the tips of their tributaries. B) Two drainage basins in plan view show
that the divide is moving to the left to put the basins at equilibrium with each other. Adapted from
Willett et al., 2014.
by the Savannah River stands out because of its different slope along the captured reach in an elevation
vs chi plot. Chi mapping has also been used to identify a potential mechanism for the formation of
low-relief surfaces in mountain ranges (Yang et al., 2015), emphasizing the rising role of chi maps and
profiles in determining regional trends in drainage basin evolution to supplement more time-consuming
and costly cosmogenic erosion rates (Laue et al., 2015).
Z
Z(Xb)-Xb
> \V \
/
*00'
,Mwe
3. Methods
3.1 Constructing Chi Plots
To calculate chi, I first downloaded 3 arc-second resolution hydrologically corrected SRTM elevation data from HydroSHEDS DEMs for Brazil (Lehner et al., 2008). To facilitate calculating chi, I then re-projected the data using ArcGIS to 90 m/pixel resolution in UTM before computing flow direction, flow accumulation, and flow length for my study sites. A visual check of accumulation grids derived from the original 3-arc second product and my projected DEM revealed no significant changes in stream
location occurred during projection. Similarly, I download a shapefile map of mean annual precipitation
for Brazil from 1977-2006 published by Brazil's Agencia Nacional de Aguas (National Water Agency) and interpolated a 90 m precipitation grid for each study site (Magaldi, 2013).
Next, I used equation 5 to calculate the values of chi upstream from a specified base level elevation for stream profiles in MATLAB. I compiled published "Be erosion rates from the sources in
Table 1 as well as an updated compilation from Sosa-Gonzales et al. (in press), and used those locations
as my study sites for calculating chi (see Appendix I for the erosion rate compilation). For all drainage basins, I used a minimum drainage area of 106 M2
, a drainage area normalization constant AO of 107 M2,
and a precipitation normalization constant PO of 1000 mm/year. For each study site I picked a value of
m/n by constructing chi profiles for a range of m/n and selecting the value that collapsed most
tributaries to the main stems of the rivers and made the river profiles the least concave on either side of the escarpment (Table 1; Willett et al., 2014). However, because the differences in chi across
escarpment divides are very large, the value of m/n did not significantly affect my results.
Values of chi were then calculated moving upstream from a base level elevation above which all
the analyzed channels in a given study area are incising into bedrock (Table 1). To determine the
Location m/n Base Level zb (m)
S5o Geraldo Step 0.35 270
Cristiano Otoni Step 0.35 500
Espinhaeo Range 0.35 445
Serra da Mantiqueira 0.50 345
Serra do Mar (South) 0.25 25
Serra do Mar (North) 0.40 25
Table 1. Values of m/n and base levels used to calculate chi upstream at each published location.
appropriate base level, I examined DEMs, stream profile geometry and Google Earth imagery to
determine the minimum elevation where the river's path was dominantly controlled by the surrounding bedrock and it is not sweeping across wide, alluviated plains. The calculated chi values could then be
mapped onto Google Earth Imagery, DEMs, and plotted as elevation versus chi in longitudinal stream
profiles. I also compared the values of chi for the main rivers in each basin across drainage divides with
cosmogenic nuclide erosion rates to determine if the sign of the difference in chi value across the
drainage divide (AyXf-) matches that of the difference in erosion rate, and to see if there are any regional trends in AX.
Using the average '1e erosion rate and slope of the basins on either side of the escarpment, I derived a geometric relation for rate of escarpment migration R:
R = Ea- Eb (6)
tan a-,+ tanf
for erosion rates E, and Eb with average slopes of a and f. The present-day retreat rates were then used to estimate the escarpments' retreat distance over their lifetimes.
3.2 Cakulating Drainage Area Exchange
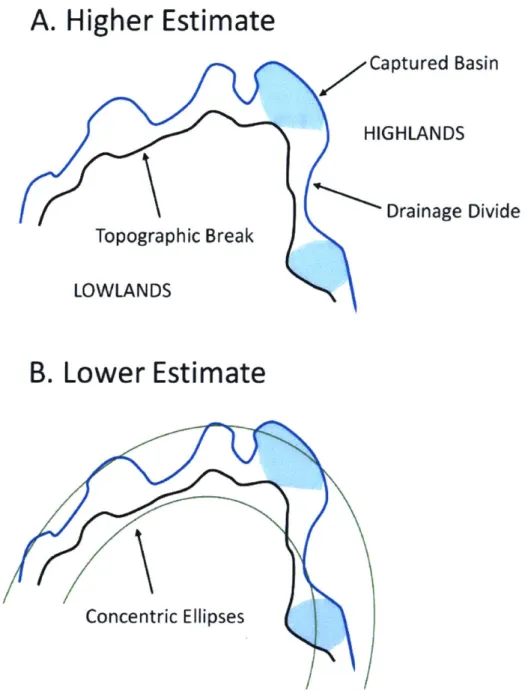
Next, I estimated the drainage area exchanged between river basins as an escarpment migrates
inland using two different estimation methods (Figure 5). I examined the eastern and western basins
published in Cherem et al. (2012), which had a displacement between the topographic break along the escarpment face and the divide between the drainage basins on the escarpment highlands and base. On that map, I marked out any streams with clear evidence of capture, such as fishhook tributaries (see the northeast portion of Figure 6; Bishop, 1995), and calculated the drainage area of the captured basins. As many stream captures may not have highly visible morphological signatures or have been subsequently overwritten by divide migration, this visual estimation provided a lower bound on the area exchanged by stream capture. I also observed that all rivers with evidence of capture drain down the escarpment face.
In my first method of estimation, I assumed that the drainage divide was formerly located at the topographic break on the escarpment face and that the area between the drainage and topographic divides has been taken by either stream capture or divide migration (Figure 6). I then divided the area of captured tributaries by the area between the scarp face and the drainage divide to get a higher
A. Higher Estimate
7
Captured Basin
HIGHLANDS
Drainage Divide
Topographic Break
LOWLANDS
B. Lower Estimate
Concentric Ellipses
Figure 5. Estimating the fraction of drainage area exchanged across a moving drainage divide by river
capture. A) I determine a higher estimate of the % of drainage area exchanged by stream capture by
dividing the area of the captured basins by the area between the drainage divide and the topographic
break at the escarpment face. B) The lower estimate was calculated by dividing the captured area by the
area between two concentric ellipsesfitted to the widest distance between the drainage divide and
topographic break.
that the highly dissected and sinuous escarpment face likely extended slightly farther into the lower
elevation drainage basin, and I fit two concentric ellipses around the widest part of the escarpment to
determine a further initial divide location. The area of the captured tributaries was divided by the area
between the two ellipses to give a lower estimation of the exchange by stream capture. While both
these methods contained implicit assumptions about stream capture scale and these sites being representative of escarpments with different morphologies, which were detailed in the following
discussion section, they gave a preliminary estimate of the importance of stream capture versus divide
migration along the Brazilian escarpments. 4. Results
4.1 Elevation vs. Chi Profiles
All study sites I examined exhibited similar geographic patterns of chi and stream profiles, so here I use the Sdo Geraldo Step as a representative location (Figure 6; graphs and maps of other
locations can be found in Appendix 11). In the stream profiles, the topographic break along the scarp face is clearly visible and the dominant feature in the profile, with no significant change to my results
whether or not the variation in precipitation is included in chi. In addition, there is a systematic
difference in the chi value at the tips of tributaries across the drainage divide, with rivers on the
escarpment highlands having higher chi values than rivers originating beneath the escarpment. The difference in chi across the divide indicates that the rivers are not in equilibrium with each other, and
the rivers at the base of the scarp are trying to increase their chi value by adding drainage area while the
rivers in the escarpment highlands are trying to decrease their chi value by incising and reducing their drainage area (Willett et al., 2014). Mapping chi values provides clear visual evidence that the
escarpment hydrologic system is currently out of equilibrium according to the stream power law and that the rivers below the escarpment are eroding into its face, causing it to migrate to the north.
4.2 Comparing Chi to Cosmogenic Erosion Rates
Comparing the difference in chi across drainage divides with the difference in erosion rate indicates that the two methods for determining hydrologic disequilibrium and relative rates of erosion
generally agree on the sign of disequilibrium (Figure 7). The majority of the locations where the signs
disagree are the site of stream capture events, and the higher cosmogenic erosion rates on top of the escarpment instead of the base may be due to stream captures incorporating an older sediment load into the erosionally younger escarpment face. While measurements from the same field sites tend to cluster together, there is significant overlap between field sites and no clear trend relating two datasets,
600
500
400
NPN
0N- --- --- --- P4---~
Fiur 6
fEamlem
and hi plt ofteIoGrloSep(hrme"l,212.Nt h rmnn
4-PS
(D1-D-)i
D2D2
00
0 0.5 1 1.5 2 2.5 3 3.5 4 4.
Figre . xamlemapan ch plt
f
te 60 erldoSte (herm t a.,201). ot th pomD4n slpebrakatte ac o teesarmet otlne i gee)an tatth ivrsflwigdon hPs2r(P1-P6 all hve lMr chvaustthtpsothrtrbtrsthntervsflwn ogtehghns (D1-D-A.
-2.0
-1.5
-1.0
-0.5
0.0
0.5
1.0
1.5
2.0
-AZxI
Z
Figure 7. Comparison of "Be erosion rates and difference in chi across the escarpments. Locations
where the difference in chi and difference in erosion rate agree on the escarpment movement direction are found on the positive side of the x axis. For the sites we examined, the difference in average erosion rate across drainage divides on opposing sides of the escarpment, normalized by the average erosion rate on the escarpment, agrees with the difference in chi of tributaries across the escarpment,
normalized by the average chi on the escarpment, in the direction but not magnitude of drainage divide movement.
way to determine the direction of escarpment migration, but in-situ erosion rates are necessary in some cases to determine how rapidly the drainage divide is moving.
The 'Be erosion rates do allow the escarpment retreat rates to be estimated (Table 2). These retreat rates vary over an order of magnitude, and tend to be higher for escarpments located closer to
I.4
.0
Serra
d
Mar
0.8
0.6
Serra da Mantiqueira
Espinha a Range
____ A
Cristiaro
Otoni
tep
_.2_ __
S_ o Geraldo Step
the coastline, in particular the Serra do Mar, with an estimated retreat rate of 16.6-39.9 m/Myr (Appendix Ill).
Assuming a constant escarpment retreat rate over the ~130 Ma since the separation of Africa and South America, I find an upper bound of ~5.2 km of escarpment retreat, with a lower bound of ~0.5
km. While the escarpment retreat rates have likely not remained constant since the Atlantic rifting event, the Serra do Mar has likely migrated more than a kilometer in its lifetime.
4.3 The Importance of Stream Capture
My methods provide upper and lower estimates of the portion of drainage area exchanged by stream capture. I found that the Sdo Geraldo Step basins have ~8-39% of their area exchanged by stream capture while the Cristiano Otoni Step basins have ~18-32% of their area exchanged by stream capture along the escarpments. While these estimates are clearly poorly constrained, they do indicate that less than half of drainage area along escarpment ridges is exchanged by stream capture. These results also align with simulations constructed by McCoy et al. (in prep.), who found that landscapes experiencing drainage divide movement driven by differential lowering of their base level typically exhibit 10% of area exchanged by stream capture, but can reach up to 40% stream capture in areas with significant lithologic control or orthogonal river valley orientations, such as Brazil.
5. Discussion
5.1 Constraints on Passive Margin Escarpment Evolution
Using chi mapping to predict the direction of escarpment migration agrees with published '0Be rates in sign of drainage divide movement, though it does not match the magnitude well. Most of
Escarpment 10Be Erosion Rate Reference Retreat Rate (m/Myr)
Serra do Mar Salgado et al., 2014 39.9
Cristiano Otoni Step Cherem et al., 2012 (West) 10.0
Sdo Geraldo Step Cherem et al., 2012 (East) 9.1
Espinhaeao Range Barreto et al., 2013 4.7
Serra da Mantiqueira Rezende et al., 2013 8.8
Serra do Mar (North) Salgado et al., 2016 '16.6
Serra da Mantiqueira Salgado et al., 2016 9.8
Table 2. Escarpment retreat rates calculated from '0Be erosion rates and the average slope of the measured basins.
the instances where cosmogenic erosion rates do not match the change in chi occur in recently captured basins. In these cases, the sediments in the recently captured tributary may be reflecting the erosion rate of its previous basin, from before the capture event. The agreement of '0Be and chi in direction but not magnitude of divide migration has also been observed in the Ozarks (McCoy et al., in prep.), though it implies a less linear trend than observed in the Blue Ridge Mountains (Willett et al., 2014). Overall, the cosmogenic erosion rates for Brazil indicate that its landscape is eroding slowly compared to tectonically active zones and other passive margins (Sosa-Gonzales et al., 2016). Thus, the escarpments are
migrating inland rather slowly compared to erosion rates around the world.
However, the two proposed mechanisms for escarpment evolution (Figure 1), parallel retreat and a fixed drainage divide, may serve as end-members for change in escarpments and not mutually exclusive scenarios. The Sao Geraldo Step, Cristiano Otoni Step, and Serra do Mar (North) all exhibit gaps between their drainage divide and the escarpment face, implying that rivers may be incising towards a pre-rift drainage divide while retreat of the divide is also taking place. One cause of the gap between the drainage divide and escarpment face may be stream captures driving the divide movement as subsequent accelerated incision in the captured reach, due to base level change, causes the
escarpment to migrate inland (Prince et al., 2010). This mechanism explains the relatively small gap between the drainage divide and topographic scarp without the need for preserving a fixed inland drainage divide for over 100 Myr. Despite not providing high enough erosion rates to drive escarpment
migration from the coastline since rifting, my analysis of CRN erosion rates and river network
disequilibrium using chi indicate that the rivers on either side of the Brazilian escarpments are actively evolving closer to equilibrium by shifting their drainage basins. Therefore, the Brazilian escarpments do not currently fit either model of escarpment retreat well, requiring that the drainage divide be mobile while the escarpment experiences limited retreat over its lifetime, indicating that more complicated factors, such as flexural compensation or lithology, may be required to account for the formation and persistence of the escarpments.
In addition to constraining the mechanisms of escarpment evolution, I examine the possible changes in rate of evolution through time. AFT estimated denudation rates are much higher in the Serra do Mar (North) mountains than 13e cosmogenic rates (Hackspatcher et al., 2003). Using a reconstructed initial denudation surface at 3255 m elevation, Hackspatcher et al. (2003) infer that the highlands (at 900 m) had an average erosion rate of 89 m/Myr and lowlands closer to the coastal plain (at 259 m) had an average erosion rate of 105 m/Myr. These rates are consistent with those of Gallagher et al. (1994),
who found minimum erosion rates of 30-60 m/Myr using AFT near Rio de Janeiro. Comparing basins similar in location, morphology and elevation from Salgado et al. (2016) indicates that CRN erosion rates are -1/9-1/3 the estimate AFT denudation rates. The slightly elevated longer-term erosion rates are further supported by observations of hypabyssal textures in plutonic rocks emplaced during the
Cretaceous magmatic event. The plutons were emplaced at 2-5 km depth and have been dated to 80-55 Ma, which indicate 20-91 m/Myr average erosion since their emplacement, consistent with AFT and 1
*Be
erosion rates (Cogne et al., 2001).
While there are significant discrepancies between the methods used and erosion rates obtained using AFT and '0Be, both papers find erosion rates that are too low to support escarpment retreat over 40 km from the continental margin since the initiation of rifting ~130 Ma, though present escarpment retreat rates support retreat of up to -5 km (Salgado et al., 2014; Hackspacher et al., 2004). The faster retreat rates along the coastline may be due to uneven uplift following the rifting event or during the subsequent tectonic reactivations, promoting geographic variation in escarpment retreat rates. Some of the discrepancies may also be due to temporal variations in erosion rate, with AFT and the offshore sedimentary record indicating that Southeast Brazil may have experienced more rapid erosion rates around 100, 75 and 40 Ma that have decreased to the present day (Gallagher & Brown, 1999). This implies that escarpment retreat rates may have been higher prior to 100 ka, possibly connected to tectonic rejuvenation of the passive margin, but still did not exhibit the extremely high erosion rates necessary to have the escarpment originate at the edge of the continent.
5.2 Stream Capture and Escarpment Retreat
I determine that stream capture plays a relatively minor role in drainage network reorganization on escarpments, with less than 40% of drainage area exchanged by captures. However, my methods also include numerous assumptions that demonstrate how challenging determining the importance of captures can be. The first implicit assumption in my analysis is that all captures are visible, and exhibit clear geometric oddities that have not been eroded away yet. Since the Brazilian landscape exhibits strong structural control on fluvial networks, this provides and additional challenge of determining what geometries are due to structural controls versus stream capture. I also have not constrained whether the portion of drainage area exchanged by captures scales with river basin size. A large stream capture may subsequently be expanded by smaller captures and divide migration, making it challenging to figure out what drainage area has been annexed by what means. Finally, my methods could only be applied to two of my field sites, because no other sites contained clear possible previous divide locations at 24
topographic breaks. Therefore, my two sites risk being outliers containing exceptionally high frequencies of stream capture due to the penetration of drainage networks past the escarpment face at both sites from Cherem et al. (2012).
Despite these challenges, and by assuming large uncertainties in determining the portion of drainage area exchanged by stream capture, I have constrained its value to less than 40%. Better understanding the relationship between escarpment retreat and drainage basin reorganization will give insight into whether escarpments retreat steadily due to divide migration or retreat sporadically due to stream capture and subsequent landscape dissection (Gunnell & Harbor, 2008). In particular, stream captures forming knickpoints along the escarpment face may temporarily increase local stream power, causing transient episodes of high incision rates (Prince et al., 2010). Stream capture may also act to increase the sinuosity of escarpments, meaning that higher sinuosity may not be a proxy for age (Matmon et al., 2002), but instead for the local disequilibrium of river networks, as expressed by faster rates of escarpment retreat and an increased frequency of stream capture (McCoy et al., in prep.). My calculations of escarpment retreat rate also rely on divide migration as the driving mechanism and do not take into account the timescales necessary to capture a tributary and equilibrate it to a lower base level, although this effect may be compensated by the relatively longer exposure time of sediments in captured basins. This indicates that my calculated retreat rates may be lower than the actual retreat rates if escarpments migrate using significant capture of drainage area, though this effect is not yet well-understood. Constraining previous geometries of the escarpment would help determine its method and rate of retreat, as well as place limits on past regional topography and fluvial geometries.
6. Conclusions
Passive margin escarpments remain poorly understood, with estimated retreat rates ranging over two orders of magnitude. Here, I validate chi mapping as a method to provide estimates of river basin disequilibrium across an entire escarpment, finding that the predicted drainage divide motion based on the difference in chi calculated for opposing tributaries generally agrees with the difference in erosion rate derived from published cosmogenic mBe measurements. This indicates that chi mapping can serve as a valuable tool to determine the areas of high stream disequilibrium that may be of
particular interest in order to optimize gathering CRN erosion rates in the field, and allow researchers to study river evolution in areas with few or no published erosion rates. I also obtain a higher and lower estimate for the percentage of drainage area along an escarpment exchanged by stream capture, and determine that the majority of drainage area is exchanged by divide migration. While more
observational estimates of the frequency of stream capture are needed, the dominance of drainage divide migration has implications for landscape evolution in active tectonic environments as well as constraining the frequency of species exchange between rivers in disequilibrium. Finally, my analysis of the Brazilian escarpments indicates that they are retreating at a rate of ~5-40 m/Myr with an actively moving drainage divide, though retreat rates may have been higher tens of Ma, and initially formed inland of the rift zone.
Appendix I: 10Be Erosion Rates
The following table contains the published erosion rates for each drainage basin for different
escarpments in Brazil. The updated erosion rates are taken from Sosa-Gonzales et al. (2016; in press) and use the new CRONUS Be standard to increase their accuracy. I chose to use the updated erosion
rates in all basins in which they are available except for the Cherem et al. (2012) values, because the updated erosion rates were significantly different from the original ones, in many cases flipping the relationship between expanding and contracting drainage basins. Without a clear explanation for the significant differences in erosion rates at this site while updating the '0Be standard at other sites only caused minor changes in value of the published erosion rates, I use the original published erosion rates.
Source Barreto et al., 2013 Cherem et at., 2012 Drainage Basin D1 D2 D3 D4 D5 D6 D7 SF1 SF2 SF3 SF4 SF5 SF6 SF7 SF8 SF1 SF2 SF3 AD1 AD2 AD3 AD4 AD5 Dl D2 D3 D4 D5 P1 P2 P3 P4 Original Erosion Rate (m/Myr) 5.29 3.46 4.45 5.27 4.04 4.31 6.3 4.99 2.59 3.35 3.6 3.9 5.44 1.8 2.37 5.21 9.73 7.28 14.38 12.64 6.04 17.01 8.30 11.18 9.42 13.76 19.30 9.09 20.08 23.07 17.79 14.44 Original Error Bar (m/Myr) 0.16 0.11 0.13 0.14 0.12 0.13 0.18 0.15 0.08 0.09 0.11 0.12 0.17 0.05 0.05 0.01 0.03 0.02 0.08 0.09 0.01 0.10 0.02 0.04 0.03 0.06 0.13 0.03 0.16 0.26 0.34 0.19 Updated Erosion Rate (m/Myr)' 5.29 3.14 4.83 4.81 4.2 4.44 5.76 3.8 1.62 2.22 2.52 2.83 4.13 1.49 2.07 N/A N/A N/A N/A N/A N/A N/A N/A N/A N/A N/A N/A N/A N/A N/A N/A N/A Updated Error Bar (m/Myr)2 0.16 0.10 0.14 0.13 0.12 0.13 0.16 0.11 0.05 0.06 0.08 0.09 0.13 0.04 0.04 N/A N/A N/A N/A N/A N/A N/A N/A N/A N/A N/A N/A N/A N/A N/A N/A N/A
Rezende et al., 2013 Salgado et al., 2014 Salgado et al., 2016 28 P5 P6 GAl GA2 GA3 GA4 GA5 P1 P2 P3 P4 01 02 03 04 05 Cl C2 C3 C4 C5 Al A2 A3 A4 A5 B1 B2 B3 B4 B5 Cl C2 C3 C4 C5 D1 D2 D3 D4 D5 D6 D7 El E2 E3 E4 E5 15.20 12.82 14.35 7.55 14.75 10.05 14.53 26.5 12.91 18.09 12.06 29.9 15.5 47.7 17 20.1 8.3 8.1 13.2 12.4 13.5 21.3 35.2 40.3 48.8 40.0 7.7 6.7 12.3 8.7 10.7 27.4 22.3 22.9 21.4 22.3 29.4 12.9 19.7 18.9 15.2 26.8 23.3 12.3 6.3 10.9 10.5 16.8 0.12 0.12 0.52 0.25 0.46 0.31 0.5 0.85 0.43 0.58 0.52 1.39 0.51 5.65 1.13 0.71 0.3 0.28 0.47 0.39 0.41 1.2 1.5 2.9 8.6 1.9 0.2 0.2 0.4 0.3 0.4 1.6 1.4 1.3 2.4 1.1 0.9 0.4 0.6 0.6 0.5 1.9 1.8 0.4 0.2 0.4 0.4 0.5 N/A N/A 14.37 7.20 13.21 9.53 13.52 27.78 12.12 18.07 11.51 30.85 17.31 61.51 18.37 18.67 8.79 7.73 12.82 11.89 11.92 N/A N/A N/A N/A N/A N/A N/A N/A N/A N/A N/A N/A N/A N/A N/A N/A N/A N/A N/A N/A N/A N/A N/A N/A N/A N/A N/A N/A N/A 0.52 0.24 0.41 0.29 0.47 0.89 0.40 0.58 0.50 1.43 0.57 7.29 1.22 0.66 0.32 0.27 0.46 0.37 0.36 N/A N/A N/A N/A N/A N/A N/A N/A N/A N/A N/A N/A N/A N/A N/A N/A N/A N/A N/A N/A N/A N/A N/A N/A N/A N/A N/A
E6 10.2 0.3 N/A N/A
E7 17.2 0.7 N/A N/A
E8 16.4 0.5 N/A N/A
From Sosa-Gonzales et al., 2016 (in press)
2
Updated erosion rates are calculated to have the same percentage error bars as the original measurements. For example, given originally published erosion rate E1 with and error of ej, the
Appendix II: Supplementary Maps & Chi Plots of Field Sites
Salgado et a1., 2014
Serra do Mar Escarpment
1400
1200
1000
E
-C-C
-C5
~
-01
-02
04
800
600
400
200
1
2
3
4
X(m)
30I
I
.1
5
6
7
x 104Cherem et al., 2012
Cristiano Otoni Step
3N
LAD2IA
IlkAR
500-
450-
400-
350-
300-
250-200
150
100
50
0
0
1
2
3
x (m)
-AD1
-AD2
-AD3
-AD4
-AD5
-SF1
-SF2
-SF3
4
5
6
x 10,
E
Barreto et al., 2013
Southern Espinhago Range
2
43VW3
4
5
X (m)
U, 9a
120C
'I -D1 -D2 D3 -D6 -SF1 -SF2 SF3/SF6 -SF4/SF5 -SF7 -SF8E
1000800
600
400
200
0
c
1
6
327
8
X104
I i iRezende et al., 2013
Serra da Mantiqueira Mountains
mm
m
Ioa .- _' t=l -t'w -4- s us-~ [="*-I=-- . f t *"0.5
M I .AN fK9JAI Is 0 0 5 t0 -mKmic= Km -"'1
1.5
2
2.5
X (m)
3
3.5
4
4.5
x 104 wA POna SOMMTOPoOmA cm'-AMAy. m1800
1600
1400
1200
1000
800
600
400
200
E
-P1
-
-P2-P3
- -P4
-GA1
-
GA2
-GA3
.
-GA4/GA5
--
--0"
C
-1
Salgadoet
al., 2016
Salgado et a1.. 2016
Serra da Mantiqueira Mountains
r7
!E*L1800r
1600
1400
1200
1000
800
600
400
200
0'
c
-D1
- -D2
--
D4
-
-D5
-D6
- -E1/E3
-E2
--E4/E5/E6/E7
E8
I I I I I I- --0.5
1
1.5
2
2.5
X (m)
3
3.5
4
4.5
X 104 0.-%E
34Salgado et al., 2016
Serra do Mar (North)
1800-1600
1400-
-Al
-A2
1200
A3
-A4
1000
--
A5
E
-81
800
-B2
-B3
600
-B5
-Cl
400
-C2
-C3
200
-C5
0
]
ii
I1
0
1
2
3
4
5
6
7
8
X (m)
x104
16 -1Appendix III:
Escarpment retreat rate versus distance from the present-day coastline and the continental shelf. The escarpments closer to the coast, in particular the Serra do Mar at 39.9 and 16.6 m/Myr, exhibit higher retreat rates than those farther from the coastline. The trend is less clear for distance to the edge of the continental shelf, which may be used as a proxy for the coastline at the time of the Gondwana rifting event. 45 0 40 e 35
E
Z- 30 CC * Distance to Continental Shelf * Distance to Coastline 0I
e
4
* 0 * 0 100 200 300 Distance (km) 400 500o
25 bO 20 15E
E-10 U LU 5 0 0 0 36References
Balestrieri, M. L., Stuart, F. M., Persano, C., Abbate, E. & Bigazzi, G. Geomorphic development of the escarpment of the Eritrean margin, southern Red Sea from combined apatite fission-track and (U-Th)/He thermochronometry. Earth and Planetary Science Letters 231, 97-110 (2005).
Barreto, H. N. et al. Denudation rates of the Southern Espinhaeo Range, Minas Gerais, Brazil, determined by in situ-produced cosmogenic beryllium-10. Geomorphology 191, 1-13 (2013).
Bierman, P. R. & Caffee, M. Slow rates of rock surface erosion and sediment production across the Namib Desert and escarpment, southern Africa. American Journal of Science 301, 326-358 (2001). Bishop, P. Drainage rearrangement by river capture, beheading and diversion. Progress in physical geography 19, 449-473 (1995).
Braun, J. & Van Der Beek, P. Evolution of passive margin escarpments: What can we learn from low-temperature thermochronology? Journal of Geophysical Research: Earth Surface 109, (2004).
Brocard, G. et al. Rate and processes of river network rearrangement during incipient faulting: The case of the Cahab6n River, Guatemala. American journal of science 312, 449-507 (2012).
Burke, B. C., Heimsath, A. M., Dixon, J. L., Chappell, J. & Yoo, K. Weathering the escarpment: Chemical and physical rates and processes, south-eastern Australia. Earth Surface Processes and Landforms 34, 768-785 (2009).
Cherem, L. F. S. et al. Long-term evolution of denudational escarpments in southeastern Brazil. Geomorphology 173, 118-127 (2012).
Cockburn, H. A. P., Brown, R. W., Summerfield, M. A. & Seidl, M. A. Quantifying passive margin denudation and landscape development using a combined fission-track thermochronology and cosmogenic isotope analysis approach. Earth and Planetary Science Letters 179, 429-435 (2000). Cognd, N., Gallagher, K., Cobbold, P. R., Riccomini, C. & Gautheron, C. Post-breakup tectonics in southeast Brazil from thermochronological data and combined inverse-forward thermal history modeling. Journal of Geophysical Research: Solid Earth 117, (2012).
Davis, W. M. The development of certain English rivers. The Geographical Journal 5, 127-146 (1895). do Nascimento Pupim, F. et al. Erosion rates and landscape evolution of the lowlands of the Upper Paraguay river basin (Brazil) from cosmogenic 10 Be. Geomorphology 234, 151-160 (2015).
Fleming, A., Summerfield, M. A., Stone, J. 0., Fifield, L. K. & Cresswell, R. G. Denudation rates for the southern Drakensberg escarpment, SE Africa, derived from in-situ-produced cosmogenic 36C1: initial results. Journal of the Geological Society 156, 209-212 (1999).
Gallagher, K., Hawkesworth, C. J. & Mantovani, M. S. M. The denudation history of the onshore
continental margin of SE Brazil inferred from apatite fission track data. Journal of Geophysical Research: Solid Earth 99, 18117-18145 (1994).
Gallagher, K. & Brown, R. The onshore record of passive margin evolution. Journal of the Geological Society 154, 451-457 (1997).
Gallagher, K. & Brown, R. The Mesozoic denudation history of the Atlantic margins of southern Africa and southeast Brazil and the relationship to offshore sedimentation. Geological Society, London, Special Publications 153, 41-53 (1999).
Gilchrist, A. R., Summerfield, M. A. & Cockburn, H. A. P. Landscape dissection, isostatic uplift, and the morphologic development of orogens. Geology 22, 963-966 (1994).
Gilchrist, A. R. & Summerfield, M. A. Differential denudation and flexural isostasy in formation of rifted-margin upwarps. (1990).
Gunnell, Y. & Harbor, D. J. Butte detachment: how pre-rift geological structure and drainage integration drive escarpment evolution at rifted continental margins. Earth Surface Processes and Landforms 35, 1373-1385 (2010).
Hackspacher, P. C. et al. Consolidation and break-up of the South American platform in southeastern Brazil: tectonothermal and denudation histories. Gondwana Research 7, 91-101 (2004).
Heimsath, A. M., Chappell, J., Finkel, R. C., Fifield, K. & Alimanovic, A. Escarpment erosion and landscape evolution in southeastern Australia. Geological Society of America Special Papers 398, 173-190 (2006). Hiruma, S. T. et al. Denudation history of the Bocaina Plateau, Serra do Mar, southeastern Brazil:
Relationships to Gondwana breakup and passive margin development. Gondwana Research 18, 674-687 (2010).
Hiruma, S. T., Modenesi-Gauttieri, M. C. & Riccomini, C. Late Quaternary colluvial deposits in the
Bocaina Plateau, southeastern Brazil highlands: age and palaeoenvironmental consequences. Boreas 42, 306-316 (2013).
Howard, A. D. & Kerby, G. Channel changes in badlands. GSA Bulletin 94, 739-752 (1983). Japsen, P. et al. Episodic burial and exhumation in NE Brazil after opening of the South Atlantic. Geological Society of America Bulletin 124, 800-816 (2012).
Jelinek, A. R. et al. Denudation history and landscape evolution of the northern East-Brazilian continental margin from apatite fission-track thermochronology. Journal of South American Earth Sciences 54, 158-181 (2014).
.Johnson, D. W. River capture in the Tallulah district, Georgia. Science 428-432 (1907).
Lamb, M. P., Dietrich, W. E. & Venditti, J. G. Is the critical Shields stress for incipient sediment motion dependent on channel-bed slope? Journal of Geophysical Research: Earth Surface 113, (2008). Lav6, J. Earth science: Landscape inversion by stream piracy. Nature 520, 442-444 (2015).
Lehner, B., Verdin, K., Jarvis, A. New global hydrography derived from spaceborne elevation data. Eos Transactions 89(10), 93-94 (2008). http://www.hydrosheds.org.
Magaldi, T. T. Precipitag5o m6dia anual registrado no Brasil entre os ano de 1977 e 2006. (2013). Matmon, A., Bierman, P. & Enzel, Y. Pattern and tempo of great escarpment erosion. Geology 30, 1135-1138 (2002).