Publisher’s version / Version de l'éditeur:
Vous avez des questions? Nous pouvons vous aider. Pour communiquer directement avec un auteur, consultez la première page de la revue dans laquelle son article a été publié afin de trouver ses coordonnées. Si vous n’arrivez pas à les repérer, communiquez avec nous à PublicationsArchive-ArchivesPublications@nrc-cnrc.gc.ca.
Questions? Contact the NRC Publications Archive team at
PublicationsArchive-ArchivesPublications@nrc-cnrc.gc.ca. If you wish to email the authors directly, please see the first page of the publication for their contact information.
https://publications-cnrc.canada.ca/fra/droits
L’accès à ce site Web et l’utilisation de son contenu sont assujettis aux conditions présentées dans le site
LISEZ CES CONDITIONS ATTENTIVEMENT AVANT D’UTILISER CE SITE WEB.
Truelove Lowland, Devon Island, Canada: a high arctic ecosystem, pp. 15-30,
1977
READ THESE TERMS AND CONDITIONS CAREFULLY BEFORE USING THIS WEBSITE.
https://nrc-publications.canada.ca/eng/copyright
NRC Publications Archive Record / Notice des Archives des publications du CNRC :
https://nrc-publications.canada.ca/eng/view/object/?id=783b7681-a3b6-4740-b7b8-b8869c9fe8fc
https://publications-cnrc.canada.ca/fra/voir/objet/?id=783b7681-a3b6-4740-b7b8-b8869c9fe8fc
NRC Publications Archive
Archives des publications du CNRC
This publication could be one of several versions: author’s original, accepted manuscript or the publisher’s version. / La version de cette publication peut être l’une des suivantes : la version prépublication de l’auteur, la version acceptée du manuscrit ou la version de l’éditeur.
Access and use of this website and the material on it are subject to the Terms and Conditions set forth at
Permafrost investigations on Truelove Lowland
National Research ~ons'eil national
1
S
Council Canada de recherches CanadaPERMAFROST INVESTIGATIONS ON
TRUELOVE LOWLAND
by R.J.E. Brown, Division of Building Research, National Research Council of Canada
with an Appendix by A.S. Judge, Earth Physics Branch, Department of Energy, Mines and Resources
Reprint from
Truelove Lowland, Devon Island, Canada: A High Arctic Ecosystem Edited by L.C. Bliss, Published by The University of Alberta Press, 1977 p. 15 30
DBR Paper No. 783
Division of Building Research
NRCC 16812
I Contribution No. 714 Earth Physics Branch
L e pergCliso1, o u gClisol p e r e n n e , s e t r o u v e p a r t o u t s o u s l a s u r f a c e du s o l d e T r u e l o v e Lowland, s i t & d a n s l a p a r t i e n o r d d e l a zone de pergCliso1 continue. L a p r e s e n c e d ' u n e f o r t e C p a i s s e u r d e p e r g e l i s 0 1 continu d a n s 1'Archip'ele c a n a d i e n n e d e l l A r c t i q u e e s t connue d e p u i s l o n g t e m p s , m a i s j u s q u ' a r 6 c e m m e n t l e s r e l e v C s s e l i m i t k r e n t & q u e l - q u e s e n d r o i t s & p a r s . P e n d a n t c e s d e r n i k r e s a n n e e s , l e s o b s e r v a t i o n s a u g m e n t k r e n t c o n s i d e r a b l e m e n t , tout p a r - t i c u l i k r e m e n t d a n s l e s Q u e e n E l i z a b e t h I s l a n d s , g r s c e a u x r e c h e r c h e s p 6 t r o l i f k r e s e n t r e p r l s e s . L e C a n a d i a n T u n d r a B i o m e Study d e 1'1. B. P. donna l ' o c c a s i o n d e r e c u e i l l i r l ' i n f o r m a t i o n s u r l e s c o n d i t i o n s d u p e r g e l i s o l d a n s l e s p r i n c i p a u x t y p e s d e t e r r a i n s de T r u e l o v e Lowland. Au- c u n e m e s u r e d u p e r g e l i s 0 1 n ' a v a i t 6th effectuCe s u r Devon I s l a n d a u p a r a v a n t . Une i n d i c a t i o n p r e l i m i n a i r e d e s c o n - d i t i o n s d u p e r g 6 l i s o l a &ti. obtenue
>
p a r t i r d e s o b s e r v a - t i o n s f a i t e s & R e s o l u t e T . N . - O . , 320 k m a u s u d - o u e s t s u r C o r n w a l l i s I s l a n d , l ' i l e v o i s i n e d e Devon I s l a n d . A c e t e n d r o i t , l e p e r g e l i s o l d e s c e n d a i t & e n v i r o n 4G0 m d e p r o f o n d e u r e t avait une t e m p h r a t u r e d e -12.5"C>
une p r o - f o n d e u r d u n i v e a u d ' a m p l i t u d e t h e r m i q u e a n n u e l l e z k r o .Permafrost investigations on
Truelove Lowland
R.J.E. Brown
Introduction
Permafrost, or perennially frozen ground, occurs everywhere beneath the land surface of Truelove Lowland, which is situated in the northern part of the continuous zone (Brown 1967). The presence of thick continuous permafrost throughout the Canadian Arctic Archipelago has been known for a long time, but until recently investigations have been limited to a few scattered locations (Brown 1970, Brown 1972a). During the past few years, observations have increased considerably, especially in the Queen Elizabeth Islands, with the onset of petroleum explorations (Judge 1973). The Canadian Tundra Biome Study of the I.B.P. provided an opportunity to obtain information on permafrost conditions in the major terrain types at Truelove Lowland. No permafrost investigations had been carried out previously on Devon Island. A preliminary indication of permafrost conditions was available from
observations at Resolute, N.W.T., 320 km to the southwest on adjacent Cornwallis Island. At this location permafrost was found to be about 400 m thick with a temperature of -12.5OC at the depth of zero annual amplitude (Cook 1958, Misener 1955).
Methods
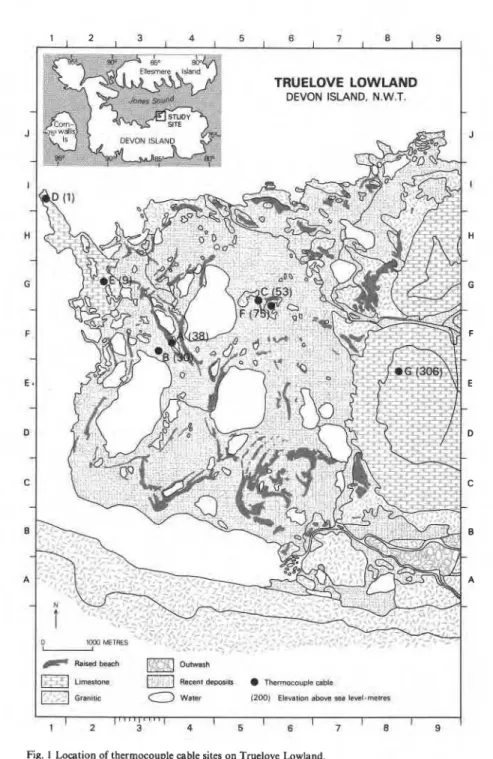
A preliminary reconnaissance was made in August 1970 to survey surface features associated with permafrost, to obtain measurements of thickness of the permafrost active layer in the major terrain units in the Lowland, and to select sites for the installation of thermocouple cables. A drilling program was carried out in June and July 1971 to obtain information on the perennially frozen soils and bedrock and to install thermocouple cables for monitoring ground temperatures in the permafrost. A total of ten holes (nine in the Lowland and one on the adjacent upland plateau to the east) were drilled in six of the major terrain units to varying depths down to 9 m using a two-man portable Packsack 10 hp diamond drill (Fig. 1, Table 1). Holes in the gravelly soils were limited in depth to less than 3 m by the lack of sufficient power to drill casing. Holes in bedrock were deeper, but limited to depths of 8 to 9 m because of the very cold ground temperatures which caused freezing problems in the drilling. The restriction of logistical support to light aircraft at this remote location in the High Arctic prevented bringing in a sufficiently heavy duty drill rig for the installation of deeper holes.
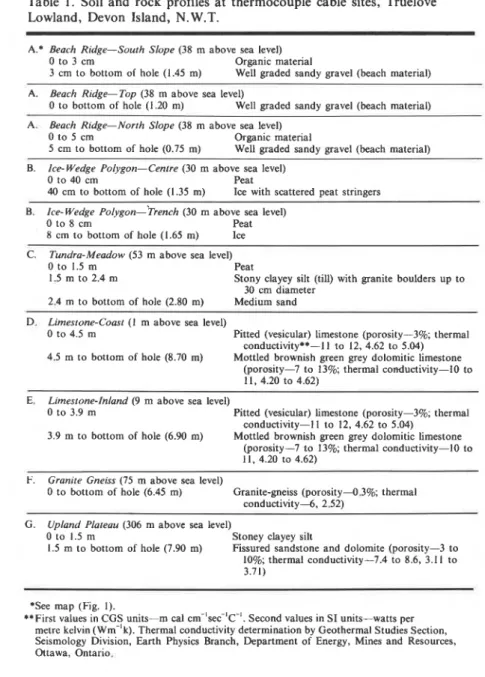
Table 1. Soil and rock profiles at thermocouple cable sites, Truelove Lowland, Devon Island, N. W.T.
A.* Beach Ridge-South Slope (38 m above sea level) 0 to 3 cm Organic material
3 cm to bottom of hole (1.45 m) Well graded sandy gravel (beach material) A. Beach Ridge-Top (38 m above sea level)
0 to bottom of hole (1.20 m) Well graded sandy gravel (beach material) A. Beach Ridge-North Slope (38 m above sea level)
0 to 5 cm Organic material
5 cm to bottom of hole (0.75 m) Well graded sandy gravel (beach material) B. Ice- Wedge Polygon-Centre (30 m above sea level)
0 to 40 cm Peat
40 cm to bottom of hole (1.35 m) Ice with scattered peat stringers B. Ice- Wedge ~ o l ~ ~ o n - ' T r e n c h (30 m above sea level)
0 to 8 cm Peat
8 cm to bottom of hole (1.65 m) Ice C. Tundra-Meadow (53 m above sea level)
0 to 1.5 m Peat
1.5 m to 2.4 m Stony clayey silt (till) with granite boulders up to 30 cm diameter
2.4 m to bottom of hole (2.80 m) Medium sand D. Limestone-Coast (1 m above sea level)
0 to 4.5 m Pitted (vesicular) limestone (porosity-3%; thermal conductivityg*-l l to 12, 4.62 to 5.04) 4.5 m to bottom of hole (8.70 m) Mottled brownish green grey dolomitic limestone
(porosity-7 to 13%; thermal conductivity-10 to 11. 4.20 to 4.62)
E. Limestone-inland (9 m above sea level)
0 to 3.9 m Pitted (vesicular) limestone (porosity-3%; thermal conductivity-I l to 12, 4.62 to 5.04)
3.9 m to bottom of hole (6.90 m) Mottled brownish green grey dolomitic limestone (porosity-7 to 13%; thermal conductivity-I0 to 11, 4.20 to 4.62)
F. Granite Gneiss (75 m above sea level)
0 to bottom of hole (6.45 m) Granite-gneiss (porosity--0.3%; thermal
conductivity4, 2.52) I
G. Upland Plateau (306 m above sea level)
0 to 1.5 m Stoney clayey silt
1.5 m to bottom of hole (7.90 m) Fissured sandstone and dolomite (porosity-3 to 10%; thermal conductivity-7.4 to 8.6, 3.11 to 3.71)
*See map (Fig. I).
**First values in CGS units-m cal cm-'sec-'~-'. Second values in SI units-watts per metre kelvin ( ~ m - ' k ) . Thermal conductivity determination by Geothermal Studies Section, Seismology Division, Earth Physics Branch, Department of Energy, Mines and Resources, Ottawa, Ontario.
The first ground temperature measurements were taken in July 1971 and monthly readings were continued until the end of the field season in October when the Base Camp operation was discontinued for the winter (Brown 1972b, Brown 1973). Monthly observations were resumed in May 1972 and continued through the winter of 1972-73 to August 1973 when the program was
terminated. The depth of snowcover was also noted monthly at a snow stake at each site during the observation periods.
Permafrost 17
1 2 3 4 5 6 7 8 9
- - . - ? -
,
- d . m - A * f i - + < -7.7-T
--
1 1 . %. .
- x y , - , > $2 '-
.,. .L.
* . ,, * 7-
. * - - X y < ' 4 - * "a -..
_
- +* - . - ; , , * . > -.
-I * '*I.,
+-
-
- x A--
L ' =.,.. ..
-.:
& -<.-
< '-
^_-.:-
.;.
. = .%. ,- Pa*-
.-*. , a 1-1 , --<-
*'--:.
*.-,"
..-
-
I d-
* - * --* --
* .--8---*
_.--
-
. &.
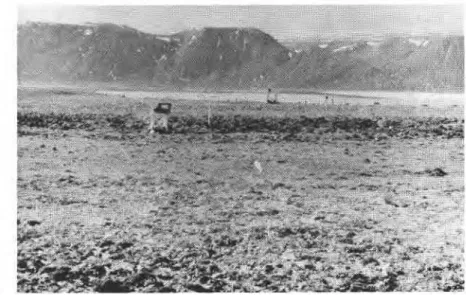
+-Fig. 2 Beach r~dge thermocouple cable saes-north slope on left, top m centre, south slope on nght, Julv 1971.
Terraln characteristics of thermocouple cable sites I
Three thermocouple cables which have sensors at 15 cm intervals were installed on the south slope, top, and north slope of a beach ridge (designated as the Beach Ridge Site) southwest of Base Camp similar to the Intensive Raised Beach Site (Fig.2). Two cables, also with sensors at 15 cm intervals, were placed in a nearby area of high centre ice-wedge polygons (Ice-Wedge Polygon Site), one cable in the centre of a polygon, and the other in a trench (see Fig. 5
Muc and Bliss this volume). One cable which has sensors at 0.75 and 1.5 m
- -
- ..I.
.
..
-7
1 r*-waF-*- =
Permafrost
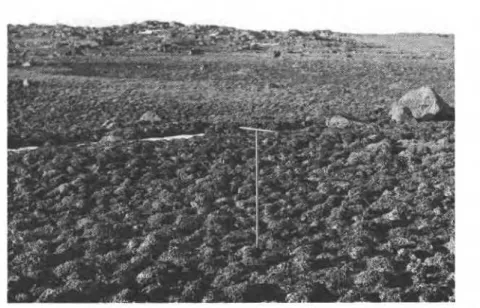
Fig. 4 Upland plateau thermocouple cable site, July 1971
intervals was installed in a hummocky sedge-moss meadow adjacent to the Intensive Meadow Site. Four thermocouple cables with the same sensor intervals were installed in exposed bedrock. Two of these were located in the limestone area in the northwest section of the Lowland, one at the coast at Rocky Point (Limestone-Coast Site), and the other 0.5 km inland (Limestone- Inland Site) (Fig. 3). One hole was drilled in a granite gneiss outcrop
(designated as the Granite Gneiss Site) near the Intensive Meadow Site. The fourth was installed on the 300 m high upland plateau surface (Upland Plateau Site) east of the Lowland (Fig. 4). Data on the ground (soil/rock) profiles, depth of thermocouple cables, elevation above sea level, and rock thermal conductivity values are given in Table 1.
T E M P E R A T U R E . 5
Table 2. Active layer (depth of thaw) at thermocouple cable sites, Truelove Lowland, Devon Island, N.W.T.
Sire
Aclive Depth of thaw (cm) Depth of thaw (cm)
layer (cm) 1972 '1973
1971 July Augur July
Beach Ridge-South Slope (A)'
Beach Ridge-Top (A)
Beach Ridge-North Slope (A)
Ice-Wedge Polygon-Centre (B) Ice-Wedge Polygon-Trench (B) Tundra-Meadow (C) Limestone-Coast (D) Limestone-Inland (E) Granite Gneiss (F) Upland Plateau (G) 49 40-70 88 52 46-76 not available 34 46 55 21 16-30 46 12 16 46 30 37 not available 58 46-122 91 55 16-91 116 146 137 168 <30 30 not available
*August 1973 not available. 'see map. Temperature, OC - 1 8 - 1 7 - 1 5 - 1 4 - 1 3
-
12 1-
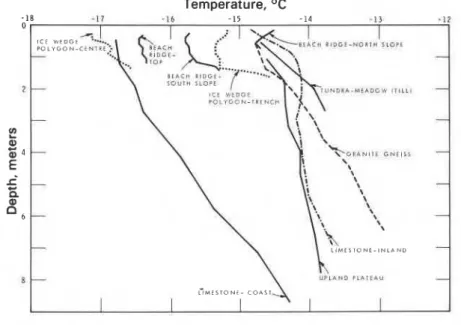
- J P L I N D P L I T E A U L ~ M E S T O N E - C O A S TFig. 6 Mean annual ground temperature graphs at thermocouple cable sites.
Ground temperature measurements
Although ground temperature measurements were taken monthly for a 16 month period from May 1972 to August 1973 inclusive, some unavoidable gaps and readings of questionable accuracy in the summer of 1973 necessitated restricting the data used for calculating mean annual ground temperature values to the period of May 1972 to May 1973 inclusive. Within this period, values for missing readings were interpolated as the arithmetical mean between the two adjacent monthly observations. Mean annual temperature values were obtained for each thermocouple junction for 12 monthly readings for the two periods of May 1972 to April 1973 and June 1972 to May 1973. The average of
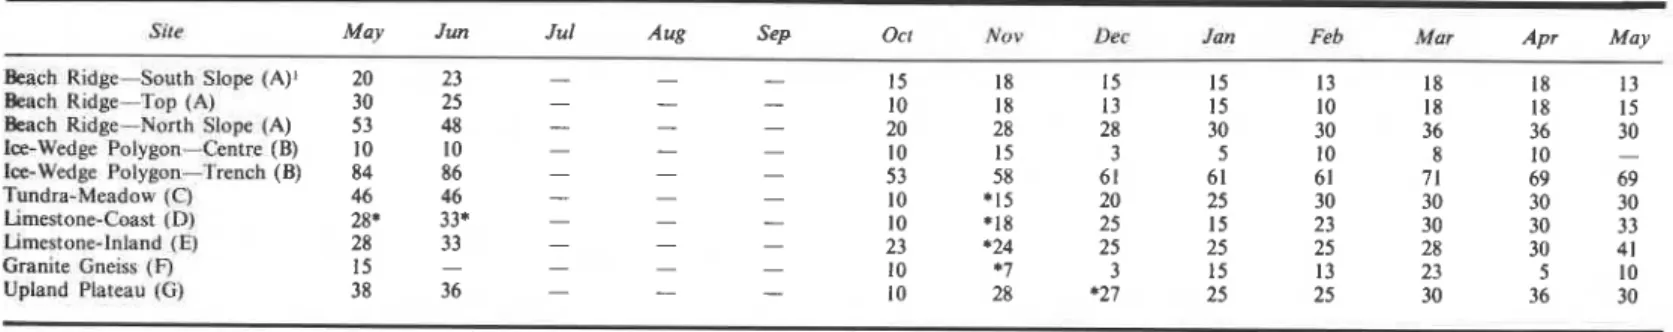
Table 3. Snowcover (cm) at thermocouple cable sites (May 1972-May 1973), Truelove Lowland, Devon Island, N.W.T.
Site May Jun Jul Aug Sep Ocr Nrrv Dcr fun Feb M m Apr May
Bcach Ridge-South Slope (A)' 20 23 - - - 15 18 I5 15 18 18 13
- - - 13
b c h Ridge-Top (A) 30 25 10 18 13
- - - 15 10 18 18 15
k c h Rldge-North Slopc (A) 53 48 20 28 28
- - - 30 30 36 36 30 I=-Wedgr Polygon-Ccntre (B) 10 10 15 3 5 10 8 10 - l o 58 Ice-Wedge Polygon-Trench (B) 84 86 - - - - - - 53 61 6 1 61 71 69 69 Tundra-Meadow (0 46 46 10 '15 20 25 30 30 30 30 - - - hrnestonc-Cmst (D) 28' 33* 10 *I8 - - - 25 15 23 30 hmcstone-Inland (E) 28 33 23 '24 30 33 - - - - 25 25 25 28 30 41 Gran~te Gne~ss (0 15 10 '7 3 15 13 23 5 10 - - - Upland Platcau ( G ) 38 36 10 28 '27 25 25 30 36 30 *Interpolated Values. 'see map.
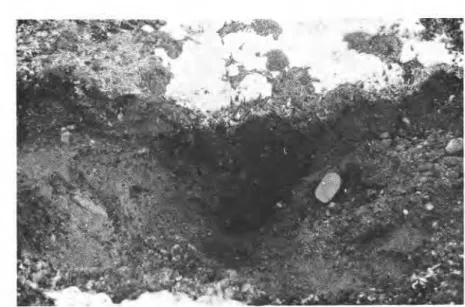
Fig. 7 Polygonal crack (snow covered) and peat wedge in active layer in Base Cgmp beach ridge, August 1970.
Fig. 8 Polygonal cracks in limestone near limestone-inland site, July 1971.
these two annual means and the maximum and minimum temperatures of each depth were used to plot the ground temperature envelope for each site shown in Fig. 5. The same mean annual ground temperature values for all sites are plotted on one graph to provide a visual comparison of them (Fig. 6). Active layer and depth of thaw detkrminations at all sites for the three summers of 1971, 1972, and 1973 are listed in Table 2. The depth of snowcover at each site is shown in Table 3.
Permafrost 23
Fig. 9 Turf hummocks near ice-wedge polygon site, August 1970.
Results and Discussion
Surface features characteristic of high latitude continuous permafrost conditions are prevalent in the Lowland. Polygons and polygonal cracks due to thermal contraction occur in the beach ridges (Fig. 7), meadows, and even the weathered limestone where the surface is fragmented (Fig. 8). Surface features associated with severe frost action in the active layer of fine-grained soils are also widespread (Washburn 1973). They include nonsorted circles (stony earth circles), stone nets, and turf hummocks (Fig. 9).
Although i t is risky to generalize on the permafrost ground temperatures
I on the basis of such a short observation period, some broad patterns appear to
exist. The Granite Gneiss Site had the highest mean ground temperatures for the one-year observation period of the exposed bedrock areas and the Limestone-Coast Site the lowest. The Upland Plateau Site had the smallest gradient in the study area. The Granite Gneiss and Limestone Sites had comparable ground temperature envelopes, the former being slightly larger, but the Upland Plateau displayed much smaller amplitudes of maximum to minimum temperatures. The Tundra-Meadow Site (hummocky sedge-moss meadow) was the warmest of the other sites and in fact it was warmer than the Granite Gneiss Site on the basis of the mean annual ground temperatures. There was wide variation among the three Beach Ridge Sites depending on slope orientation. The same was true of the Ice-Wedge Polygon Site, the centre being colder than the trench. At all sites the mean annual ground temperatures were slightly closer to the minimum temperatures in the envelopes than to the maximum.
Thickness of the active layer and depth of thaw varied greatly among the sites and from one summer to another (Table 3). Difficulties with temperature observations in the summers of 1972 and 1973 prevented a n accurate
assessment of active layer thickness similar to 1971. The general patterns indicated, however, that the Granite Gneiss Site had consistently the thickest
rock sites. For the other sites, the thickness of the active layer at the Beach Ridge Sites was similar to the Limestone Sites; the Tundra-Meadow Site had a thinner active layer, and the peat at the Ice-Wedge Polygon Sites the least, being similar to the Upland Plateau Site. The ground began to thaw from the surface in mid-to-late June as soon as the snow melted. By mid-September all thawed ground above the permafrost table was refrozen. Ground thawing was deepest in 1971, almost as deep in 1973, and much shallower in 1972.
The depth of snowcover was quite variable among the sites. The Granite Gneiss Site had the thinnest snowcover of the rock sites and the Limestone- Inland the thickest. The centre of the Ice-Wedge Polygon Site had the least snowcover, and other exposed sites such as the Beach Ridge top and the Limestone-Coast also had less snowcover than the other sites.
Permafrosr environmental relationships
Despite the short observation period, irregular readings, and shallowness of the thermocouple cables, some broad correlations are evident in the relationships between the permafrost and environmental factors.
Air temperature data were not ayailable for Truelove Lowland at the time of writing, so observations at Resolute were used to provide a general idea of yearly comparisons. The summers of 1971 and 1973 were considerably warmer than 1972. Degree days of thawing, based on monthly mean air temperatures for June, July, and August, were 255 in 1971, 116 in 1972, and 272 in 1973. January and February mean monthly air temperatures in the winter of 1971-72 were nearly 3°C colder than in 1972-73, about - 195°C in January and February 1972, and about -16.8"C in January and February 1973. Variations in the active layer (depth of thaw) were considerably less in 1972 than in the other two summers (Table 2). It was also found that for May and June 1972 the ground temperatures were 2-3°C colder than those of May and June 1973 as would be expected from colder air temperatures in the winter of 1971-72.
Snowcover is an important environmental factor throughout the permafrost region and its influence in Truelove Lowland was very marked during the observation period. Variations in mean annual ground
temperatures from one site to another due to snowcover were particularly evident at the Beach Ridge Sites and Ice-Wedge Polygon Site. The north slope of the Beach Ridge had the highest mean annual ground temperatures, due apparently to its having twice the depth of snow as the top and south slope. This ameliorating influence of the winter snowcover more than compensated for the lower ground temperatures near the surface and lesser depth of thaw that would be expected for a north slope in summer. At the Ice-Wedge Polygon Site, winter ground temperatures were higher in the trench, where snow accumulated to considerable depth in contrast to the centre which was windblown. In summer, the temperatures in the trench were similar to those in the centre and the depth of the thaw was the same at both locations.
The type of soil and rock has an important influence on the thickness of the active layer and the thickness of the permafrost. At the Tundra-Meadow Site and Ice-Wedge Polygon Site the surface peat layer was responsible for the thin active layers due to the insulative properties of this earth material. The dolomite (limestone) was found to have a higher thermal conductivity (11-12 m cal crn-'sec-'c-' or 4.20 to 4.62 W m-'k-') than the granite gneiss
(6 m cal cm-'sec-'~-' or 2.52 W m-'k-') (Brown 1973, Table 1). The decrease in amplitude of ground temperature with depth was more rapid for the Granite Gneiss Site as would be expected because of this factor.
Permafrost 25 Before the temperature observation program was initiated it was anticipated that the ground temperatures at the Upland Plateau Site would be lowest of all the sites because of its elevation, 300 m above Truelove Lowland. The Limestone-Coast proved, however, to have the lowest average annual ground temperature (-16.8OC) and the Upland Plateau the highest(-14.6OC). The slope of the former was much steeper than of the latter and the curves probably intersect a short distance below the bottom depth of the
thermocouple cables. The proximity of the Limestone-Coast site to the cold coastal seawater probably affected the summer ground temperatures. Amelioration of winter ground temperatures were possibly reduced with the formation of thick sea ice. The Upland Plateau Site ground temperature graph had the smallest temperature change with depth (smallest temperature gradient) of all the sites, which may indicate the thickest permafrost is at this location.
Acknowledgments
The author wishes to thank Dr. L.C. Bliss for inviting him to participate in the Devon Island Project which afforded the opportunity of obtaining permafrost information in the Canadian Arctic Archipelago. It would not have been possible to carry out these investigations, especially the drilling program, at such a remote location without the support facilities existing there. The Devon Island Project provided invaluable assistance in shipping equipment to the site. Thanks are due both to the International Biological Programme (I.B.P.) and the Arctic Institute of North America (A.I.N.A.) for providing
accommodation and support services. In this regard the assistance of Dr. G.M. Courtin, I.B.P. Field Director and Mr. Ward Elcock, A.I.N.A. Camp Manager is particularly appreciated.
Thanks are also due to Dr. Courtin for organizing the ground temperature observation program. Measurements were taken at different times by M. Claude Belcourt, Mr. B. Hubert, C.L. Labine, Miss Janet Marsh, Dr. R. Riewe and Dr. W. Speller. The author is indebted to these six individuals for persevering in the face of difficult field conditions and periodically
malfunctioning equipment. A special acknowledgment is due to M. Belcourt who carried out the observation program during the winter of 1972-73.
The author is grateful to Dr. L.W. Gold, N.R.C., Professor J.R. Mackay, Department of Geography, University of British Columbia; and Mr. G. Rempel, Imperial Oil Limited, for helpful suggestions on the manuscript.
The author wishes to acknowledge his appreciation to Dr. Judge for preparing the following section on permafrost thickness.
References
Brown, R.J.E. 1967. Permafrost in Canada. Map NRC 9769. National Research Council Canada, Division of Building Research, Ottawa, and Geological Survey of Canada Map 1246A.
.
1970. Permafrost in Canada - Its Influence on Northern Development. Univ. Toronto Press, Toronto. 234 pp..
1972a. Permafrost in the Canadian Arctic Archipelago. Zeitschr. Geomorphol. Suppl. No. 13: pp. 102-120..
1972b. Permafrost investigations on Devon Island, N.W.T. Canadian Tundra Biome Study Site (I.B.P.). 3045. In: Devon IslandI.B.P. Project-High Arctic Ecosystem. L.C. Bliss (ed.) Univ. Alberta, Edmonton. 413 pp.
.
1973. Influence of climatic and terrain factors on groundtemperatures at three locations in the Permafrost Region of Canada. pp. 27-34. In: Permafrost-Proceedings of North American Contributions to Second International Conference. National Academy of Sciences. Washington. 783 pp.
Cook, F.A. 1958. Temperatures in permafrost at Resolute, N.W.T. Geogr. Bull., No. 12: 5-18.
Judge, A.S. 1973. The prediction of permafrost thickness. Can. Geotech. J. 10: 1-11.
Misener, A.D. 1955. Heat flow and depth of permafrost at Resolute Bay, Cornwallis Island, N.W.T., Canada. Trans. Am. Geophys. Union. 36: 1055-1066.
Washburn, A.L. 1973. Periglacial Processes and Environments. Edward Arnold. London, England. 320 pp.
Calculations of permafrost thickness A.S. Judge
Earth Physics Branch, Deparfment of Energy, Mines, and Resources, Ottawa, Ontario
f i e equilibrium state and its perturbations
The simplest model of the thermal condition of the earth's crust is to consider a semi-infinite homogeneous body with a constant surface temperature and a constant terrestrial heat flow from below. In this case the surface temperatures, and hence the permafrost thickness, are dependent only on the above factors and the thermal conductivity of the rocks present:
T, = Ts +q_. z
k (1)
where T, represents the temperature at any depth z, T, is the surface temperature, q the terrestrial heat flow and k the thermal conductivity. In a multilayer media this can be generalised by rewriting k as:
n
k = _ L 2
&
z, i=l k, (2)
With the exception of highly contorted, complexly faulted, or folded areas the spatial variation of rock lithology, and hence thermal conductivity and equilibrium terrestrial heat flow, is small. Surface temperatures may vary considerably across the half space, however, due to such terrain factors as variations in elevation, exposure and vegetation, and presence of nearby bodies of water. If each of these features is assumed to have been present and possessed its present temperatures for an infinite time, then the change to the subsurface temperature at a point from that for an infinite half space with constant surface temperature (assumed to be collar temperature) is
proportional to the solid angle subtended by the feature fl and its temperature difference from the collar temperature V, and is given by:
-
AT, = Z;u.
A,VPermafrost 27 Analytical results for R are available in polar coordinates, which is the simplest configuration to use when estimating or predicting temperatures measured in a borehole or below a point on the earth's surface. A simple polar grid is established following the method of Jeffreys (1940).
It is again reasonable to assume a constant equilibrium terrestrial heat flow and thermal conductivity for many temporal problems outside of young volcanic areas or areas with rapid sedimentation or erosion. Surface
temperatures have changed considerably with time in response to fluctuations in the Pleistocene ice sheets, postglacial marine submergence and emergence, and changes in terrain features. These variations can be represented by a simple step function and becomes:
where K is the thermal diffusivity of the medium.
Thermal parameters
Surface temperatures at the thermocouple cable sites on Truelove Lowland and adjacent upland are shown in Table 4. They vary from -16.8OC at the Limestone-Coast Site near sea level to -14.6OC at the Upland Plateau Site with an elevation of 306 m. Little difference is noted between the latter location and inland sites on the Lowland. Seawater temperatures were not measured at the Lowland but water temperatures at another location at the same latitude and where the sea remained largely ice-covered in the summer averaged -1.7OC. Temperatures in the lakes and ponds are not available either and so have been assumed to be slightly above O°C, i.e., 1°C.
Measured average thermal conductivities range from 2.51 W m - ' ~ - ' for the granite gneisses, 3.35 for the sandstones, and 4.5 for the dolomitic limestones. Local undisturbed equilibrium heat flow in that locality is
unmeasured but following Judge (1973) probably varies between 62.7 m ~ m - l and 83.6 and thus calculations have been carried out using both values.
Lithological characteristics at each of the sites at which calculations were made are shown in Table 1.
Calculations
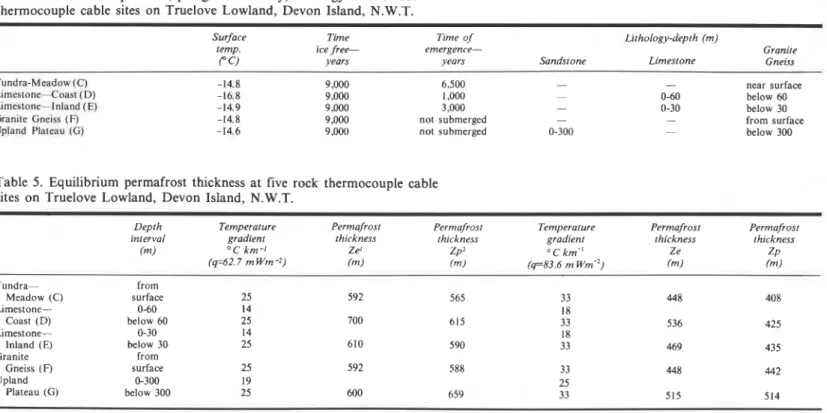
Assuming equilibrium conditions initially and the absence of any topographic features the distribution of permafrost would be Ze as shown in Table 5. Permafrost thickness ranges from 592 to 700 m for a heat flow of 62.7 m ~ m - l . The variations in thickness are due only to the lithological variations at different sites.
At each of the sites a polar grid was drawn with radii drawn at 10' intervals and 30 concentric rings around the borehole collar to a maximum radius of 2500 m. The resulting topographic information derived at each intersection of radius and circle presented a digital map of the land surface consisting of 1080 points which was used to calculate topographic corrections. Zp in Table 5 shows the values of permafrost thickness corrected for the presence of topographic features appearing after the disappearance of glacial ice.
Finally and most important, changes of the surface with time must be taken into account. It is assumed using the data presented by Prest (1970) that at a time before 9000 years ago the glacial ice cover was complete across the area and that ice bottom temperatures were similar to present surface temperatures. This is reasonably consistent with the present measured ice
thermocouple cable sites on Truelove Lowland, Devon Island, N.W.T.
Surface Time Time of Lithology-depth (m)
temp. ice free- emergence- Granite
p c ) years years Sandstone Limestone Gneiss
Tundra-Meadow (C) -14.8 9,000 6,500 - - near surface
Limeslone-Coal (D) -16.8 9,000 1,000 - 0-60 below 60
Limeslone.- Inland ( E ) -14.9 9,000 3,000 - 0-30 below 30
Granite Gncisr; (F) -14.8 9,000 not submerged - - from surface
Upland Plalc;~u (C;) -14.6 9,000 not submerged 0-300 - below 300
Table 5. Equilibrium permafrost thickness a t five rock thermocouple cable sites o n Truelove Lowland, Devon Island, N.W.T.
Depth Temperature Permafrost Permafrost Temperature Permafrost Permafrost interval gradient thickness thickness gradient thickness thickness
fm) OC km-1 Ze' Zp2 " C km-I Ze ZP (q=62.7 m W m -2) (m) fm) (q=83.6 m ~ m - ~ ) (m) ( 4 Tundra- from Meadow (C) surface 25 592 565 33 448 408 Limestone- 0-60 14 18 Coast (D) below 60 25 700 615 33 536 425 Limestone- 0-30 14 18
Inland (E) below 30 25 610 590 33 469 435
Granite from
Gneiss (F) surface 25 592 588 33 448 442
Upland 0-300 19 25
Plateau ( G ) below 300 25 600 659 33 515 514
'No consideration of topographic features.
5
'Correction for topographic features.
d
Permafrost
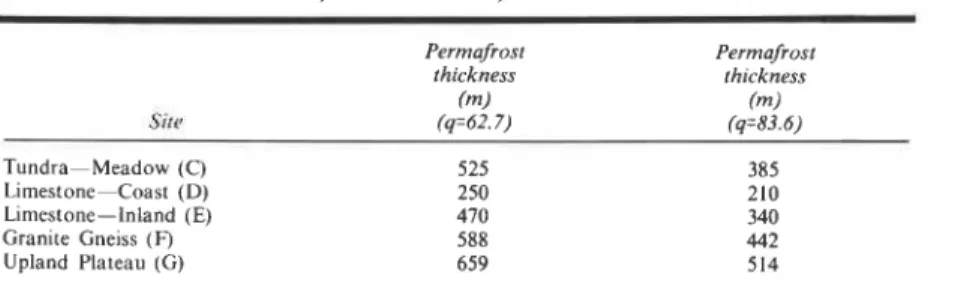
Table 6. Probable permafrost thickness at five rock thermocouple cable sites on Truelove Lowland, Devon Island, N.W.T.
Permafrost Permafrost thickness thickness fm) (m) (q-62.7) ( ~ 8 3 . 6 ) Tundra-Meadow (C) Limestone-Coast (D) Limestone-Inland (E) Granite Gneiss (F) Upland Plateau ( G )
bottom temperatures in the Arctic (Paterson 1968, Hansen and Langway 1966). About 9000 years ago the ice was removed, but because of isostatic changes in land elevation and eustatic changes in sea-level any land at present below an elevation of 70 m is assumed to have been submerged and then to have slowly emerged according to Walcott's (1972) pattern of emergence for Jones Sound. The permafrost thickness values calculated for this effect are shown in Table 6 and these values should approximate fairly closely the thicknesses to be observed in Truelove Lowland. It should be emphasized that this is a very simplified set of circumstances to simplify the mathematical calculations. Further complications such as latent heat, zoning of lake temperatures with depth, zoning of ground surfaces according to snow cover, vegetation cover, aspect, etc., could be included as well as more complex surface history situations. The only limitations on the sophistication of the models is the available experimental data and the cost of computing.
Conclusions
Permafrost thickness at Truelove Lowland may be as thin as 210 m in coastal areas (Limestone-Coast Site) and as thick as 659 m on the adjacent upland (Upland Plateau Site). The presence of a nearby relatively warm sea has a
highly modifying influence on coastal areas increasing the subsurface temperature at the Limestone-Coast Site by 6°C at a depth of 90 to 170 m. Likewise the uplift history and the time since emergence from the sea is highly significant causing a further modification of temperature at the stated depths by 2.5 to 4.8OC and causing a maximum disturbance at 400 m of 7.3OC. In contrast the permafrost thickness at the Upland Plateau Site has probably been little modified by either of these influences.
References
Hansen, B.L. and C.C. Langway. 1966. Deep core drilling in ice and core analysis at Camp Century, Greenland 1961-1966. Antarctic J . 1:207- 208.
Jeffreys, H. 1940. The disturbance of the temperature gradient in the earth's crust by inequalities of height. Month. Nat. Roy. Astron. Soc., Geophys. Suppl. 4: 309-3 12.
Judge, A.S. 1973. The prediction of permafrost thickness. Can. Geotech. J. 10: 1-11.
Paterson, W.S.B. 1968. A temperature profile through the Meighen Ice-Cap, arctic Canada. IUGG Commission Snow and Ice Rept. No. 79: 440449.
Prest, V . K . 1970. Quaternary Geology of Canada. Chap. 12. pp. 674-764. In: Geology and Economic Minerals of Canada. 5th Ed. Geol. Surv. Can. 838 PP.
Walcott, R.I. 1972. Late Quaternary vertical movements in Eastern North America: quantitative evidence of glacio-isostatic rebound. Rev. Geophys.
10: 849-884.
I
I !