HAL Id: hal-02454652
https://hal.uca.fr/hal-02454652
Submitted on 31 May 2020
HAL is a multi-disciplinary open access
archive for the deposit and dissemination of
sci-entific research documents, whether they are
pub-lished or not. The documents may come from
teaching and research institutions in France or
abroad, or from public or private research centers.
L’archive ouverte pluridisciplinaire HAL, est
destinée au dépôt et à la diffusion de documents
scientifiques de niveau recherche, publiés ou non,
émanant des établissements d’enseignement et de
recherche français ou étrangers, des laboratoires
publics ou privés.
of healthy adults
Mercedes Quintana, Mercédès Quintana, Olivier Palicki, Géraldine Lucchi,
Patrick Ducoroy, Christophe Chambon, Christian Salles, Martine Morzel
To cite this version:
Mercedes Quintana, Mercédès Quintana, Olivier Palicki, Géraldine Lucchi, Patrick Ducoroy, et al..
Inter-individual variability of protein patterns in saliva of healthy adults. Journal of Proteomics,
Elsevier, 2009, 72 (5), pp.822-830. �10.1016/j.jprot.2009.05.004�. �hal-02454652�
Inter-individual variability of protein patterns in saliva of
healthy adults
Mercedes Quintana
a,b,c, Olivier Palicki
a,b,c, Géraldine Lucchi
d, Patrick Ducoroy
d,
Christophe Chambon
e, Christian Salles
a,b,c, Martine Morzel
a,b,c,⁎
aINRA, UMR 1129 FLAVIC, F-21000 Dijon, France bENESAD, UMR 1129 FLAVIC, F-21000 Dijon, France
cUniversité de Bourgogne, UMR 1129 FLAVIC, F-21000 Dijon, France d
CLIPP « Clinical Innovation Proteomic Platform », IFR 100 Santé-STIC, F-21000 Dijon, France
e
INRA, Plate-forme « Exploration du métabolisme », F-63122 St Genès Champanelle, France
A R T I C L E I N F O
A B S T R A C T
Article history:
Received 11 March 2009 Accepted 18 May 2009
In order to document inter-individual variability in salivary protein patterns, unstimulated whole saliva was obtained from 12 subjects at 10 am and 3 pm of the same day. Saliva proteins were separated using two-dimensional gel electrophoresis, and semi-quantified using image analysis. One-way ANOVA was used to test the effects“time of sampling” and “subject”. Data were further explored by multivariate analyses (PCA, hierarchical clustering). Spots of interest were identified by mass spectrometry (MALDI-TOF MS/MS and nanoLC ESI-IT MS/MS). A dataset of 509 spots matched in all gels was obtained. There was no diurnal statistical effect on salivary patterns while inter-individual variability was high with 47 spots differentially expressed between subjects (p < 1%). Clustering of these spots revealed that subjects could be discriminated first based on several proteins participating to the non-specific immune response (cystatins, lipocalin 1, parotid-secretory protein and prolactin-induced protein). Independently, subjects were also differentiated by their level of proteins originating from serum and involved in the immune system (complement C3, transferrin, IgG2), as well as the relative abundance of enzymes involved in carbohydrates metabolism (amylase and glycolytic enzymes). Inter-individual variability should be accounted for when searching for salivary biomarkers or when studying in-mouth biochemical mechanisms.
© 2009 Elsevier B.V. All rights reserved. Keywords: Saliva Proteome Salivary patterns Inter-individual variability
1.
Introduction
Studies on characterisation of human saliva proteome have recently flourished with the advent of efficient methods, combining electrophoretic or chromatographic separation of protein mixtures with mass spectrometry-based protein identification [1–5]. 2-D electrophoresis allows the compre-hensive characterisation of relatively abundant proteins, while LC-MS may in some cases detect proteins present in extremely low quantities. Such highly resolutive and com-plementary techniques have revealed the complexity of
saliva. For example, a recent publication of the “Human Salivary Proteome Consortium” reports the identification of 1166 proteins from parotid and submandibular/sublingual salivas[6]. Even more proteins are expected in whole saliva, since it also contains proteins from other glands and from the gingival crevicular fluid, a transudate of blood plasma.
Besides being complex, saliva is also a dynamic fluid and its protein composition for a given subject may qualitatively vary. Thus, taste stimulation induces changes in proteome patterns [7]. Differences in the proportions of specific low molecular weight peptides have also been detected in parotid saliva at ⁎ Corresponding author. INRA, UMR1129 FLAVIC, F-21000 Dijon, France. Fax: +33 380 69 34 03.
E-mail address:Martine.Morzel@dijon.inra.fr(M. Morzel).
1874-3919/$– see front matter © 2009 Elsevier B.V. All rights reserved. doi:10.1016/j.jprot.2009.05.004
a va i l a b l e a t w w w. s c i e n c e d i r e c t . c o m
different times of the day[8]. Other studies, although they did not strictly compare the same subjects, suggest that saliva protein composition may vary with age in infants. For example, the proportions of the various isoforms of Proline-Rich Proteins (PRPs) varied with post-conception age in newborns[9]. Finally, proteome pattern modifications were evidenced between groups of subjects either healthy or suffering from oral or systemic pathologies[10,11]. In addition to this plasticity in response to age, condition or environmental factors, one should also consider the variability from one subject to another due to genetic polymorphism. The highly polymorphic character of several salivary proteins, in particular PRPs, has long been recognised (for a review, see[12]).
In this context, any study based on proteome analysis of saliva, be it for diagnostics purposes[13]or comprehension of in-mouth mechanisms, needs to take into account variability in protein profiles within a group of subjects. However, very few studies provide data on this topic. Morales-Bozo et al.[14]used 1-D electrophoretic separation to characterise polypeptide salivary profiles in a healthy population, and found overall no age or sex effect but observed inter-individual variations. Variability was also examined using intact protein LC/ESI-TOF mass spectrometry[15], which technically restricts the observa-tions to low molecular proteins (< 15 kDa). The authors demonstrated that day-to-day intra-subject and even more so inter-subject salivary protein variation is significant. The objective of the present work was therefore to formally document inter-subjects variability in 2-D electrophoretic salivary patterns.
2.
Materials and methods
2.1. Saliva collection and processing
Twelve volunteers (6 women, 6 men; 26–47 years old; non smokers; salivary flow in resting conditions >0.5 ml min− 1) were recruited for the study. Written informed consent was obtained from all participants. Two sampling sessions took place at 10:00 am and 3:00 pm of the same day. Subjects were instructed to refrain from eating or drinking at least one hour before the sessions. They spat out saliva accumulating freely in their mouth as frequently as desired over a duration of 2 min. Samples were immediately centrifuged at 14,000 g for 20 min at 4 °C. The supernatant was submitted to ultrafiltration at 15,000 g for 30 min at 10 °C using spin columns with a 5 kDa cut-off (Vivaspin 500, Sartorius AG, Germany). Aliquots of the resulting protein extracts (n = 24) were stored at−80 °C until analysis. 2.2. 2-DE analysis
The samples were analysed in series of 6 gels. Samples were randomly assigned to the series. Protein concentration was measured in the extracts following the Bradford's method. The first dimension was performed using 17 cm 3–10NL IPG strips (Bio-Rad) on a PROTEAN (Bio-Rad) IEF cell. Protein extracts were suspended in a buffer containing 7 M urea, 2 M thiourea, 2% w/v CHAPS, 0.1% w/v DTT, 1% v/v 3–10 carrier ampholytes and 0.3% v/v protease inhibitors (SIGMA). Strips were loaded with 150 µg of protein for analytical gels and
800 µg for preparative gels, and rehydrated at 20 °C for 13 h at 0 V and 8 h at 50 V. Isoelectric focusing was carried out at a final voltage of 8000 V for a total of 60 kVh. Thereafter, strips were equilibrated for 15 min and 20 min in two consecutive solutions of 6 M Urea, 50 mM Tris–HCl pH 8.8, 30% v/v glycerol, 2% w/v SDS, to which was added DTT at 1% w/v or iodoacetamide at 2.5% w/v. Strips were then placed on 12% SDS-polyacrylamide gels and electrophoresis was performed at 50 mA per gel on a PROTEAN II Multi Cell (Bio-Rad). Analytical gels were silver stained[16]and preparative gels were stained using the so-called Blue silver protocol[17]. 2.3. Image analysis and statistical treatment
Gel digital images were acquired with the Image Scanner (Amersham Biosciences) and analysed using SameSpots soft-ware v.3.0. Quantities of matched spots were normalised by calculating the ratio of each spot's quantity to the total quantity of valid spots in a gel. Data were expressed in ppm. Finally, in order to make the variance independent of the mean, data were transformed into log before statistical treatment. The dataset was analysed using the Statistica software (StatSoft, Tulsa, OK, USA). It was first submitted to a Principal Component Analysis using all 509 spots as variables. Data were then submitted to one-way ANOVA testing three factors: time of sampling (morning/afternoon), gender, and subject. A spot was considered significant when it was associated to a p-value < 1%, and a fold-change above 2 for the two-level factors “time of sampling” and “gender”. Specifically for the description of intra-individual variability, significant spots were selected and they were subjected to a Principal Component Analysis. Data for these 47 spots and 12 subjects were visualised by heatmap and ascendant hierarch-ical cluster analysis (method of Ward based on Euclidian distances) using the software PermutMatrix[18].
2.4. Mass spectrometry-based protein identification Spots of interest were excised manually, washed in NH4HCO3
0.1 M for 10 min and dehydrated in ACN for 10 min. Dry spots were incubated successively in 10 mM TCEP/0.1 M NH4HCO3for
30 min at 37 °C, in 55 mM iodoacetamide/0.1 M NH4HCO3for
20 min, in 0.1 M NH4HCO3for 5 min and in ACN for 5 min.
Digestion was performed in two steps: spots were first pre-incubated for 30 min at 4 °C in 20 µL of a 40 mM of NH4HCO3/10%
ACN solution containing 10 ng/µl of trypsin (V5280, Promega, USA). 15 µl of this solution was subsequently removed and 10 µL of 40 mM NH4HCO3/10% ACN was added, prior to incubation at
37 °C for 2 h. Peptides were collected in the two successive supernatants obtained after addition of 0.5% TFA and ACN (1 µl and 10 µl, respectively) and sonication for 10 min.
For MALDI-TOF analysis, peptides were further concentrated on C18 beads (Invitrogen) following the manufacturer's instruc-tions. 0.5 µl of the concentrate was loaded onto a Ground Steel target, mixed with 1 µl of matrix solution (3.5 mg/ml CHCA in ACN 50%, TFA 0.25%) and allowed to dry. The target was introduced in a mass spectrometer MALDI-TOF (Ultraflex, Bruker Daltonics, Bremen, Germany). Ionisation was performed in MS and MS/MS (PSD-LIFT technology) by irradiation of a nitrogen laser (337 nm) operating at 50 Hz. Data were acquired at
a maximum accelerating potential of 25 kV in the positive and reflectron modes. The MALDI mass spectra were calibrated using the Peptide Calibration Standards from Bruker Daltonics. The software packages Ultraflex version 3.0, Flex control, Flex Analysis and Biotools version 3.1 were used to record and analyze the mass spectra. The database search was performed with Mascot in the MSDB database. Methionine oxidation was accepted as a variable modification and carbamidomethyl modification of cysteine as a global modification. Mass devia-tion tolerance was set at 80 ppm in MS mode and 0.5 Da in MS-MS mode.
When identification by MALDI-TOF proved unsuccessful, identification was also attempted using nano LC-ion trap MS/ MS analysis. HPLC was performed with an ULTIMATE LC SYSTEM combined with Famos autosample and Switchos II microcolumn switching for preconcentration (LC Packings, Amsterdam, The Netherlands). Six µl of the supernatant containing peptides were loaded on the column PEPMAP C18, 5 µm, 75 µm ID, 15 cm (LC Packings) using a pre-concentration step in a micro pre-column cartridge (300 µm ID, 1 mm). Supernatants were loaded on the pre-column at 30 µL/min. After 3 min, the pre-column was connected with the separating column and the gradient was started at 200 nL/min. The buffers were 5% ACN, 0.5% HCOOH in water (A) and 5% H2O, 0.5% HCOOH in ACN (B). A linear gradient
from 10 to 90% B for 45 min was applied. For ion trap MS, a LCQ DECA with a nano electrospray interface (Termo Fisher Scientific, Les Ulis, France) was used. Ionisation (2.2 kV ionisation potential) was performed with a liquid junction and a non-coated capillary probe (New Objective, Cambridge, USA). Peptide ions were analyzed by the data-dependent“triple play” method: (i) full MS scan (m/z 400–1400), (ii) zoomscan (scan of the major ion with bigger resolution), (iii) MS/MS of this ion. Identification of peptides was performed with Mascot 2.2, restricting the taxon-omy to Homo sapiens (216,961 sequences) in the protein NCBInr 20080912 database. Mass deviation tolerance was set at 0.4 Da. Protein identification was validated when at least two peptides originating from one protein showed significant identification scores.
3.
Results
3.1. Protein concentration in the protein extracts
Protein concentration in the extracts ranged from 2.09 to 8.58 µg µl− 1, at the exception of one subject who showed a concentration of 26.1 µg µl− 1 (average of the morning and afternoon samples). Excluding data from this outlier, protein concentration in the extracts was on average 4.68 ± 1.83 µg µl− 1 (n = 11) and 5.38 ± 1.84 µg µl− 1(n = 11) for morning and afternoon samples, respectively, and 4.95 ± 1.71 µg µl− 1(n = 12) and 5.13 ± 2.04 µg µl− 1 (n = 10) for females and males, respectively. Differences between genders or between morning and after-noon samples were not significant.
3.2. Variability in protein patterns 3.2.1. Global proteome patterns
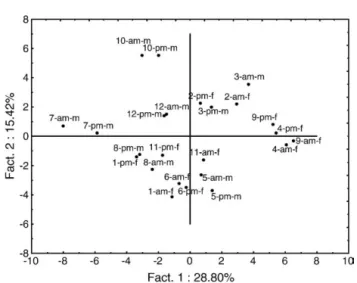
509 spots matched across all gels were retained for the analysis. Projection of observations (gels) on the PCA plot of the proteome
data are shown inFig. 1. This plot displays the first 2 principal components, which account for 27% of variation in the samples. The plot provides a first overall picture of variability within samples. Considering in particular the two potential factors of variation“time of sampling” and “gender”, it is clear that they are not preponderant factors in samples' variation since they do not separate samples in two distinct groups on the represented 2D space. This is confirmed by results of ANOVA: no spots were considered significantly different between the two times across the whole group of subjects, and only 3 spots (one unidentified, one cystatin SN, one parotid secretory protein) were signifi-cantly different between males and females, all over-expressed in females.
Concerning intra-individual variability, the two samples corresponding to the same subject are in general located at a moderate distance. Some subjects are characterised by very reproducible proteome patterns (e.g. subject number 10) while others are more variable in their patterns between morning and afternoon (e.g. subject number 1).
3.2.2. Inter-subject variability
Subjects' specificities were the greatest source of variability in the data since 47 spots were differentially expressed between subjects (Table 1). Observing the experimentally estimated vs theoretical molecular weight of identified proteins, it appeared that four spots (195, 280, 297, 468) were putative fragments, i.e., their estimated molecular weight were largely below the molecular weight of the native protein. However, for spot 195 identified asα-amylase, results of MS identification showed that peptides both at the N- and C-terminal extre-mities were matched to the sequence of the entire protein. The discrepancy between the estimated and theoretical MW was therefore probably due this isoform of amylase being submitted to internal deletions prior to secretion in the oral cavity, as speculated by Hirtz et al.[19]. Therefore, apart from three fragments, all identified spots corresponded to intact proteins. When projecting observations on the PCA space generated by those 47 spots (Fig. 2), i.e., focusing on data Fig. 1– Principal component analysis scores plot derived from the entire set of proteome data for 12 subjects. Observations are labelled as follows: subject number (1 to 12)– time of sampling (am/pm)– gender (m/f).
allowing the discrimination between subjects, the morning and afternoon samples for one given subject were closely grouped. When comparing these results with those presented in Fig. 1, this translates the fact that the subject-specific signature constituted by those spots is more conserved within the day than the global proteome patterns.
Among significant spots, some spots were particularly variable in the population considered, as for example the spot 183 (cystatin D) which proportion varied more than 15-fold between the subjects with the highest and lowest
quantities respectively. Fig. 3 represents a zoom of the gel region containing this particular spot for the 12 subjects, illustrating the large variability in abundance of this particular isoform of cystatin D. It was represented as an extremely faint spot corresponding to minute quantities in some subjects, and as a pronounced spot in others. Finally, Fig. 4 shows the heatmap representation of the 47 significant spots and 12 subjects. Two main clusters of spots emerge, which clearly correspond to different functional group. Thus, the first cluster groups various enzymes (amylase, enolase 1, glyceraldehyde
Table 1– List of spots differentially represented (p<1%) between subjects: identifications and descriptors of proteins (accession number, estimated vs theoretical MW in kDa), minimum (min), maximum (max) and median values in ppm and fold change between the minimum and maximum values in ppm (FC max).
Spot Identification, accession number and abbreviation Estimated vs theoretical MW min (ppm) max (ppm) median (ppm) FC max
16 Glyceraldehyde 3-P dehydrogenase (gi120649)-GAPDH 38.7/35.9 616 8845 3320 14.34
25 449 4468 1304 9.93 51 196 2013 296 10.25 60 154 1253 669 8.12 62 97 419 188 4.32 68 127 931 487 7.31 72 321 2232 581 6.95 93 1154 3387 1708 2.93 149 Lipocalin 1 (gi 4504963) 15.8/17.5a 1492 11669 5738 7.82 174 Transferrin (gi 136191) 72.3/77.0 1253 5460 2026 4.36 176 2055 6542 2862 3.18 183 Cystatin D (gi 118186) 11.7/13.9a 459 7050 2820 15.35 195 α-amylase (gi 157833830) 33.3/55.7 925 2461 1487 2.66 204 108 757 172 7.01 210 α-amylase (gi 157833830) 54.2/55.7 739 3309 1829 4.48 219 107 806 344 7.48 223 Cystatin SN (gi 118188) 13.3/14.3a 154 976 249 6.32
244 Prolactin-inducible protein (gi 134170)— PIP 16.6/16.6 1085 14561 2124 13.41
256 α-amylase (gi 157833830) 48.3/55.7 322 913 441 2.83
257 Prolactin-inducible protein (gi 134170)— PIP 18/16.6 1382 9629 5036 6.96 280 Parotid secretory protein -fragment (gi 16755850)— PSP 12.5/27.1 303 1722 824 5.67 297 Complement C3-fragment (gi 179665) 70.5/189.3 804 3375 2215 4.19
300 106 709 127 6.65
313 424 1311 757 3.09
344 Parotid secretory protein (gi 16755850)— PSP 32.0/27.1 3016 13912 6786 4.61
362 286 1412 463 4.92 399 Cystatin D (gi 118186) 11.7/13.9a 521 4109 1607 7.87 410 373 1786 1194 4.79 421 285 1571 804 5.51 424 Cystatin SN (gi 118188) 12.3/14.3a 834 2446 1734 2.93 425 21 101 44 4.70 429 169 677 362 4.01 430 365 1603 736 4.39 434 274 1547 680 5.63
442 Immunoglobulinγ 2 heavy chain (gi 184758) — IgG2 56.5/35.8 3314 10017 4642 3.02
460 597 2178 1408 3.65
468 Prolactin-inducible protein -fragment (gi 134170)— PIP 11.2/16.6 1509 11583 7107 7.67 470 Prolactin-inducible protein (gi 134170)— PIP 17.1/16.6 8597 22410 13736 2.61
471 1066 7035 2345 6.60
472 329 1362 957 4.14
476 α-amylase (gi 157833830) 54.2/55.7 1945 5680 4122 2.92
477 196 843 425 4.29
483 Prolactin-inducible protein (gi 134170)— PIP 15.5/16.6 1105 13004 1960 11.77
485 559 2230 1292 3.99
487 Phosphoglycerate mutase (gi 49456447) 29/28.8 1041 3188 2038 3.06
498 Enolase 1 (gi 119339) 50.7/47.2 580 2603 1633 4.49
503 Lipocalin 1 (gi 4504963) 14.8/17.5a 819 6211 3272 7.58 aThe reported theoretical molecular weight is that of the mature chain of the protein.
3-phosphate dehydrogenase and phosphoglycerate mutase) and proteins originating from serum (transferrin, complement C3, immunoglobulin gamma2), while the second cluster is composed of many isoforms of four proteins: cystatins (D and SN), prolactin-inducible protein, parotid secretory protein and lipocalin1. As to the clustering of subjects, it does not reveal straightforward groups, which again confirms the high inter-individual variability. Looking in more details, it is however possible to find subjects with comparable profiles. For exam-ple, in the sub-cluster including spots 297 to 434 (framed in Fig. 4), subjects 10, 12, 7 and 1 tend to show a low abundance of
these proteins in contrast to subjects 4 and 9 who are characterised by a high proportion of these proteins.
4.
Discussion
This study was designed to characterise variability in whole saliva proteome 2-D electrophoretic patterns of healthy adults. Overall and across the group of subjects, we found that there was no diurnal effect and a very moderate gender effect on salivary profiles, while inter-individual variability was significant.
Circadian and diurnal variations in saliva composition have been largely documented, in particular in relation to the neuroendocrine system function. For example, variations have been reported in the levels of hormones such as cortisol[20], melatonin [21] and leptin [22]. When it comes to salivary proteins and peptides present at higher concentrations, a general trend repeatedly reported is an increase of protein content in whole saliva during the day (e.g.[23]). Here, although there was a slight increase of protein content in the extracts, the difference remained statistically non-significant. This is not entirely surprising given the fact that only 5 h separate the two sampling points. The literature also reports quantitative varia-tions in specific protein compounds, such asα-amylase[23,24], immunoglobulin A [25] or histatins [26,27] but not of other constituents, namely kallikrein [23] or statherin [26]. This suggests indirectly that salivary profiles vary within a day. However, direct information on diurnal profiles, i.e., adjusting for differences in protein concentration, is not plethoric. Hardt et al.[8]quantified low-molecular weight peptides in parotid saliva within a day, and observed 5 categories of peptides exhibiting distinct diurnal variations. In contrast, and in accordance with our findings, Neyraud et al.[7]reported stable profiles of proteins separated by 2-D electrophoresis, i.e., in the Fig. 2– Principal component analysis scores plot derived from
a dataset made of 47 spots differentially represented between subjects (p<1%), for 12 subjects. Observations are labelled as inFig. 1.
Fig. 3– Zoom area of the gel region (approximate pI range 6.5–7.5, and MW range 15–16.5 kDa) containing spot 183, identified as cystatin D, for 12 subjects. One gel per subject was chosen.
approximate MW range 10–100 kDa. This great stability of protein profiles within a day means that in mechanistic studies, in particular linking proteome patterns to in-mouth sensory perception, saliva sampling does not need to be performed at the exact same time of the day.
Concerning the effect of gender, it was in our study extremely limited. Sex hormonal regulation of specific
sali-vary proteins expression has been previously reported in rodents, in particular the expression of small 20–25 kDa proteins [28]. Lipocalins were subsequently described as being more abundant in male rat submandibular glands[29]. In humans, the higher prevalence of caries in women has been suggested to be partly due differences in saliva composition and flow rates induced by hormonal fluctuations.[30]. Looking Fig. 4– Heatmap visualising the level of 47 spots differentially represented between subjects (p<1%), for 12 subjects. Each column represents the data (average of morning and afternoon samples) for one subject. Rows represent individual proteins. Row data were mean-centered and the colour code is graduated from green (under-representation compared to the group mean) to red (over-representation compared to the group mean). Hierarchical clustering analysis was used to organise the map. Abbreviations are as inTable 1.
more specifically at individual proteins, levels of α-galactosi-dase [31] or α-amylase activity [24] were reported to be independent of gender. Conflicting results are found for secretory IgA, from over-expression in women[32], no effect of gender[33]or over-expression in men[34]. A gender effect was reported for the abundance of mucins MG1 but not MG2 [35]. Kivela et al.[36]compared the results of two independent studies and concluded that CAVI was present at lower levels in saliva of young women compared to that of young men. Finally, up-regulation of PSP (parotid secretory protein) by estradiol was demonstrated in vitro[37]. Our results are in accordance with the latter finding since one spot correspond-ing to PSP was over-represented in women. However, overall, differences in profiles between men and women were mini-mal, consistently with results of a study comparing 1-D electrophoretic profiles of saliva proteins and concluding that they were not influenced by gender[14].
In contrast to the two factors“time of sampling” and “gender” which had close to no effect at the group level on saliva proteome profiles, inter-individual variability was quite significant. Such an observation has been repeatedly reported [6,7,14,15], and variability was described as exceeding that of plasma[15]. What the present study additionally documents is the identification and classification of proteins which are discriminating subjects. First, because the majority of identified proteins appeared to be intact proteins, and not fragments, proteolysis was most probably not a predominant explanatory factor in the between-subject variations observed. This is noteworthy given the importance of proteolysis in the oral cavity but it is in agreement with reports of a high consistency of proteolytic profiles generated in whole saliva collected from different healthy subjects[38]. Second, one should note that spots which levels varied between subjects often corresponded to different isoforms of the same protein (e.g. 4 spots identified asα-amylase, 5 spots identified as PIP). It was previously described that many spots separated on 2-D gels correspond to the same accession number, which was explained by extensive in vivo post-translational modifications or processing of salivary proteins[3]. It is therefore unlikely that the overall abundance of one protein, which could be evaluated by immunological techniques for example, is correlated to the abundance of specific isoforms. To further support this, Fig. 4 reveals for example that the α-amylase isoforms have contrasted levels of expressions within the group. Thus, spots 256 and 476 are generally less abundant than the group average in subjects 7, 1, 6, 5, 11 and 8 but this trend does not stand for spots 195 and 210. These results illustrate that, when searching for salivary biomarkers, it is necessary to use highly resolutive techniques which allow discriminating between the many isoforms of abundant proteins.
Hierarchical cluster analysis revealed two main groups of spots, suggesting that protein expression in these two large groups is independent, i.e., probably regulated by separate mechanisms. Both clusters contain proteins secreted by salivary glands (e.g. parotid secretory protein andα-amylase), which rules out the hypothesis that protein source (secretion of glands, filtrate of serum, cellular debris etc.) is solely at the origin of protein clustering. Quite strikingly, one cluster was composed of proteins homogenous in function. Thus, cystatins and lipocalin 1 are inhibitors of cysteine proteases[39,40]and in that respect are involved in mucosal defense. Cystatins are also reported to
have antibacterial and antiviral properties[41]and lipocalin 1, PSP and PIP participate to the innate immune response[42]. This cluster of spots therefore corresponds to proteins generally involved in the non-specific protection of the oral cavity. Another common feature of these proteins is to be secreted by salivary glands. In contrast, the second cluster is more hetero-genous: it contains proteins originating from serum and involved in the innate or adaptive immune systems (comple-ment C3, IgG2, transferrin), but also enzymes of the carbohy-drates metabolism, namely amylase and enzymes of the glycolytic pathway (GA3PD, phosphoglycerate mutase and enolase 1). Several glycolytic enzymes have previously been identified as constituents of human saliva [6] and of the acquired enamel pellicle[43], but very little is said about their physiological significance in the oral cavity. Decreased levels of enolase 1 were observed in saliva of patients suffering from oral bleeding [10] or in healthy subjects after stimulation by bitterness [7]. In both cases, however, no explanation or hypothesis was provided. Whether glycolytic enzymes remain functional in an extracellular medium is unlikely: glycolysis is a highly integrated pathway relying on equilibrium between enzymes involved in the successive reactions, demanding an initial input of energy and the constant regeneration of co-factors. The presence in saliva of glycolytic enzymes could therefore merely reflect the basal level of glycolysis in mucosal and/or glandular cells of the oral cavity. In pancreaticβ-cells, genes coding for glycolytic enzymes were induced by exposure to glucose [44], i.e., in conditions simulating diet-induced glucose elevation. It is plausible that this mechanism also applies to the salivary glands, especially considering the clustering of glycolytic enzymes with amylase. Salivary amylase gene copy number, correlated with expression at the protein level, has thus recently been reported to be higher in popula-tions with traditionally high-starch diets [45]. On a different scale, namely at the individual level, induction of salivary amylase by tannin-enriched diets was observed in mice[46]. We therefore propose that dietary habits may be partly at the origin of the observed inter-individual variability in salivary enzymes. To summarise, we observed that in the studied population, subjects could be discriminated based on the expression profiles of two clusters of spots. One was composed of secreted proteins involved in the non-specific immune system. In addition, and independently, subjects also presented a specific pattern of proteins involved in the immune response but originating from serum. A last group of spots, variable between subjects but somehow linked to those proteins of serum origin, was made of spots involved in carbohydrates metabolism which may be regulated by dietary habits. On-going research in our laboratory will further document this diet-induced modification of salivary proteins representation.
R E F E R E N C E S
[1] Ghafouri B, Tagesson C, Lindahl M. Mapping of proteins in human saliva using two-dimensional gel electrophoresis and peptide mass fingerprinting. Proteomics 2003;3:1003–15. [2] Hardt M, Thomas LR, Dixon SE, Newport G, Agabian N,
Prakobphol A, et al. Toward defining the human parotid gland salivary proteome and peptidome: Identification and
characterization using 2D SDS-PAGE, ultrafiltration, HPLC, and mass spectrometry. Biochemistry 2005;44:2885–99. [3] Hirtz C, Chevalier F, Centeno D, Egea JC, Rossignol M,
Sommerer N, et al. Complexity of the human whole saliva proteome. J Physiol Biochem 2005;61:469–80.
[4] Hu S, Li Y, Wang J, Xie Y, Tjon K, Wolinsky L, et al. Human saliva proteome and transcriptome. J Dent Res
2006;85:1129–33.
[5] Hu S, Xie YM, Ramachandran P, Loo RRO, Li Y, Loo JA, et al. Large-scale identification of proteins in human salivary proteome by liquid chromatography/mass spectrometry and two-dimensional gel electrophoresis-mass spectrometry. Proteomics 2005;5:1714–28.
[6] Denny P, Hagen FK, Hardt M, Liao L, Yan WH, Arellanno M, et al. The proteomes of human parotid and submandibular/sublingual gland salivas collected as the ductal secretions. J Proteome Res 2008;7:1994–2006.
[7] Neyraud E, Sayd T, Morzel M, Dransfield E. Proteomic analysis of human whole and parotid salivas following stimulation by different tastes. J Proteome Res 2006;5:2474–80.
[8] Hardt M, Witkowska HE, Webb S, Thomas LR, Dixon SE, Hall SC, et al. Assessing the effects of diurnal variation on the composition of human parotid saliva: quantitative analysis of native peptides using iTRAQ reagents. Anal Chem
2005;77:4947–54.
[9] Inzitari R, Vento G, Capoluongo E, Boccacci S, Fanali C, Cabras T, et al. Proteomic analysis of salivary acidic proline-rich proteins in human preterm and at-term newborns. J Proteome Res 2007;6:1371–7.
[10] Huang CM. Comparative proteomic analysis of human whole saliva. Arch Oral Biol 2004;49:951–62.
[11] Giusti L, Baldini C, Bazzichi L, Ciregia F, Tonazzini I, Mascia G, et al. Proteome analysis of whole saliva: a new tool for rheumatic diseases— the example of Sjögren's syndrome. Proteomics 2007;7:1634–43.
[12] Oppenheim FG, Salih E, Siqueira WL, Zhang W, Helmershorst EJ. Salivary proteome and its genetic polymorphisms. Annu New York Acad Sci 2007;1098:22–50.
[13] Wong DT. Salivary diagnostics powered by nanotechnologies, proteomics and genomics. J Am Dent Assoc 2006;137:313–21. [14] Morales-Bozo I, Urzua-Orellana B, Dominguez P, Aguilera S,
Lopez-Solis R. Patterns and variability in electrophoretic polypeptide profiles of human saliva in a healthy population. J Physiol Biochem 2006;62:179–88.
[15] Millea KM, Krull IS, Chakraborty AB, Gebler JC, Berger SJ. Comparative profiling of human saliva by intact protein LC/ ESI-TOF mass spectrometry. Biochim Biophys Acta Proteins Proteomics 2007;1774:897–906.
[16] Yan JX, Wait R, Berkelman T, Harry RA, Westbrook JA, Wheeler CH, et al. A modified silver staining protocol for visualization of proteins compatible with matrix-assisted laser desorption/ionization and electrospray ionization-mass spectrometry. Electrophoresis 2000;21:3666–72.
[17] Candiano G, Bruschi M, Musante L, Santucci L, Ghiggeri GM, Carnemolla B, et al. Blue silver: a very sensitive colloidal Coomassie G-250 staining for proteome analysis. Electrophoresis 2004;25:1327–33.
[18] Caraux G, Pinloche S. PermutMatrix: a graphical environment to arrange gene expression profiles in optimal linear order. Bioinformatics 2005;21:1280–1.
[19] Hirtz C, Chevalier F, Centeno D, Rofidal V, Egea JC, Rossignol M, et al. MS characterization of multiple forms of alpha-amylase in human saliva. Proteomics 2005;5:4597–607.
[20] Edwards S, Evans P, Hucklebridge F, Clow A. Association between time of awakening and diurnal cortisol secretory activity. Psychoneuroendocrinol 2001;26:613–22.
[21] Zhou JN, Liu RY, Heerikhuize J, Hofman MA, Swaab DF. Alterations in the circadian rhythm of salivary melatonin begin during middle-age. J Pineal Res 2003;34:11–6.
[22] Randeva HS, Karteris E, Lewandowski KC, Sailesh S, O'Hare P, Hillhouse EW. Circadian rhythmicity of salivary leptin in healthy subjects. Mol Genet Metabol 2003;78:229–35. [23] Jenzano JW, Brown CK, Mauriello SM. Temporal variations of
glandular kallikrein, protein and amylase in mixed human saliva. Arch Oral Biol 1987;32:757–9.
[24] Nater UM, Rohleder N, Schlotz W, Ehlert U, Kirschbaum C. Determinants of the diurnal course of salivary
alpha-amylase. Psychoneuroendocrinol 2007;32:392–401. [25] Hucklebridge F, Clow A, Evans P. The relationship between
salivary secretory immunoglobulin A and cortisol:
neuroendocrine response to awakening and the diurnal cycle. Int J Psychophysiol 1998;31:69–76.
[26] Castagnola M, Cabras T, Denotti G, Fadda MB, Gambarini G, Lupi A, et al. Circadian rhythms of histatin 1, histatin 3, histatin 5, statherin and uric acid in whole human saliva secretion. Biol Rhythm Res 2002;33:213–22.
[27] Gusman H, Leone C, Helmerhorst EJ, Nunn M, Flora B, Troxler RF, et al. Human salivary gland-specific daily variations in histatin concentrations determined by a novel quantitation technique. Arch Oral Biol 2004;49:11–22.
[28] De PK. Sex-hormonal regulation of 20.5 and 24 kDa major male-specific proteins in Syrian hamster submandibular gland. J Steroid Biochem Mol Biol 1996;58:183–7.
[29] Thavathiru E, Jana NR, De PK. Abundant secretory lipocalins displaying male and lactation-specific expression in adult hamster submandibular gland, cDNA cloning and sex hormone-regulated repression. Eur J Biochem 1999;266:467–76.
[30] Lukacs JR, Largaespada LL. Explaining sex differences in dental caries prevalence: saliva, hormones, and“life-history” etiologies. Am J Hum Biol 2006;18:540–55.
[31] Oh J-K, Lee J-Y, Park H-K, Kho H-S.α-galactosidase activity in human saliva. Arch Oral Biol 2008;53:842–8.
[32] Gomez E, Ortiz V, Saintmartin B, Boeck L, Diazsanchez V, Bourges H. Hormonal-regulation of the secretory Iga (Siga) system— estradiol-induced and progesterone-induced changes in Siga in parotid saliva along the menstrual cycle. Am J Reprod Immunol 1993;29:219–23.
[33] Shimizu K, Kimura F, Akimoto T, Akama T, Otsuki T, Nishijima T, et al. Effects of exercise, age and gender on salivary secretory immunoglobulin A in elderly individuals. Exerc Immunol Rev 2007;13:55–66.
[34] Evans P, Der G, Ford G, Hucklebridge F, Hunt K, Lambert S. Social class, sex, and age differences in mucosal immunity in a large community sample. Brain Behav Immun 2000;14:41–8. [35] Rayment SA, Liu B, Offner GD, Oppenheim FG, Troxler RF.
Immunoquantification of human salivary mucins MG1 and MG2 in stimulated whole saliva: factors influencing mucin levels. J Dent Res 2000;79:1765–72.
[36] Kivela J, Laine M, Parkkila S, Rajaniemi H. Salivary carbonic anhydrase VI and its relation to salivary flow rate and buffer capacity in
pregnant and non-pregnant women. Arch Oral Biol 2003;48:547–51.
[37] Shiba H, Venkatesh SG, Gorr SU, Barbieri G, Kurihara H, Kinane DF. Parotid secretory protein
is expressed and inducible in human gingival keratinocytes. J Periodontal Res 2005;40:153–7.
[38] Helmerhorst EJ. Whole saliva proteolysis. Wealth of information for diagnostic exploitation. Annu New York Acad Sci 2007;1098:454–60.
[39] Baron AC, DeCarlo AA, Featherstone JDB. Functional aspects of the human salivary cystatins in the oral environment. Oral Dis 1999;5:234–40.
[40] van't Hof W, Blankenvoorde MFJ, Veerman ECI, Nieuw Amerongen AV. The salivary lipocalin Von Ebner's gland protein is a cysteine proteinase inhibitor. J Biol Chem 1997;272:1837–41.
[41] Dickinson DP. Salivary (SD-type) cystatins: over one billion years in the making-but to what purpose? Crit Rev Oral Biol Med 2002;13:485–508.
[42] Huq NL, Cross KJ, Ung M, Myroforidis H, Veith PD, Chen D, et al. A review of the salivary proteome and peptidome and saliva-derived peptide therapeutics. Int J Pept Res Ther 2007;13:547–64.
[43] Siqueira WL, Zhang W, Helmerhorst EJ, Gygi SP, Oppenheim FG. Identification of protein components in in vivo human acquired enamel pellicle using LC-ESI-MS/MS. J Proteome Res 2007;6:2152–60.
[44] Roche E, Assimacopoulos-Jeannet F, Witters LA, Perruchoud B, Yaney G, Corkey B, et al. Induction by glucose of genes coding for glycolytic enzymes in a pancreatic beta-cell line (INS-1). J Biol Chem 1997;272:3091–8.
[45] Perry GH, Dominy NJ, Claw KG, Lee AS, Fiegler H, Redon R, et al. Diet and the evolution of human amylase gene copy number variation. Nat Genet 2007;39:1256–60.
[46] da Costa G, Lamy E, Silva FCE, Andersen J, Baptista ES, Coelho AV. Salivary amylase induction by tannin-enriched diets as a possible countermeasure against tannins. J Chem Ecol 2008;34:376–87.