Constraints on the Petrogenesis of Lavas from Large Plumes:
Inferences from Geochemical Studies of Lavas from Mauna Kea,
Hawaii and Mt. Bureau, Kerguelen Archipelago
byHuai-Jen Yang
M.S. Geology, Taiwan University (1986)
Submitted to the Department of
Earth, Atmospheric, and Planetary Sciences in Partial Fulfillment of the Requirements
for the Degree of
DOCTOR OF PHILOSOPHY
at the MASSACHUSETTS INSTITUTE OF TECHNOLOGY
May 1996
@ Massachusetts Institute of Technology, 1996. All rights reserved.
Signature of Author:
Department of F6th, A1ospheric and Planetary Sciences May, 1996
Certified
by:----7
Accepted by:
Frederick A. Frey Professor of Geochemistry Thesis Supervisor Thomas H. Jordan Department Head M~s-aT Is UTJUN OFMf@
MIT
A
ES
Constraints on the Petrogenesis of Lavas from Large Plumes: Inferences from Geochemical Studies of Lavas from Mauna Kea, Hawaii and Mt. Bureau,
Kerguelen Archipelago by
Huai-Jen Yang
Submitted to the Department of Earth, Atmospheric, and Planetary Sciences at the Massachusetts Institute of Technology in partial fulfillment of the requirements for
the Degree of Doctor of Philosophy in Geochemistry
ABSTRACT
Lavas derived from large mantle plumes can provide important information about mantle composition and processes. However, the use of lavas to infer mantle composition requires an understanding of the processes which control the chemical variations of lavas, such as partial melting, crystal fractionation and accumulation, magma mixing, magma -wall rock interaction and postmagmatic alteration. In this thesis, I investigate the chemical effects of these processes using experimental constraints and the compositions of lavas and minerals from Mauna Kea volcano at Hawaii and Mt. Bureau in the Kerguelen Archipelago.
A model for calculating major element variations in basaltic magmas during crystal fractionation was developed based on experiments at 0.001-10 kb in simple and natural systems. Based on this algorithm, the high Fe-Ti basalts from the Mauna Kea volcano fractionated olivine, plagioclase and augite at pressures ranging from 0.001 to 10 kb. This method was also used to show that the coherent trends defined by Mt. Bureau group A lavas in MgO variation diagrams were dominated by crystal fractionation at low pressures.
Submarine lavas erupted on the east rift zone of Mauna Kea volcano have high MgO contents (11-20%) which resulted from olivine accumulation in evolved melts. The differences in Sr, Nd, and Pb isotopic ratios and abundance ratios of incompatible elements indicate a diversity in parental magma compositions. The mineral compositions of these lavas provide evidence for isolated magma chambers which had undergone distinct crystal fractionation and magma mixing histories. Similar to these submarine lavas, samples recovered from the Hawaiian Scientific Drilling Project (HSDP) also contain accumulated olivines. The compositions of primary magmas were estimated by adding equilibrium olivine into HSDP samples and subaerially exposed lavas with <8 vol% olivine phenocrysts and >7 wt% of MgO to reach 16 wt% MgO. The abundances of Si0 2 and FeO in these estimated primary magmas reflect the depth of magma segregation. The Si02-Nb correlation indicates that younger lavas were segregated at relatively higher pressures by lower extents of partial melting. This temporal trend reflects migration of Mauna Kea away from the Hawaiian Plume.
Mt. Bureau is an expression of the Kerguelen Plume. Lavas forming the upper part of Mt. Bureau have MgO contents ranging from 5.12 to 3.37% and relatively homogeneous isotopic compositions. Their compositional variations are consistent with crystal fractionation from parental magmas derived from different extents of melting. The chemical and isotopic compositions of lavas forming the lower subsection are interpreted as deriving from mixed sources with different proportions of MORB and plume components. The Mt. Bureau section represents a transition from a near ridge setting to an intraplate setting.
ACKNOWLEDGMENTS
I appreciate to having a section for what I would like to say but do. First, I thank Fred Frey, the #1 advisor in my heart, for guiding me into the field of geochemistry. Trace element geochemistry is the foundation of my thesis. The seminars on Th-U disequilibrium were solid from the basic principles to the geological applications. The MORB seminars extended my knowledge to a regime outside plume volcanism. Discussions during group meetings helped me to keep up with the current hot topics. Being the TA of 12.119 for three times gave me an unique chance to access and have a better understanding on these "state of art" analytical techniques. All these classes have been fun. Critical review ensured the quality of my thesis. In addition to the knowledge of geochemistry, I will carry Fred's attitude of doing science with me as I leave MIT.
I would like to thank Tim Grove for teaching me I-atm isothermal experiments and initiating the OPAM study. Also, three semesters of igneous petrology classes have reinforced my thermodynamics and petrology background. Discussions with Tim and Ro Kinzler on OPAM study gave me the capability of applying phase diagrams to solve geological problems. I appreciate Sam Bowring's effort to guide me to use isotope data in a "right" way. I thank Tim Grove, Sam Bowring and Roberta Rudnick for being my committee members.
I give my special acknowledgments to two young experimental petrologists, Tom Wagner and Glenn Gaetani. They were always there to help me with experiments and answer my questions. Eiichi Takazawa and Alberto Saal have been my office mates for six years. I thank them for sharing all kinds of knowledge and their flexibility on "sample change". I also benefited from discussions with new generation on the 12th floor, Kirsten Nicolaysen and Steve Parman and the WHOI people, Deborah Hassler, Ken Koga and Kwok-Lin Lee.
Dominique Weis is acknowledged for sharing Mt. Bureau isotopic data, as are Mike Garcia and Dave Clague for providing thin sections of Mauna Kea submarine samples.
these great lab managers : Pillalamarri Ila in the neutron activation lab; Mike Jercinovic and Neel Chatterjee in the electron microprobe lab; Jerzy Blusztajn, Dave Kammer, Bill Olszewski and Drew Coleman in clean room and mass spectrometer lab; Pete Dawson in XRF lab; Barry Grant in ICP-MS lab and Bill Olszewski and Dave Applegate in the CLAIR facility.
The three weeks in Hawaii for HSDP have generated another group of friends. I enjoyed the fantastic discussions on the cores with Mike Garcia, Dave Clague, Don DePaolo, Ed Stolper, Mike Baker, John Lassiter and Aaron Pietruzska. I will never forget Wayne Campbell for thousand miles ride and all the fun in Hawaii.
Finally, best regards to my dear wife and daughter who have suffered from the absence of husband and father for many years. Without their support and understanding, I would not be able to concentrate on my research. Moral and financial support from my parents kept me away from all kinds of difficulties. The concerns from the Huang family were also important encouragement. My only regret is that I can't share the pleasure of accomplishment with grandfather.
TABLE OF CONTENTS
T itle p a g e ... 1 A b strac t... .2 Acknowledgments...3 T able of contents...5 Introduction...8Chapter 1: Experiments and Models of Anhydrous, Basaltic
Olivine-Plagioclase-Augite Saturated Melts from 0.001
to 10 kbar...13
A bstract... 14 Introduction... 15 Experiment Starting Material... 16 Experimental Methods...17 Analytical Method...18 Experimental Results...18 Discussion Prediction of ol-plag-aug saturated melts... 19
Melt composition as a thermobarometer...24
Predicting fractional crystallization paths... 25
Comparison of predicted Fractional Crystallization Sequences (FCS)...29
Glasses from EPR: an example of fractionation at 2 kbar... 32
Summary...33
References...35
T ab les...3 8 Figure Caption... 48
F igures... 52
Chapter 2: Submarine Lavas From Mauna Kea Volcano, Hawaii:
Implications for Hawaiian Shield-Stage Processes...
67
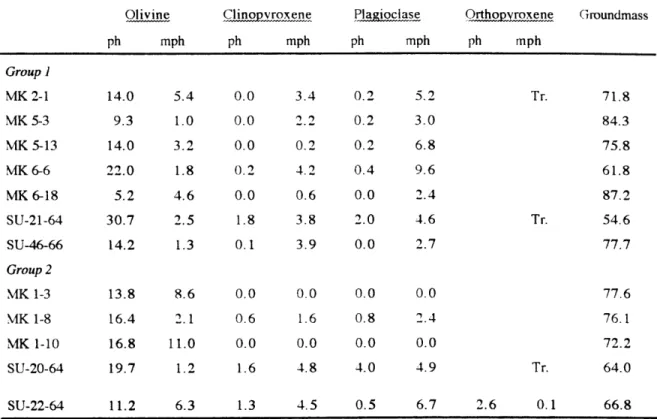
Abstract... 68 Introduction... 69 Sampling...70 P etrography ... 7 1 Analytical...71 Results Mineral Composition... 72
Major Element CompositicN... 73
Trace Element Abundances... 75
Sr, Nd, Pb and He isotopic ratios... 76
Discussion Compositional variations in Group 1 samples: mixing of evolved melt and a magma with abundant olivine xenocrysts...76
Compositional variations in Group 2 samples: magma mixing and evidence for a highly evolved melt component... 78
Diversity of Primary Magmas Represented in the Uppermost Mauna Kea Shield... 79
Geochemical Comparisons With Other Hawaiian Shields... 80
R eferences... 83
T ables... 88
Figure Captions...92
F igu res... 97
Chapter 3: Mineral Chemistry of Submarine Lavas from Mauna Kea, Hawaii: Implications for processes at rift zones...112
A b stract...1 13 Introd uctio n ... 114
S a m p le s...1 15 Analytical Techniques...116
Petrography and mineral compositions...116
Discussion Magma mixing in isolated magma chambers...123
The compositions of the evolved magmas...125
The origin of olivine-cognate or exotic...126
Implications from olivine rim compositions...128
Evidence of high pressure fractionation...129
Comparison with Mauna Kea lavas recovered from. Hawaiian Scientific Drilling Project (HSDP)...130
C o nclu sion s... ... 13 1 R eferences...132
T a b les...13 5 F igure C aptions...150
F ig u res...153
Chapter 4: Evolution of Mauna Kea volcano: Inferences from lava
compositions recovered in the Hawaii Scientific Drilling Project...169A b stract... ... 170
Introd uctio n ... ... 17 1 Previous Studies of Mauna Kea Volcano...172
Results Major Elements... ... 174
Incompatible Trace Elements...177
Discussion Compositional effects of posteruptive alteration processes...180
Comparison of Tholeiitic to Alkalic Transition in HSDP Core and Subaerial Exposed Sections...181
Petrogenetic Inferences Resulting From Systematic Changes in Magma Composition as a Function of Depth in the HSDP Core...183
Implications For How the Hawaiian Plume "Works"...192
C o nclu sion s...193
R eferences...194
T ables...20 0 Figure Captions... 202
F ig u res...2 0 6
Chapter
5:
The geochemistry of Mt. Bureau basalts: implications for the
plume composition and plume-M ORB interaction...221
S am p les...2 2 5 Petrographic Description...225 Analytical Methods...225 R esu lts...2 2 6 39Ar/40Ar dating...226 Major elements ... 227 Trace elements ... 228
The effects of zeolitilisation on chemical compositions...229
Sr, Nd, and Pb isotopes...230
Grouping of samples...232
Discussion...233
General geochemical variations in group A samples... ... 233
The role of crystal fractionation...233
Parental magmas for group A lavas...236
The scatter in the general MgO-SiO2 correlation defined by group A samples: Evidence for control by partial melting...238
Compositional variations with stratigraphic height in the upper subsection ... 239
The Sr, Nd, and Pb isotopic compositions of group A lavas: implications for plume isotopic compositions... ... 241
The origin of the isotopic diversity of the Mt. Bureau lavas...242
Kerguelen Plume -SEIR MORB interaction ... 242
Source mixing or melt mixing ... 245
Kerguelen Plume-Kerguelen Plateau interaction...249
Isotopic variations in the Mt. Bureau section: implications for plume-MORB interaction...250
Comparisons of 8 7Sr/86Sr ratios in volcanic and plutonic rocks: constraints on the time scale of heterogeneity...252
C onclusions...253
R eferences...255
T ables...2 6 0 Figure Captions...272 F igu res...2 78
INTRODUCTION
Long-lived ocean islands are formed by partial melting of thermal plumes rising from boundary layers. Thermal plumes rise because of thermal instability which develops when the Rayleigh number Rab ( Ra6 - agA To(t)3 ; where a is the thermal expansivity, g is gravity,
WCV
AT is temperature difference between the top and bottom of the layer, 8(t) is the thickness of the layer which increases with time and is defined as 6(t) = (@Et)1/2, K is thermal diffusivity and v
is viscosity) of a thermal boundary layer reaches a critical value, for example 3000 (the Rayleigh number for mantle convection ranging from 5.105-5.107) suggested by Howard (1964). The core-mantle boundary is a thermal boundary layer where plumes may develop. Plumes originating from core-mantle boundary were proposed in whole mantle convection models (Loper, 1985; Bercovici et al., 1989; Olson et al., 1989). Another possible region where plumes may form is the transition zone, where a significant temperature difference exists between upper and lower mantle (Jeanloz and Morris, 1986). Plumes initiation from the transition zone are suggested in layered mantle convection models (Richter and McKenzie,
1981; Kenyon and Turotte, 1983; O'Nions, 1987).
To the first order thermal plumes are fixed with respect to each other and the locations of these thermal plumes are referred as hot spots (Wilson, 1963). As a thermal plume ascends, adiabatic decompression (a temperature gradient of 10-20C/kb) causes it to melt when its
temperature becomes higher than the solidus temperature (a temperature gradient of -130C/kb)
generating basaltic magmas. Hot spot volcanism may initiate with a high magma production rate forming continental flood basalts, such as the Deccan Traps and Columbia River basalt province, and submarine oceanic plateaus, such as the Kerguelen Plateau, (Richard et al., 1989; White and McKenzie, 1989). As the magma production rate decreases, smaller seamounts and oceanic islands form (Richard et al., 1989). Because hot spots are relatively stationary, hot spot volcanism ceases when a volcano is carried away from the hot spot by the motion of the
lithospheric plate. This results in a chain of volcanoes with a progressive increase in ages as volcanoes move away from the hot spot; for example, the Emperor-Hawaiian chain in the Pacific Ocean and the Ninetyeast Ridge in the Indian Ocean (Wilson, 1963). These linear
structures on the ocean floor indicate the direction of plate motion (Morgan, 1972).
Although the depth where plumes originate is an issue of debate, it is generally accepted that thermal plumes rise from deep mantle. Studies on ocean island basalts (OIB) show that the plume sources are distinct from the sources of mid-ocean ridge basalts (MORB) which are depleted in incompatible trace elements by previous partial melting events. Isotopic compositions indicate that OIB are derived from mixed sources with several possible components including primitive mantle, the depleted MORB source, recycled oceanic crust and sediments (Hofmann and White, 1982; Zindler and Hart, 1986; Weaver, 1991). To infer the chemical compositions of plume sources from basalts is difficult because of the complexities introduced during partial melting, and postmelting processes, such as crystal fractionation, magma mixing, wall rock interaction, and post-eruptive alteration.
In this thesis, I investigate the geochemical effects of these processes by studying lavas forming Mauna Kea volcano at Hawaii and Mt. Bureau in the Kerguelen Archipelago. Chapter one focuses on crystal fractionation. Empirical equations derived from 190 experiments were used to describe the compositions of olivine-plagioclase-augite saturated melts. Based on these equations, a method was developed to calculate the chemical variations during fractionation at 0.001-10 kb. This algorithm was used in chapter four to estimate the pressures at which high Fe-Ti basalts from Mauna Kea volcano formed and in chapter five to calculate the liquid line of descent of Mt. Bureau lavas. In chapter two, the compositional variations of submarine lavas dredged from the east rift of the Mauna Kea volcano were attributed to olivine accumulation. The variations in isotopic ratios and abundance ratios of trace elements indicate that these submarine lavas were not derived from a common source. The detailed mineral compositions of these submarine lavas were presented in chapter three. They provide evidence for magma
mixing and extensive fractionation in isolated magma chambers in the rift zone distant from the summit of the volcano. Chapter four is a study of drill core samples recovered by the Hawaiian Scientific Drilling Project (HSDP). The compositions of primary magmas were estimated by adding equilibrium olivine to the compositions of nearly aphric lavas. The compositional variations in these estimated primary magmas reflect the extents of partial melting and the depths of magma segregation. From the variations in the abundances of incompatible elements in the estimated primary magmas, such as Nb, and abundance ratios, such as La/Yb, the variations in the extents of melting can be inferred. These HSDP samples were compared to the older submarine lavas and younger subaerially exposed lavas (Frey et al., 1990; Frey et al., 1991) to understand the evolution of Mauna Kea volcano. Chapter five is a study of Mt. Bureau lavas which are the surface expression of the Kerguelen Plume. The Mt. Bureau lava section is divided into two subsections based on their geochemical characteristics. There are no systematic variations in isotopic and chemical compositions with stratigraphic height, but lavas from the upper subsection are relatively homogeneous in chemical and isotopic compositions. They evolved from diverse parental magmas and reflect the geochemical characteristics the Kerguelen Plume. Lavas from the lower subsection were derived from mixed sources with different proportions of plume and MORB source components. The tectonic setting may have been an important factor in controlling the mixing process.
REFERENCES
Bercovici D., Schubert G., and Glatsmaier G. A. (1989) Three-dimensional, large-scale convection in the Earth's mantle. Science 244, 950-955.
Frey F. A., Garcia M. 0., Wise W. S., Kennedy A., Gurriet P., and Albarede F. (1991) The evolution of Mauna Kea Volcano, Hawaii: Petrogenesis of tholeiitic and alkalic basalts. J.
Geophys. Res. 96, 14,347-14,375.
Evolution of Mauna Kea Volcano, Hawaii: Petrologic and geochemical constraints on postshield volcanism. J. Geophys. Res. 95, 1271-1300.
Hofmann A. W. and White W. M. (1982) Mantle plumes from ancient oceanic crust. Earth
Planet. Sci. Lett. 57, 421-436.
Howard L. N. (1964) Convection at high Rayleigh number. Proceedings of the 11th
International Congress on Applied Mechanics, Munich., 1109-1115.
Jeanloz R. and Morris S. (1986) Temperature distribution in the crust and mantle. Ann. Rev.
Earth Planet. Sci. 14, 377-415.
Kenyon P. M. and Turotte D. L. (1983) Convection in a two-layer mantle with a strongly temperature-dependent viscosity. J. Geophys. Res. 88, 6403-6414.
Loper D. E. (1985) A simple model of whole mantle convection. J. Geophys. Res. 90, 1809-1836.
Morgan W. J. (1972) Plate motions and deep mantle convection. Geol. Soc. Am. Mem., 7-22. O'Nions R. K. (1987) Relationships between chemical and convective layering in the Earth. J.
Geol. Soc. Lond. 144, 259-274.
Olson P., Silver P. G., and Carlson R. W. (1989) The large-scale structure of convection in the Earth's mantle. Nature 344, 209-215.
Richard M. A., Duncan R. A., and Courtillot V. E. (1989) Flood basalts and hot spot tracks: plume heads and tails. Science.
Richter F. M. and McKenzie D. P. (1981) On some consequences and possible causes of layered mantle convection. J. Geophys. Res. 86, 6124-6133.
Weaver B. L. (1991) The origin of ocean island basalt end-member compositions: trace element and isotopic constraints. Earth Planet. Sci. Lett. 104, 381-397.
White R. and McKenzie D. P. (1989) Magmatism at rift zones: the generation of volcanic continental margins and flood basalts. J. Geophys. Res. 94, 7685-7730.
Zindler A. and Hart S. R. (1986) Chemical Geodynamics. Ann. Rev. Earth Planet. Sci. 14,
CHAPTER ONE
Experiments and models of anhydrous, basaltic
olivine-plagioclase-augite saturated melts from 0.001
to 10 kbar
ABSTRACT
A new method for modeling fractional crystallization processes that involve olivine (ol), plagioclase (plag) and augite (aug) is presented. This crystallization assemblage is the major control on the chemical variations in mid-ocean ridge basalts. The compositional and temperature variations in ol-plag-aug saturated basalts over a range of pressures are described using empirical expressions. A data base of 190 experiments in natural and basalt-analog chemical systems is used to describe temperature, Al, Ca and Mg molar fractions as functions of Si, Fe, Na, Ti and K molar fractions and pressure. The effects of minor components, such as Na, Ti and K, on major elements are evaluated using two methods: (1) investigating the differences between observed natural compositions and those predicted from equations developed from experiments in simple systems and (2) using equations developed in this paper to predict compositions of ol-plag-aug saturated melts. Increases in the abundances of Na and K cause Ca and Mg abundances to decrease and Al abundance to increase in ol-plag-aug saturated melts. The effects of variations of Ti are to increase Mg but decrease Al and Ca. The equations presented here can be used to evaluate the pressure and temperature at which a given melt can be saturated with ol-plag-aug, and thus provide a useful thermobarometer. A model is described to calculate ol-plag-aug fractional crystallization as a function of pressure and melt composition, using melt and augite models developed here, combined with existing models for olivine-melt and plagioclase-melt equilibria. I compare the fractional crystallization sequence of ALV-2004-3-1 predicted from the models presented in this paper, Langmuir et al. (1992) modified by Reynolds (1995), Ariskin et al. (1993), and Ghiorso and Sack (1995) at 0.001 and 4 kbar. As an example, I show that the glasses from the east flank of the East Pacific Rise at 1 145'N may have been derived by crystallization processes at 2 kbar.
INTRODUCTION
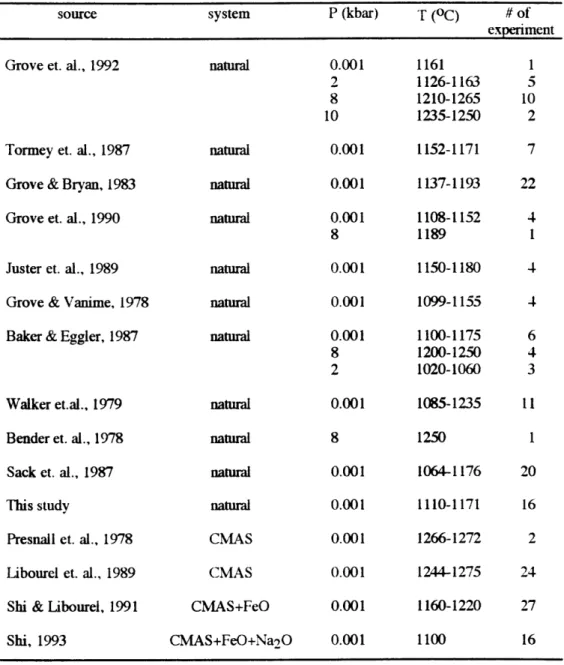
Phase diagrams have been used extensively in the investigation of the generation and evolution of basalts. Phase diagrams in the simple systems, such as CaO-MgO-Al203-SiO2 (CMAS) and CMAS+Na20, are powerful because the limited variance of equilibria in these systems allows the phase boundaries to be depicted in one, two and three dimensions, and thus easily visualized. For example, Walter and Presnall (1994) determined the position of the boundary of olivine-orthopyroxene-clinopyroxene-an Al phase-melt in P-T-composition space by parameterizing the divariant equilibrium melting in the CMAS+Na2O system from 7 to 35 kbar in terms of pressure and Na2O abundance in the melt. Shi developed equations to describe the olivine (ol)-plagioclase (plag)-augite (aug)-melt (OPAM) boundary from experiments in the CMAS+FeO (Shi, 1992) and CMAS+FeO+Na2O (Shi, 1993) system at 0.001 kbar. Phase diagrams relevant for natural system crystallization and melting processes have traditionally been less tractable due to the higher variance of equilibria in the natural system. The accumulation of relevant experimental data, however, has made possible the development of methods for predicting multi-variant phase boundaries (degree of freedom greater than three). Kinzler and Grove (1992), for example, compiled -70 experimental data to develop equations to describe the phase boundaries defined by melts coexisting with ol, aug, low-Ca pyroxene and an Al phase in both the plagioclase and spinel stability fields.
In this study, the results of anhydrous experiments carried out at 0.001 kbar on a variety of basaltic compositions are presented. In order to explore the effects of minor components (Na, Ti, and K) on the OPAM boundary, these data and experiments in the natural system from the literature are predicted using equations derived from experiments in the CMAS+FeO (Shi, 1992) and CMAS+FeO+Na2O systems (Shi, 1993). Differences between observed and predicted compositions are interpreted to be caused by the presence of minor components such as Na20, K20 and TiO2in the natural system. I then develop empirical equations describing the
OPAM boundary in P-T-composition space, based on 190 experiments in the natural and simple systems over the pressure range of 0.001~10 kbar, which include new data as well as data from the literature. These equations resolve the individual effects of Na, K and Ti on Ca, Al and Mg in ol-plag-aug saturated melts. I also demonstrate how to use these equations as a thermobarometer to estimate the pressure and temperature at which a given melt can be saturated with ol, plag, and aug.
Empirical equations for predicting augite compositions as functions of pressure and their coexisting melt compositions are also presented. These empirical equations for describing melt and augite compositions are combined with the existing expressions for ol-melt and plag-melt equilibria to construct a model for calculating fractional crystallization paths for a range of basaltic compositions. The new model for predicting the OPAM boundary represents an improvement over the method described by Grove et al. (1992), because composition and pressure effects on both ol-plag-aug saturated melt and augite compositions are taken into account in the model presented here. The OPAM boundary is especially relevant for mid-ocean ridge basalts (MORB) as the dominant geochemical variations present in MORB have been attributed to ol-plag-aug fractionation (Walker et al., 1979; Stolper, 1980). A fractional crystallization path calculated from the model presented in this chapter is compared with those calculated from the programs of Langmuir et al. (1992) modified by Reynolds (1995), Ariskin et al. (1993), and Ghiorso and Sack (1995). Finally, the fractionation history of a suite of glasses from the east flank of East Pacific Rise (EPR) at 11045'N is discussed by comparing the compositional trend defined by these glasses with 0.001 kbar experimental results and the fractionation path calculated at 2 kbar using the method presented here.
EXPERIMENTS Starting Material
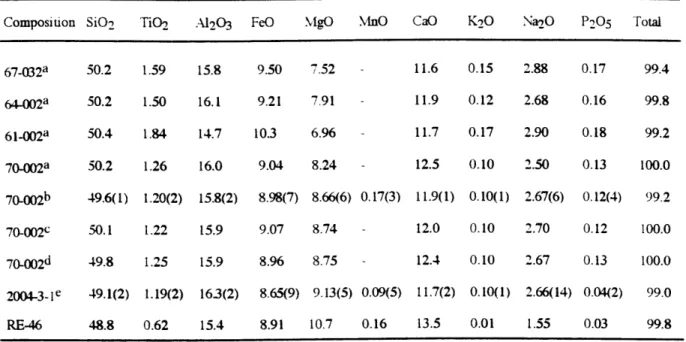
starting material. All six lavas used in the experiments consist of fresh glassy to aphyric pillow fragments. Four of the lavas, PROTEA-9-70-002, 67-032, 64-002 and 61-002, were dredged from 10-120N on the EPR in 1984 (Thompson et al., 1985; 1989). The fifth, ALV-2004-3-1, was sampled by ALVIN dive 2004 at 11045'N on the EPR. The sixth, RE-46, which has the highest MgO abundance coupled with an unusually low Na2O abundance, is an Icelandic basalt. Table 1 provides chemical analyses of the starting material. PROTEA-9-70-002 was analyzed by electron microprobes at both Smithsonian and Massachusetts Institute of Technology (MIT).
Experimental Methods
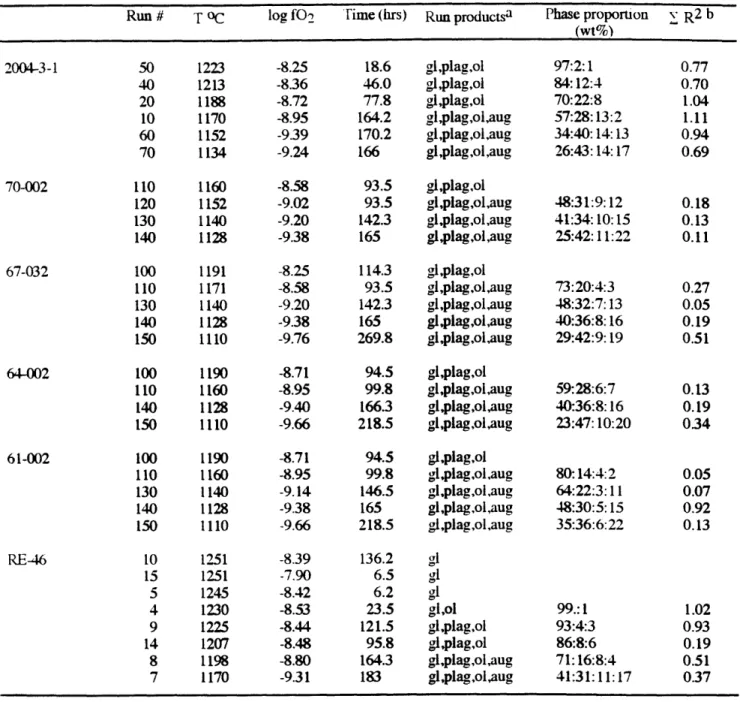
Anhydrous isothermal experiments were carried out at 0.001 kbar. The freshest parts of the basalt pillows were reduced to powder by grinding in a SPEX shatter box for 3 minutes. 0.08~0.1 g of powdered sample were pressed into a pellet using elvanol as a binder. The pellet was sintered on a 0.008" diameter Fe-Pt alloy wire loop using a natural gas/oxygen torch. The loop and sample were suspended in the hot spot of a Deltech DT31VT quenching furnace. Temperature was monitored by a Pt-Pt90Rhi0 thermocouple which was calibrated against the melting points of NaCl, Au and Pt on the IPTS 1968 temperature scale (Biggar, 1972). Oxygen fugacity was controlled near the quartz-fayalite-magnetite (QFM) oxygen buffer using a C02-H2 gas mixture, and monitored by ZrO2-CaO electrolyte cells. Experiments were
terminated by quenching in water. Experimental run conditions are reported in Table 2.
Volatilization of sodium from the experimental charge and mass transfer of iron between the experimental charge and container (wire loop) can be significant problems in 0.001 kbar experiments. In order to minimize the iron exchange between the silicate charge and Pt wire loop, the loops used to hold the experimental charge were fabricated to contain about 8 wt % iron. This Fe-Pt alloy is in equilibrium with tholeiite at QFM over the temperature interval of
1400 to 1100 OC (Grove, 1981). Sodium volatilization is related to sample size, gas flow rate, oxygen fugacity, experimental duration, and experimental temperature (Tormey et, al., 1987).
Larger sample size (100 mg), and low gas flow rate (0.1 mL/s) were used to reduce sodium volatilization.
Analytical Method
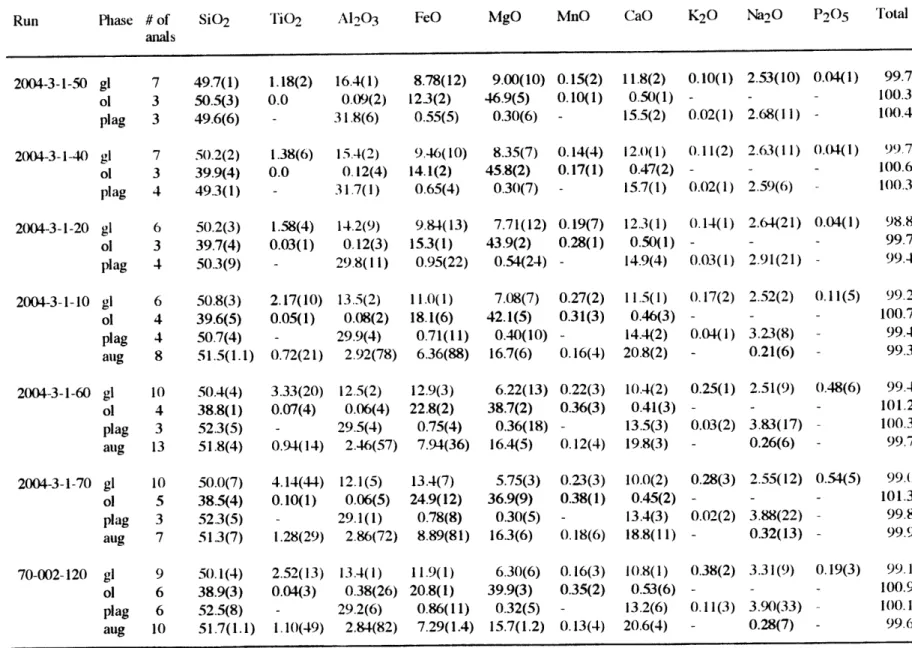
Phase compositions were analyzed with MIT 4-spectrometer JEOL 733 superprobe, using 15 Kev accelerating voltage and 10 nA beam current. Beam size is 10 um for glass analyses and 1 um for crystalline phases. Counting time were 20-40 seconds depending on elements. The data were reduced using Bence and Albee (1968) matrix correction with modification of Albee and Ray (1970). Olivine and glass are homogeneous while plagioclase and augite tend to be compositionally zoned. Only the rim compositions were analyzed for plagioclase and augite.
EXPERIMENTAL RESULTS
All the phase compositions in the experimental products are listed in Table 3. The Fe-Mg exchange distribution coefficients [KD=(XFex"- XMgiq)/(XMgxI. XFesiq)] are 0.28±0.01 for olivine-liquid and 0.24*0.02 for augite-liquid. The plagioclase-liquid Ca-Na exchange distribution coefficients [KD=(XCaxt - XNa1lq)/(XNaxtI. XCafiq)] range from 0.75 to 1.30, most are within 1.15±0.15. The consistent KD values do not prove equilibrium, but are good indicators of close attainment of exchange equilibrium. Mass balance between the bulk composition of starting material and experimental products was used to evaluate whether iron or sodium had been lost from the silicate charge. Na2O loss was typically 1-5 % relative. Iron loss was typically less than 1-3 %. The crystallization sequence for sample RE-46 is olivine followed by plagioclase then augite in at 1198 OC (Fig. 1). Sample ALV-2004-3-1 has olivine-plagioclase near its liquidus followed by augite in at 1170 oC. Augite begins to crystallize in addition to olivine and plagioclase over the temperature interval of 1170-1150 OC in the other four starting compositions. Due to its higher CaO/Al203 ratio, RE-46 has a higher ol-plag-aug
saturation temperature than the other compositions (Fig. 1).
DISCUSSION
Prediction of ol-plag-aug saturated melts
Effects of Na20 Since 85~90% of the chemical constituents in basalts and upper mantle are contained in the CMAS system, it constitutes a good analog system for studying partial melting and crystal fractionation (Presnall et al., 1978; Libourel et al., 1989). In the natural system behavior is more complex because at least four more components: FeO, Na2O, TiO2 and K20, are required to describe the compositional variations. Shi and Libourel (1991) carried out experiments in the CMAS+FeO system at 0.001 kbar to investigate the effects of FeO on the CMAS system. Shi (1992) developed empirical equations to describe the compositions of ol-plag-aug saturated melts in the CMAS+FeO system at 0.001 kbar (variance=2). He used temperature and Si molar fraction in melt (Xsi; in later discussion X denotes molar fraction) as two independent variables to describe the molar fractions of Al, Ca, Fe and Mg (XAi, XCa, XFe and XMg) in melts saturated with ol-plag-aug. In order to evaluate the effects of Na20, TiO2 and K20 on ol-plag-aug saturated melts, I used the equations of Shi (1992) to predict the experiments in the CMAS+FeO+Na2O and natural systems. The data set used for evaluation is listed in Table 4. The comparisons between observed compositions and compositions predicted from the equations of Shi (1992) are shown in Fig. 2. Predicted compositions have higher XFe and XCa, and lower XA1 than observed compositions. Predictions XMg for are good for high-Mg melts but more scattered for low-high-Mg melts which contain greater abundances of Na20, TiO2 and K20.
The differences between observed compositions and those predicted from the equations of Shi (1992) are attributed to the effects of the minor components present in the natural but not in CMAS+FeO system. Because Na is the most abundant of the minor components in the data set [1.32~8.43 wt % corresponding to 2-7 mole %, excluding the experiments on lunar
samples (Grove and Vaniman, 1978)], I plot Na20 wt % versus the differences between predicted and observed compositions (i.e. AA = predicted XAI - observed XAi). Na2O correlates with AAl, ACa and AFe (Fig. 3). Differences increase as Na20 abundance in the melt increases. Based on Fig. 3, the addition of Na2O increases Al and decreases Ca and Fe relative to the Na2O-free system. The behaviors are consistent with the experimental results of Biggar and Humphries (1981). They showed that an increase in the abundance of Na2O moves ol-plag-aug saturated melt compositions towards the plagioclase apex of the forsterite-diopside-plagioclase pseudoternary in the forsterite-diopside-anorthite-albite system. Shifting ol-plag-aug saturated melt compositions towards the plagioclase apex causes increases in the Al and Si abundances and decreases in the Fe, Ca and Mg abundances in the melt. However, this plagioclase effect is difficult to reconcile with the lack of Na2O-AMg correlation for the experiments of Shi (1993) for which Na20 is the only additional component. The Shi (1993) experiments were carried out at a constant temperature, 1100 OC, and thus temperature may be exercising an important control on the Na20-AMg systematics. Another striking feature of the AMg-Na20 variation is that experiments on alkalic compositions (open triangles) and tholeiitic compositions (stars and open diamonds) do not show the systematic variation as defined by Na20 versus AAl, ACa and AFe. For example, the differences between predicted and observed Al, Ca and Fe increase as Na20 abundance increases from tholeiitic to alkalic compositions. In contrast, there is no systematic Na20-AMg variation from tholeiitic to alkalic compositions. This reflects the effects of other minor components and will be discussed in next sections.
Combined effects of TiO2 and K20 on ol-plag-aug saturated melts The combined effects of
other minor components on ol-plag-aug saturated melts can be evaluated by comparing ACa, AFe, AMg and AA between the natural and CMAS+FeO+Na2O systems again using the equations of Shi (1992). In Fig. 3 at a given Na2O content, experiments on natural compositions (symbols other than open circle) have larger magnitudes of ACa, AFe and AAI than melts of the CMAS+FeO+Na2O compositions (open circles). These differences can be
inferred to reflect the combined effects of other minor components. As Ti20 and K20 are the next most abundant components after Na20, the discrepancies of ACa, AFe and AAl between the natural and CMAS+FeO+Na2O systems are attributed to the combined effects of these two elements. As Fig. 3 shows, the combined effects of Ti20 and K20 on Ca, Fe and Al abundances in ol-plag-aug saturated melts are similar to those of Na20, since the addition of TiO2 and K20 increases the magnitudes of ACa, AFe and AAl. This analysis does not, however, allow us to distinguish between the individual effects of Ti2O and K20.
The equations of Shi (1992) tend to overestimate and underestimate XMg for nepheline (open triangles in Fig. 3) and hyperthene normative compositions (stars and open diamonds in Fig 3), respectively. In the experiments of Sack (1987), Na20 and K20 are the most abundant components in addition to CMAS components (Na: 5.1-12.6 mole %; K: 1.4-6.6 mole % , Ti: 1.1~3.3 mole % compare to Na: 2~7 mole %, K: 0.01~1.4 mole %, Ti: 0.4-4.2 mole % in tholeiitic compositions). High alkali abundances drive melt compositions towards the plagioclase apex and hence decrease XMg in the melts. This explains the overestimate of XMg for the experiments of Sack (1987) by the equation of Shi (1992). For tholeiitic compositions TiO2 is the next abundant component after CMAS+FeO+Na2O. The negative correlation between TiO2 and AMg exhibited by experiments on tholeiitic compositions indicates that the addition of TiO2 to CMAS+FeO increases XMg (decreases AMg) in the melts (Fig. 4). This effect is opposite to the effects of Na20 and K20 discussed above. The effect of TiO2 on XMg apparently overwhelms that of Na2O in tholeiitic compositions because the equation of Shi (1992) underestimates (AMg <0, Fig. 4) rather than overestimating XMg in the experiments for tholeiitic compositions. The relatively good TiO2-AMg correlation compared to the lack of Na20-AMg correlation for tholeiitic compositions (Figs. 4 and 3) also indicates that AMg in tholeiitic compositions is dominated by TiO2 even though XTi is less than XNa.
Shi (1993) also developed empirical equations for describing compositions of ol-plag-aug saturated melts and coexisting phases in the CMAS+FeO+Na2O system at 1100 *C
(variance=2). Therefore, the combined effects of TiO2 and K20 on melt composition can be evaluated by comparing the observations and predictions obtained using the equations of Shi (1993) for experiments on natural samples. However, large differences exist between observed compositions and those predicted with the equations of Shi (1993) (Fig. 5). The good correlations between temperature and ACa, AFe, AMg and AAl confirm that the differences are likely to be dominated by temperature (Fig. 6). At 1100 *C, temperature has no effect on the differences and thus the differences (indicated by the arrows in Fig. 6) should reflect the combined effects of TiO2 and K20. Because the equations of Shi (1993) underestimate Al and overestimate Ca and Fe at 1100 oC, the combined effects of TiO2 and K20 are to increase Al and decrease Ca and Fe contents in melts (Fig. 6). This agrees with the inference from the Shi (1992) equations (Fig. 3). The equation of Shi (1993) underestimates and overestimates XMg in tholeiitic and alkalic melts, respectively, at 1 1000C. Because TiO2 and K20 are the next abundant components after CMAS+Na20 in tholeiitic and alkalic compositions respectively, it is inferred that the effect of TiO2 is to increase XMg and that of K20 is to decrease XMg in ol-plag-aug saturated melts.
Estimating the compositions of ol-plag-aug saturated melts As discussed above, variations in the abundances of minor components such as Na20, TiO2 and K20 have systematic effects on the compositions of natural system melts saturated with ol-plag-aug, relative to melts saturated with this same mineral assemblage in the simple systems. I developed equations based on experiments in both the natural and simple systems to describe the compositions of ol-plag-aug saturated melts. Data from high pressure experiments (Grove et al., 1992; Grove et al., 1990; Baker and Eggler, 1987; Bender et al., 1978) were also included in the data set to parameterize equations for ol-plag-aug saturated melt compositions as functions of pressure, and bulk composition by multiple regression. This data set (Table 4) covers nepheline- and hyperthene-normative compositions and its compositional ranges are as following, Mg#: 0.15-1, Na20-0-8.43 wt %, Si02: 38.59-63.41wt %, TiO2: 0-5.63 wt %, K20: 0-5.45 wt % and pressure
ranges from 0.001 to 10 kbar. Eight components: SiO2, TiO2, A1203, FeO, MgO, CaO, Na20
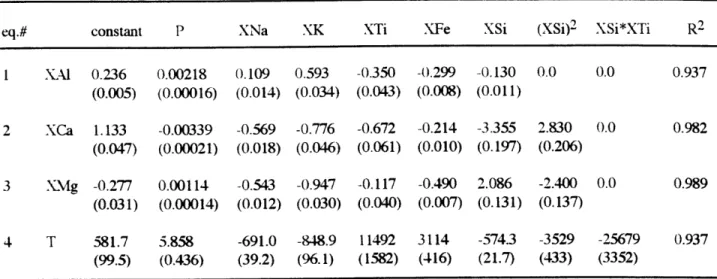
and K20; are required and sufficient to describe the basaltic compositions. The variance of a 4-phase equilibrium in an 8-component system is 6 (F=C+2-P=8+2-4=6; F is the variance, C is the number of components and P is the number of phases). To evaluate the effects of pressure and minor components on major components, pressure, XNa, XK and XTi are chosen as independent variables. Two more independent variables are required. Least squares multiple linear regression analysis was used to obtain equations that combined Xsi and XFe with XNa, XK, XTi and pressure to predict XA1, XCa, XMg and temperature. Based on 190 experiments, the coefficients for the independent variables listed in Table 5 provide the best fits describing XA1 (eq. 1), XCa (eq. 2), XMg (eq. 3) and temperature (eq. 4). Pressure is in kbar and temperature is in OC. The values in parentheses are the standard errors of the coefficients. The ratio of a coefficient and its standard error (t-value) gives the degree of significance of its corresponding variable. The higher the absolute t-value is, the more significant the variable. For example, the absolute t-value of XK in eq. 1 (Table 5) is 17.3 and removing the XK term from eq. 1 decreases the square of the correlation coefficient (R2) from 0.937 to 0.835. In the equations most of the variables have absolute t-value greater than 10. The predicted temperatures are within ±20 OC for 170 experiments. Fifteen are greater than ±20 oC but less than ±30 oC. Five are greater than ±30 OC (Fig. 7).
As equations 1-3 (Table 5) are first degree polynomials for P, XNa, XK and XTi, the individual effects of these independent variables on dependent variables can be predicted from the sign of the coefficient of that independent variable. For example, if XK, XTi, XSi, XFe and P are fixed, increasing XNa will decrease XCa and XMg but increase XAI. Following this approach, it is inferred that the effects of XK on XCa, XMg and XA1 are the same as that of XNa and the effects of XTi are to decrease XA1 and XCa. The effect of XTi on XMg cannot be predicted from eq. 3, because the absolute t-value of XTi is 2.925 which means XTi is insignificant. Removing XTi from eq. 3 only slightly decreases R2 (from 0.989 to 0.987). In
order to better evaluate the effect of XTi on XMg, I tested combinations of other independent variables that give more significant t-value (-5.8) for XTi to predict XMg (Table. 6). Although these equations give slightly low R2, they all predict that increasing XTi will increase XMg if other independent variables are fixed. Therefore, the effect of XTi on XMg is opposite to that of XNa and XK. This result is consistent with the inferences drawn from the discussion above using the equations of Shi (1992, 1993). The overall effects of increasing the abundance of XTi are to increase XMg but decrease XA1 and XCa. These effects tend to move melt compositions away from the plagioclase apex. In summary, the effects of XNa and XK counterbalance the effect of XTi on XMg. This may explain the success of the simple system equation (Shi, 1992) in predicting XMg (Fig. 2) for natural system data even though they did not consider the effects of XNa, XK and XTi.
Melt composition as a thermobarometer The equations presented in Table 5 can be used to estimate the temperature and pressure at which a basaltic melt may have coexisted with olivine, plagioclase and augite from the melt composition. VG-360, a sample inferred to have been on the ol-plag-aug cotectic at 4 kbar (Gataeni et al., 1995), is taken as an example. The XCa, XAI and XMg predicted from equations 1-3 at various pressures were combined with other observed components and recalculated into normative oxygen unit components (Grove et al., 1993). A series of "predicted" compositions were projected from plagioclase onto the ol-cpx-qtz plane. Comparison between observed composition and the predicted melts indicates that the best fit is at 4 kbar (Fig. 8). Projections from ol, cpx and qtz also give best fit at 4 kbar implying that VG-360 may have been ol-plag-aug saturated at 4 kbar. Thus, the method described here gives a similar result to that obtained by Gataeni et al. (1995). The predicted pressure and compositional variables were then used in equation 4 to predict temperature. The predicted temperature for VG-360 is 1184 0C, while prediction from olivine composition gives 1161 0C (Gaetani et al., 1995). Another example shown in Fig. 8 is RE-46, a starting
in this study which show that RE-46 is not ol-plag-aug saturated at 0.001 kbar (Fig. 8). The third example is the composition of the glassy matrix of SU-46-66, a dredged tholeiite from the east rift of Mauna Kea, Hawaii. Predicted and observed normative oxygen unit components match very well at 0.001 kbar (Fig. 8). SU-46-66 contains phenocrysts of olivine, plagioclase and augite.
Predicting fractional crystallization paths The equations presented in Table 5 also can be used to track the position of the OPAM boundary in pressure, temperature and composition space as fractional crystallization of a basaltic magma proceeds and therefore provide the basis for a model of fractional crystallization. The OPAM boundary has been previously modeled by Grove et al. (1992). They first predicted the ol-plag-aug-low Ca pyroxene-melt (OPALM) point with the equations of Kinzler and Grove (1992), and then extended a straight line from the predicted OPALM point towards the Ol-Cpx sideline in the olivine-clinopyroxene-quartz (Ol-Cpx-Qtz) pseudoternary with a slope parallel to the experimentally determined OPAM boundary of ALV-1690-20 at 0.001 kbar. This was a simplification of more complex relations that are sensitive to both composition and pressure. In this paper the OPAM boundary is modeled as a function of both bulk composition and pressure. Mineral-melt equilibrium expressions for ol, plag and aug are required in order to calculate fractionation paths for melts that will saturate with some combinations of these mineral phases. As both pressure and system composition may change as fractionation proceeds, these mineral-melt equilibrium expressions need to incorporate the controls of both pressure and system composition on the compositions of ol, plag and aug that crystallize from basaltic melts.
Based on experimental results, the geometric relation between the OPALM, OPAM and ol-plag (OPM) boundaries was simplified by Grove et al. (1992) in the following way. For a
given pressure and bulk composition, the OPAM boundary projects as a line terminated by the OPALM point in the Ol-Cpx-Qtz pseudoternary (Fig. 9a). In the olivine-plagioclase-clinopyroxene (Ol-Plag-Cpx) pseudotemary, the OPAM line collapses as a point overlapping
with the OPALM point forming the end point of the OPM boundary (Fig. 9b). The OPM boundary projects as a line perpendicular to Ol-Plag sideline (Fig. 9b). I will adopt these geometric relations to predict fractionation paths. The Ol-Cpx-Qtz pseudoternary is chosen to demonstrate the OPAM boundary since the OPAM boundary appears as a prominent feature in this projection. In the following section I provide a method for predicting ol-plag-aug fractionation paths as functions of pressure and system composition.
Olivine Fractionation For MORB the most common fractionation sequence at low pressure is olivine followed by olivine-plagioclase then olivine-plagioclase-augite. A typical primitive MORB composition is in the olivine primary phase liquidus volume. Therefore, olivine is the liquidus phase. In each fractionation step, the olivine composition can be calculated from the melt composition and the olivine-liquid Fe-Mg exchange distribution coefficient [KD=(XFeo- XMgiq)/(XMgol. XFesiq) = 0.3±0.031. This exchange KD is constant over the range of compositions and pressures considered in this study (Roeder and Emslie, 1970; Gee and Sack, 1988; Ulmer, 1989). Fractionation of olivine alone proceeds until the melt composition intersects the ol-plag boundary.
Olivine-Plagioclase Fractionation Plagioclase joins olivine as a crystallizing phase when the melt composition reaches the OPM boundary. In the Ol-Plag-Cpx pseudoternary the OPM boundary is extended from the OPALM point, which is predicted from the equations of Kinzler and Grove (1992), perpendicularly to the Ol-Plag sideline. The Ol-Plag sideline is bisected by the OPM boundary into two segments which give the relative proportions of olivine and plagioclase in the fractionating assemblage. The predicted OPM boundary shifts slightly as melt composition changes and the boundary is recalculated at each increment by recalculating the OPALM point for the fractionated liquid. The result is that the olivine proportions vary in a range from 30-26 wt %. Equilibrium plagioclase compositions are calculated using the composition and pressure dependent expressions for plag-melt equilibrium of Grove et al. (1992). Olivine-plagioclase fractionation proceeds until augite becomes stable.
Determining melt compositionfor augite saturation For each increment in the "modeled" ol-plag fractionation path, XCa, XAI and XMg were predicted by eq. 1-3 (Table 5), combined with other components and recalculated to form a "predicted path" of ol-plag-aug saturated melt compositions in the Ol-Cpx-Qtz pseudoternary. When the "predicted" composition for the ol-plag-aug saturated melt matches the "modeled" composition of the ol-plag saturated melt (i.e. the intersection of "modeled" ol-plag fractionation path and "predicted path", Fig. 10), augite joins the fractionating assemblage of the modeled melt. Henceforth, the fractionation assemblage contains three phases: ol, plag and aug. As an example, the first ol-plag-aug saturated melts at various pressures are shown in Fig. 10 along with "modeled" and "predicted" paths using the most primitive glass dredged from the east flank of the overlapping spreading center at 11045'N on the EPR, ALV-2004-3-1.
Prediction of augite compositions coexisting with olivine, plagioclase and a basaltic melt
Augite composition is required in order to model crystallization along the OPAM boundary. Clinopyroxene-melt equilibria is complex and difficult to model, relative to olivine-melt and plagioclase-melt equilibria. Nielsen et al. (1988) found correlations of In K (equilibrium constant between pyroxene and melt) with reciprocal temperature for enstatite (en), ferrosilite (fs) and diopside (di) components in pyroxene at 0.001 kbar. Therefore, quadrilateral pyroxene compositions can be predicted from melt composition if the equilibrium temperature is known. However, en, fs and di components in Nielsen et al. (1988) equations were calculated from the model of Davidson (1985) and Davidson and Lindsley (1985), which neglected minor components such as Al, Ti and Na. Sack and Carmichael (1984) modeled Ti content in clinopyroxene. However, their equations require Mg and Fe molar fractions in the clinopyroxene, information we need as well. In addition to equations for ol-plag-aug saturated melts, Shi (1993) also developed empirical equations for describing augite compositions in the CMAS+FeO+Na2O system. However, these equations cannot predict compositions of augite in the natural system, most likely due to the constant temperature in his calibration data set. In
order to predict augite composition from coexisting melt composition and take minor components into account, I have chosen to model experimentally produced augite compositions empirically. The calibration data set is limited to include only augite compositions that coexist with ol-plag-aug saturated melts. The data set for regression includes experiments on natural samples over the pressure range from 0.001 to 10 kbar (Table 4). Augite composition was parameterized in terms of the composition of its coexisting melt, temperature and pressure. Combinations of independent variables that yield the best fits to 102 experimental augites are provided in Table 7. XFe and XMg were combined as one dependent variable, XFeMg, for regression. XFe and XMg were then determined from augite Fe-Mg exchange KD. The experimentally determined KD is 0.24 at 0.001 kbar (this study) and 0.27 at 8~10 kbar (Grove et al., 1992). XA1 in augite (eq. 10) is calculated from the other components in augite which are predicted from the melt compositions (eq. 5-9). Equation 10 is thus a structure constraint for augite composition.
Olivine, plagioclase and augite fractionation In addition to mineral compositions, phase proportions are also required to constrain crystallization along the OPAM boundary. Recognizing that the OPAM boundary, as simplified by Grove et al. (1992), projects to a point in the Ol-Plag-Cpx pseudoternary, and assuming that the OPAM boundary is linear in the compositional space, one approach to obtain the proportions of ol-plag-aug in the crystallizing assemblage from the position of this point, relative to the projected positions of the three crystallizing phases (ol, plag and aug) in the pseudoternary. The predicted first ol-plag-aug saturated melt gives the ol-plag-aug proportions for the first increment of ol-plag-aug fractionation. After removing this increment, the residual melt composition is projected again onto the OI-Plag-Cpx pseudoternary in order to determine the proportions of crystallizing phases appropriate for the next fractionation increment. In each fractionation increment XCa, XA1 and XMg of residual melt were predicted by equation 1-3, then combined with other modeled components to recalculate into "predicted" compositions. The "predicted" and
"residual" compositions should match well for a self-consistent model of ol-plag-aug crystallization along the OPAM boundary, however, this is not always the case. The lack of correspondence indicates that the OPAM boundary in the Oliv-Plag-Cpx-Qtz pseudoternary is curved rather than linear. Thus, the tangent of a point on this curve does not intersect the 01-Plag-Cpx pseudoternary at the same position as the projection of that point (OPAM point), and furthermore, the positions of tangent intersection vary with melt composition along the OPAM boundary. Therefore, to obtain the proportions of ol-plag-aug crystallizing along the OPAM boundary I used an iterative technique. An initial estimate of ol-plag-aug proportions is chosen using the estimates of Grove et al. (1992). The compositions of residual melts are compared to predicted melts that are obtained using this first estimate of phase proportions. The proportions of ol, plag and aug are then varied until the difference between the "predicted" and "residual" compositions is minimized. The OPALM point was also predicted for each fractionation increment. The OPAM boundary terminates when it meets OPALM point. The OPAM boundary modeled from an experimentally produced ol-plag-aug saturated melt, ALV-2004-3-1-10, is shown in Fig. 11 with that predicted from the method of Grove et al. (1992). The new model provides a better fit to the experimentally determined OPAM boundary than the previous model (Grove et al., 1992).
Comparison of predicted Fractional Crystallization Sequences (FCS) The FCS of ALV-2004-3-1, a high MgO glass from East Pacific Rise (EPR), at 0.001 and 4 kbar, were calculated by the models presented in this chapter (YKG), Langmuir et al. (1992) (with modifications by Reynolds, 1995, referred as LR), Ariskin et al. (1993, COMAG) and Ghiorso and Sack (1995, MELTS). This composition was used for the experimental study, and some aspects of these isothermal experiments can be directly compared with the FCS models. In each model fractional crystallization began at the liquidus and ceased at 5.00 wt % MgO. Results are summarized in Figs. 12, 13 and Table 8. First I compare the phase appearance sequence and proportions of near liquidus phases. In the case of basalt melts that are near multi-phase
saturation on their liquidus (ol-plag and ol-plag-aug in the case of ALV-2004-3-1) the differences between isothermal mineral phase appearance compositions and proportions and those that occur during fractional crystallization are small, so a comparison with the experimental data is justified. Second, I compare experimentally produced mineral compositions in an ol-plag-aug saturated melt with the phase compositions predicted for that liquid by the models. Third, I compare the liquid compositional variations followed during the fractional crystallization. In this instance, the isothermal experiments on ALV-2004-3-1 are not comparable, and only the models will be compared.
The 0.001 kbar the crystallization sequences predicted from YKG, LR, COMAG and MELTS are illustrated in Fig. 12. ALV-2004-3-1 has ol+plag on the liquidus and YKG and COMAG also predict these as liquidus phases. MELTS (not shown in Fig. 9, because temperature interval is small) and LR predict ol as a liquidus phase. YKG, LR and COMAG predict that augite joins the fractionating assemblage when residual melt evolves to 7.24, 7.46 and 7.16 wt% MgO, respectively. However, MELTS predicts that augite crystallizes at 8.39 wt% MgO and orthopyroxene crystallizes at 6.07 wt% MgO. In contrast to the prediction of MELTS, orthopyroxene is not observed in the experiments, nor is it a stable phase on the FCS calculated by YKG, LR and COMAG. Similarly, magnetite is not stable, but is predicted by COMAG. In summary, the early crystallization sequence predicted by MELTS, YKG, LR and COMAG are generally similar to the experimentally determined crystallization sequence, but there are some differences in later phase appearances. At 4 kbar, YKG predicts that ol and plag are liquidus phases, and the residual liquid becomes augite saturated at 8.20 wt% MgO. LR predicts olivine as the liquidus phase (not shown in Fig. 12) followed by plagioclase after a 4 oC interval and augite appears at 8.39 wt% MgO. COMAG predicts ol +plag as the liquidus assemblage, augite crystallizes at 7.9 wt% MgO and magnetite appears at 6.29 wt% MgO. The crystallization sequence predicted by MELTS at 4 kbar is aug - aug+plag - aug+plag+opx -aug+plag+opx+sp. From the experiments of Grove et al. (1992), ALV-2004-3-1 is inferred to
saturate with ol+plag+aug on its 8 kbar liquidus. Thus, MELTS predictions that augite is on the liquidus and that olivine is absent as a crystallizing phase are incorrect. For this reason, the FCS modeled by MELTS at 4 kbar is not considered in the following discussion. In summary, the crystallization sequences at 4 kbar predicted by YKG, LR and COMAG are generally similar and they differ from that predicted by MELTS.
The ol:plag proportions predicted from the four models are slightly different, but close to the proportions measured in ALV-2004-3-1 (Fig. 12). The MELTS estimate is identical to that in the experiment, and the LR estimate is 6 wt% higher in olivine. The ol:plag:aug proportions at the first appearance of aug in ALV-2004-3-1 are 4:50:46. The COMAG estimate (6:50:44) comes closest at 0.001 kbar to the values measured in the isothermal experiment.
To compare the compositions of minerals that each model predicts as crystallizing phases I chose an experimental liquid, ALV-2004-3-1-60, produced at 0.001 kbar and saturated with ol, plag and aug (Table 3). YKG and LR predict ol, plag and aug as saturating phases. MELTS and COMAG do not predict olivine as one of the saturating phases for the ALV-2004-3-1-60 liquid. MELTS predicts aug + plag and COMAG predicts orthopyroxene as the saturating phase. YKG and LR predict the same olivine compositions (Table 8). Predicted anorthite (An) contents in plagioclase are 0.68 (YKG), 0.71 (LR) and 0.62 (MELTS) (Table 8). Compared to those predicted by YKG and LR, the augite composition at 0.001 kbar modeled by MELTS has higher A1203 and FeO, and lower Si0 2, TiO2, and CaO (Table 8). Plagioclase and augite compositions calculated by YKG fall between those predicted by LR and MELTS and are closer to experimental results (Table 8).
FCS predicted from YKG, LR, COMAG and MELTS at 0.001 and 4 kbar are compared in Fig. 13. The different slopes defined by ol-plag saturated melts in the MgO-A1203 and
MgO-Si0 2 plot reflect the slight differences in the ol-plag proportions predicted by the four models. More significant differences exist between the ol-plag-aug saturated compositions predicted by each model. The early appearance of augite in the FCS predicted by MELTS causes low CaO in
residual melts (Fig. 13). The high TiO2 in ol-plag-aug saturated melts modeled by MELTS is due to the low TiO2 contents in augite predicted by MELTS. In general, the FCS calculated from MELTS at 0.001 kbar differs significantly from those calculated from YKG, LR and COMAG. At a given MgO content YKG, COMAG and LR predict lower SiO2 and CaO, and higher FeO at 4 kbar relative to their respective 0.001 kbar FCS. The V-shaped pattern produced by COMAG at 0.001 and 4 kbar (Fig. 13) is caused by the appearance of magnetite as a crystallizing phase. LR predicts higher Na2O contents in augite at 4 kbar causing Na2O in residual melts to increase less steeply (Fig. 13) relative to YKG and COMAG.
Glasses from EPR: an example of fractionation at 2 kbar Glasses were collected with the submersible ALVIN from the east limb of the overlapping spreading center at 11045'N
on the EPR. Most of the samples have MgO ranging from 6-7 %. Detailed sampling localities and major element chemistry are described by Thompson et al. (1989). In the Ol-Cpx-Qtz pseudoternary most of the dredged glasses form a coherent trend parallel to but offset towards olivine from the 0.001 kbar OPAM boundary defined by experimental data (Fig. 14). Some glasses deviate from the coherent trend and plot even farther towards the olivine corner. These are potential parental compositions for glasses that fall on the trend paralleling the 0.001 kbar OPAM boundary. The first ol-plag-aug saturated melts predicted from 4 potential parental compositions at 2 kbar lie on the trend defined by most glasses (solid squares, Fig. 14). Therefore, the trend defined by most glasses can be explained by magmas evolving from different parents to the onset of ol-plag-aug crystallization at 2 kbar. Another possibility that can be tested is that these glasses were derived from a single parent. A group of three samples which lie close to the primitive end of the trend but offset towards Olivine are good candidates. The 2 kbar fractionation path predicted from a potential parent, ALV-2002-2-1, is shown on 01-Cpx-Qtz pseudoternary (Fig. 15). Although the OPAM boundary predicted from ALV-2002-2-1 is consistent with the trend defined by most glasses, the modeled and observed compositions do not correspond. For example, the melt composition of the last increment of the fractionation