Continuous Ion-selective Separation by
Shock Electrodialysis
by
Kameron Michael Conforti Bachelor of Chemical Engineering
University of Delaware, 2013
Master of Science in Chemical Engineering Practice Massachusetts Institute of Technology, 2015
Submitted to the Department of Chemical Engineering in partial fulfillment of the requirements for the degree of
Doctor of Philosophy in Chemical Engineering at the
MASSACHUSETTS INSTITUTE OF TECHNOLOGY FEBRUARY 2019
C 2019 Massachusetts Institute of Technology. All rights reserved.
Signature of Author Certified by:
Si
Certified by: Accepted by: MASSACHUSET OFTECHMAY
0
LIBRA
Signature redacted
- Department of Chemical Engineering
January 4, 2019
gnature redacted__
Martin Z. Bazant E. G. Roos (1944) Professor and Executive Officer of Chemical Engineering Professor of Mathematics Thesis Supervisor
Signature redacted_______
Cullen R. Buie Associate Professor of Mechanical Engineering Thesis Supervisor
_______________Signature
redacted
TS INSTITUTE /, Pdtrick Doyle
NOLOGY Robert T. Haslam (1911) Professor of Chemical Engineering Singapore Research Professor
2
2019
Chairman, Committee for Graduate StudentsR1S
Continuous Ion-selective Separation by
Shock Electrodialysis
by
Kameron Michael Conforti
Submitted to the Department of Chemical Engineering on January 4th, 2019 in partial fulfillment of the
requirements for the degree of
Doctor of Philosophy in Chemical Engineering
ABSTRACT
Cleaning water remains a challenge across sectors and across the globe. Many go without access to clean drinking water simply because the technologies that exist are too expensive in capital or energy. Areas thought to have reliably safe water can be betrayed by aging water infrastructure and exposed to hazardous contaminants. In addition to the need to purify drinking water is the necessity to treat waste water produced by chemical or energy plants. For a long time, reverse osmosis has been used as a catch-all technology for the robust treatment of contaminated water. That robustness comes as the cost of high energy requirements and membranes that can foul quickly under harsh conditions. For low-salinity separations or separations that target specific ions in solution, there may be a better technological fit.
In this thesis, shock electrodialysis (SED) is demonstrated to achieve highly selective continuous removal of magnesium ions from an aqueous mixture of NaCl and MgC2. To explore this phenomena, the SED device has all of its inputs and outputs characterized to determine internal flows of fluid and ions. This careful study provides valuable insight into the mechanisms that drive selectivity, current efficiency, and desalination, as well as potential methods to improve performance. The selectivity comes as a result of the deionization shock and associated depletion region in a negatively charged porous frit. For solutions initially rich in sodium and dilute in magnesium, high (> 98%) removal of magnesium can be achieved with only moderate (50-70%) removal of total salt. Dilute lead is also shown to be selectively removed from a mixture of NaCl and PbC2. A high removal of lead (90%) can be achieved at very low total desalination (< 25%).
The final section of this thesis covers work on a related electrochemical technology that also utilizes current applied perpendicular to flow: flow batteries. A membraneless hydrogen bromine flow battery is developed, achieving record cycles and power density for a membraneless flow
system.
Thesis Supervisor: Martin Z. Bazant
Title: E. G. Roos (1944) Professor of Chemical Engineering, Professor of Mathematics Thesis Supervisor: Cullen R. Buie
Acknowledgements
I first would like to thank my family for their love and support throughout my time here at MIT. To Mom and Dad, I never would have made it this far without you. You instilled in me the values of hard work and perseverance, and you have shaped me into who I am today. To my sister, Kayla you have helped me survive all that shaping. You were always there for me when I needed it, helping me in more ways than I could possibly list.
In my time here at MIT, I have had the fortunate opportunity to live and work around some amazingly talented and wonderful people. They have made me into scientist that I have become. I would first like to thank my advisor Professor Martin Bazant, without whom none of my work would have been possible. Martin, your consistent positive energy and words of encouragement made the entire journey to the PhD much more enjoyable. I would also like to thank my co-advisor Professor Cullen Buie for his support in my research and in navigating all the periods of stress along the way. My committee members Professor Fikile Brushett and Professor T. Alan Hatton consistently provided valuable insights and advice on my career and research.
In being co-advised I have had the fortune of being supported by twice as many friends and colleagues. I would like to thank the Bazant Research Group and Professor Buie's Laboratory for Microsystems Innovation (LEMI) for supporting both my work and myself over the years. Dr. Matthew Suss and Laura Gilson were instrumental in my work on the hydrogen bromine flow battery. Dr. Sven Schlumpberger taught me much of what I know about shock electrodialysis and set me up for a successful project with his advice. Dr. Raymond Smith, Edwin Khoo and Hongbo Zhao have been wonderful workplace neighbors, keeping my spirits up when things looked bleak. I would also like to thank the rest of the Bazant Research Group and LEMI Lab for their friendship and support: Amin Amooie, Barbara Balkwill, Maral Banosian, Dr. Chelsea Catania, Sijie Chen, Yossi Cohen, Supratim Das, Pedro DeSouza, Surya Effendy, Dimitrios Fraggedakis, Yequing Fu, Tao Gao, Dr. Paulo Garcia, Zhiefe Ge, Zongyu (Joey) Gu, Jihyung Han, Fan He, Dr. Andrew Jones, Hyungseok Kim, Yamini Krishnan, Amir Levy, Nancy Lu, Rameech McCormack, Michael McEldrew, Mohammad Mirzadeh, Neel Nadkarni, Matthew Pinson, Arash Sayyah, Juhyun Song, Dr. Chris Vaiana, Qianru Wang, Yi Zeng, and Tingtao (Edmund) Zhou. I would like to thank Anne He as well as Professor Bradley Olsen and Professor James Swan for making 10.10 a joy to TA.
To all the friends I have made throughout the years, you have helped more than you know. I would first like to thank my roommate, John Barton, for sticking with me through all 5 % years. You made the apartment a pleasure to come home to. To Carolyn Mills, Zach Sherman, Steven Brown, Jeffrey Kowalski, Michael Orella, Nicholas Schickel, Naveed Bakh, and everyone else who has made this journey so enjoyable, thank you for your years of friendship and support.
I would also like to thank the funding that has made my work possible. Thank you to the Kuwait Foundation for the Advancement of Sciences as well as the MIT Energy Initiative for funding the work on the hydrogen bromine flow battery. Thank you to the Tata Center for Technology and Design and Mitsubishi Heavy Industries for funding the work on shock electrodialysis.
Table of Contents
ABSTRA CT ... 3
Acknow ledgem ents... 4
Chapter 1: Introduction to w ater treatm ent... 19
1.1 Cleaning w ater across sectors ... 19
1 1.1 D rinking w ater ... 19
Lead Rem oval ... 19
W ater Softening ... 20
1.1.2 W astew ater m anagem ent ... 21
Fracking flow back w ater... 21
N uclear w astew ater... 22
1.1.3 U ltrapure w ater production... 24
1.2 Incum bent w ater treatm ent technologies ... 25
1.2.1 Reverse osm osis (RO)... 25
1.2.2 Electrodialysis (ED) ... 26
1.2.3 Electrodeionization (ED I) ... 27
1.3 Shock electrodialysis (SED) ... 28
1.3.1 H istory ... 28
Concentration shocks in m icrochannels... 28
Concentration shocks in porous m edia ... 30
1.3.2 Operating principle sum m ary ... 37
Chapter 2: Methods for assembly and testing of the Shock Electrodialysis Cell... 39
2.1 D evice fabrication and assem bly ... 39
2.1.1 M aterials description... 39
2.1.2 Com ponent Fabrication... 40
2.1.3 D evice assem bly ... 41
2.2 D evice operation ... 42
2.2.1 Solution preparation... 42
2.2.2 Initial Equilibration... 43
2.2.3 Experim ent conditions ... 44
Experim ental setup and characterization ... 44
2.3 Characterization ... 46
2.3.1 Conductivity... 46
2.3.2 pH ... 47
2.3.3 Inductively Coupled Plasm a - Optical Emission Spectroscopy ... 47
Dilution protocol ... 47
Data collection and processing ... 47
2.3.4 Characterization of the electrochemical stability of the citric acid buffer system... 48
Buffer Selection ... 48
Abbreviated M ethod ... 49
Results ... 49
Chapter 3: Device perform ance ... 51
3.1 Total desalination... 51 3.2 Conductivity... 52 3.3 pH ... 58 3.4 Selectivity ... 65 3.4.1 Ion-specific desalination ... 65 3.4.2 Selectivity of retention... 73 3.5 Ion transport ... 75 3.5.1 Current efficiency ... 77 3.5.2 Current Carriers ... 83 3.6 W ater Recovery ... 96 3.7 Current-voltage ... 97
3.8 Selective lead rem oval... 99
Chapter 4: Prospects of Shock Electrodialysis ... 111
4.1 Summ ary of Conclusions... 111
4.2 Prospects ... 113
4.2.1 Directions for future study... 113
Closed-loop buffer dem onstration ... 113
Selectivity in different salt compositions... 114
M aterial choice improvements... 114
M ultiple-pass separation ... 117
Shock electrodialysis stack ... 119
4.2.2 Applications and econom ic viability ... 119
Tap w ater rem ediation ... 119
W ater Softening ... 120
Lithium recovery... 120
N uclear w astew ater treatm ent... 121
Chapter 5: Hydrogen brom ine m em braneless flow battery ... 123
5.1 Introduction... 123
5.1.1 Grow ing Energy D em and ... 123
5.1.2 Renew able energy portfolio... 124
5.2 Background ... 126
5.2.1 Flow Batteries ... 126
5.2.2 Therm odynam ics of electrochem istry... 128
5.2.3 Hydrogen Brom ine Chem istry ... 130
5.2.4 H istory of the hydrogen brom ine flow battery ... 131
5.2.5 Porous vs. Planar... 132
5.2.6 A cyclable heterogeneous porous m edia architecture... 133
5.2.7 Boundary layer form ation in electrolyte channel... 133
5.2.8 Coulom bic efficiency... 135
5.2.9 M em braneless fuel cells... 137
5.3 Experim ental w ork... 137
5.3.1 M ethods... 137
5.3.2 Results and D iscussion ... 139
5.4 Im provem ents to fluid handling... 141
5.5 M odeling flow batteries ... 144
5.5.1 Hydrogen brom ine m em braneless flow battery ... 144
System assum ptions... 144
G overning equations ... 147
Boundary Conditions: ... 148
H om ogeneous Reaction ... 150
5.5.2 Zinc-iron double m em brane flow battery ... 150
Solving numerically ... 151
R esu lts ... 152 W orks Cited ... 155
Table of Figures
Figure 1: Reverse osmosis operation schematic ... 25
Figure 2: Electrodialysis operation schematic ... 27 Figure 3: Electrodeionization operation schematic. Red and blue beads represent cation and
anion exchange resins ... 28 Figure 4: Microchannel experiments utilizing overlimiting current. a) Schematic for the
microfluidic device used in the experiment by Zangle et. al.5' b) Schematic
representation of the propagation from the nanochannel through the microchannel of an enrichment and depletion front.56 c) Model and d) experiment showing the
depletion (black) and enrichment (yellow) fronts propagating in time.56 e) Experiment setup from work by Wang et. al which produced a stagnant concentration shock.63 ) Schematic of the microfluidic device used by Kim et al. to achieve continuous
desalination.4 5 5 All figures reprinted with permission... 30 Figure 5: Shock electrodialysis theory and physics. a) Schematic of the shock propagating away
from the cation exchange membrane through a negatively charged porous medium.69 b) Simulation showing the propagation of a shock leaving an area of enriched brine and ion-depleted fluid.69 c) results showing the shockwave propagating at a constant speed with a fixed applied current and flowrate. d) proposed architecture for a scaled-up stack of repeating SED units.67 e) Surface conduction and f) electroosmotic flow
as they relate to transport to a cation exchange membrane at overlimiting current.7 4 All figures reprinted with permission. ... 31 Figure 6: Simulation of the shock electrodialysis device by Schlumpberger 2015. a) "Sketch of
simulation domain" b) "Anion concentration profile for a current density of 1.5 A/m2, a flow velocity corresponding to an experimental flow rate of 76 ptL/min and an inlet concentration of 10 mM NaCl" c) "Anion concentration profile for a current density of 9.6 A/m2, a flow velocity corresponding to an experimental flow rate of 76 ptL/min and an inlet concentration of 10 mM NaCl" d) "Anion concentration profile for a current density of 20.4 A/m2, a flow velocity corresponding to an experimental flow rate of 76 pL/min and an inlet concentration of 10 mM NaCl" e) "Pressure profile for a current density of 1.5 A/m2, a flow velocity corresponding to an experimental flow
rate of 76 pL/min and an inlet concentration of 10 mM NaCl" f) "Pressure profile for a current density of 9.6 A/m2, a flow velocity corresponding to an experimental flow
rate of 76 pL/min and an inlet concentration of 10 mM NaCl" g) "Pressure profile for a current density of 20.4 Am2, a flow velocity corresponding to an experimental flow
rate of 76 pL/min and an inlet concentration of 10 mM NaCl" h) "Comparison of the water recovery of the boundary layer theory, the simulation, and the experiments for 10 mM NaCl at conditions corresponding to a flow rate of 76 pL/min" i)
"Comparison of the ion removal percentage of the boundary layer theory, the simulation, and the experiments for 10 mM NaCl at conditions corresponding to a flow rate of 76 pL/min"
j)
"Comparison of the theoretical IV-curve and theFigure 7: The first shock electrodialysis device. a) b) and c) schematics and picture of the first published SED device.6 7 d) a breakdown of conductance into its electroosmotic flow and surface conduction components as a function of the concentration of solution.67 e)
demonstration of overlimiting conduction being dependent on the matching of surface charge with membrane charge.67 f) Demonstration of the removal of an ionic species that is not electrochemically active at the electrodes. A charged dye (fluorescein) was used in a system performing copper electrodeposition and dissolution. g) E. Coli K12 in the feed to the stream and f) in the effluent showcasing the disinfection capabilities of the device. Live cells are stained green while dead cells are stained red.71 All figures reprinted w ith perm ission. ... 35 Figure 8: The development of a scalable architecture for SED. a) Schematic showing the design
and operation of the first scalable SED architecture. b) Pictures showing the make-up of the device. c) Desalination results of the device, showing four order of magnitude reduction in inlet concentration. All the desalination data collapses onto a master curve when scaled by as shown in equation (1.1). d) Water recovery increases as a function of applied dimensionless current and collapses to a master curve. Increased water recovery is due to increased electroosmotic flow in the device at high
currents.7 2 All figures reprinted with permission... 36
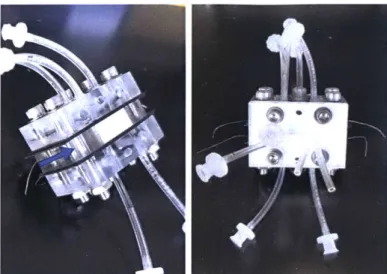
Figure 9: Shock Electrodialysis device schematic... 37 Figure 10: Right side view of the assembled device without the splitter attached (left) and front
view with the splitter attached (right). The arrow indicates the direction of flow... 40 Figure 11: Assembly of the shock electrodialysis device. Rendering performed in
SO LID W O R K S. ... 42 Figure 12: Change in chronopotentiometry through initial runs with a newly assembled device.44 Figure 13: (Left) change in effluent conductivities through initial runs with a newly assembled
device with 3 mA applied. (Right) change in water recovery through initial runs with a newly assembled device with 3 mA applied... 44 Figure 14: Experiment workflow schematic... 45 Figure 15: Photograph of the experiment setup. Insets show the SED device, a fluid capacitor,
and the Keithley 2450 SourceM eter. ... 46 Figure 16: H-cell system used to determine the electrochemical stability and viability of citric
acid as a buffer for the electrode flush streams in shock electrodialysis... 49 Figure 17: GC runs showing oxygen evolution for (top) no added citric acid and (bottom) 100
m M citric acid... 50
Figure 18: GC runs showing C02 evolution over time. The C02 in the system is not a function of the applied current; it is only a function of how many times the study was run. ... 50 Figure 19: Total desalination achieved in the fresh stream as a function of feed composition and
Figure 20: Effluent conductivities of each stream with a feed composition of NaCl:MgCl2 = 1:1 ... 5 4 Figure 21: Effluent conductivities of each stream with a feed composition of NaCl:MgCl2 = 1:5
... 5 5 Figure 22: Effluent conductivities of each stream with a feed composition of NaCl:MgCl2 = 5:1
... 5 6 Figure 23: Effluent conductivities of each stream with a feed composition of NaCl:MgCl2 = 9:1
... 5 7
Figure 24: Effluent conductivities of each stream with a feed of 10 mM NaCl... 58
Figure 25: Effluent pH in each stream with a feed composition of NaCl:MgCl2 = 1:1 ... 60
Figure 26: Effluent pH in each stream with a feed composition of NaCl:MgCl2 = 1:5 ... 61
Figure 27: Effluent pH in each stream with a feed composition of NaCl:MgCl2 = 5:1 ... 62
Figure 28: Effluent pH in each stream with a feed composition of NaCl:MgCl2 = 9:1 ... 63
Figure 29: Effluent pH in each stream with a feed of 10 mM NaCl... 64
Figure 30: Desalination of sodium and magnesium ions in the fresh stream for a feed com position of N aCl:M gCl2 = 1:1... 66
Figure 31: Retention of sodium and magnesium ions in the fresh stream for a feed composition of N aC l:M gC l2 = 1:1... 67
Figure 32: Desalination of sodium and magnesium ions in the fresh stream for a feed com position of N aCl:M gCl2 = 1:5... 68
Figure 33: Retention of sodium and magnesium ions in the fresh stream for a feed composition of N aC l:M gC l2 = 1:5... 69
Figure 34: Desalination of sodium and magnesium ions in the fresh stream for a feed com position of N aCl:M gCl2 = 5:1... 70
Figure 35: Retention of sodium and magnesium ions in the fresh stream for a feed composition of N aC l:M gC l2 = 5:1... 71
Figure 36: Desalination of sodium and magnesium ions in the fresh stream for a feed com position of NaCl:M gCl2 = 9:1... 72
Figure 37: Retention of sodium and magnesium ions in the fresh stream for a feed composition of N aC l:M gC l2 = 9:1... 73
Figure 38: Selectivity of retention of magnesium ions for varied initial salt ratios ... 74
Figure 39: Schematic of the SED device broken into four separate control volumes, one for each of the 4 effluent stream s... 76
Figure 40: Current efficiencies across each interface with a feed composition of N aC l:M gC l2 = 1:1... 78
Figure 41: Current efficiencies across each interface with a feed composition of
N aCl:M gCl2 = 1:5 ... 79
Figure 42: Current efficiencies across each interface with a feed composition of
N aCJ:M gCl2 = 5:1... 80
Figure 43: Current efficiencies across each interface with a feed composition of
N aCl:M gCl2 = 9:1... 81 Figure 44: Current efficiencies across each interface with a feed of 10 mM NaCl... 82 Figure 45: Cathode membrane current efficiency for each feed concentration ratio studied... 83 Figure 46: Ion flux across each control volume interface, normalized by ion flux into each
control volume for a feed composition of NaCl:MgCl2 = 1:1 ... 85 Figure 47: Current carried by each ion across each control volume interface, compared to the
total applied electronic current for a feed composition of NaCl:MgCl2 = 1:1... 87 Figure 48: Ion flux across each control volume interface, normalized by ion flux into each
control volume for a feed composition of NaCl:MgCl2 = 1:5 ... 88 Figure 49: Current carried by each ion across each control volume interface, compared to the
total applied electronic current for a feed composition of NaCl:MgCl2 = 1:5... 89
Figure 50: Ion flux across each control volume interface, normalized by ion flux into each
control volume for a feed composition of NaCl:MgCl2 = 5:1 ... 90 Figure 51: Current carried by each ion across each control volume interface, compared to the
total applied electronic current for a feed composition of NaCl:MgCl2 = 5:1... 91
Figure 52: Ion flux across each control volume interface, normalized by ion flux into each
control volume for a feed composition of NaCl:MgCl2 = 9:1 ... 92 Figure 53: Current carried by each ion across each control volume interface, compared to the
total applied electronic current for a feed composition of NaCl:MgCl2 = 9:1... 93 Figure 54: Ion flux across each control volume interface, normalized by ion flux into each
control volume for a feed of 10 mM NaCl. ... 94 Figure 55: Current carried by each ion across each control volume interface, compared to the
total applied electronic current for a feed of 10 mM NaCl... 95 Figure 56: Water recovery increasing with increased electroosmotic flow across different feed
com positions ... 97 Figure 57: The voltage required to achieve each applied current for each feed composition
studied. a) NaCl:MgCl2 = 1:1; b) NaCl:MgCl2 = 1:5, c) NaCl:MgCl2 = 5:1
d) N aCl:M gCl2 = 1:9, e) 10 m M N aCl ... 98 Figure 58: Effluent conductivities of each stream with an inlet composition comparable to
Figure 59: Effluent pH of each stream with an inlet composition comparable to
lead-contam inated w ater in Flint, M I... 101 Figure 60: Desalination of sodium and lead ions in the fresh stream for a feed composition
comparable to lead-contaminated tap water in Flint, MI... 102 Figure 61: Retention of sodium and lead ions in the fresh stream for a feed composition
comparable to lead-contaminated tap water in Flint, MI... 103 Figure 62: Scaled Selectivity for a feed composition comparable to lead-contaminated tap water
in F lint, M I... 104 Figure 63: Current efficiency across each interface for a feed composition comparable to
lead-contam inated tap w ater in Flint, M I... 105
Figure 64: Ion flux across each control volume interface, normalized by ion flux into each control volume for a feed composition comparable to lead-contaminated tap water in F lint, M I. ... 106 Figure 65: Current carried by each ion across each control volume interface, compared to the
total applied electronic current for a feed composition comparable to
lead-contam inated tap w ater in Flint, M I... 107 Figure 66: Water recovery for a feed composition comparable to lead-contaminated tap water in
F lin t, M I. ... 10 8 Figure 67: The voltage required to achieve each applied current for a feed composition
comparable to lead-contaminated tap water in Flint, MI... 109 Figure 68: Schematic for closed-loop operation with buffered electrode streams. ... 114 Figure 69: Two designs for a capacitive deionization electrode to be implemented for SED. (left)
incorporation of a standard CDI electrode. (right) incorporation of a slurry CDI electro d e... 116 Figure 70: Schematic for a membraneless SED cell comprised of a single porous material with
varied porosity. (left) the single-unit device (right) an example stack with two
simultaneous separations taking place between a single pair of electrodes... 117 Figure 71: Schematic showing the possibilities for process intensification including filtration of
large particles (brown), salt removal or concentration (+ and -), charged particle (orange + and grey -) and uncharged particle (blue) separation, and disinfection by rem oval or cell lysis (green). ... 119 Figure 72: Shock faradaic CDI. Example shown is for lithium iron phosphate for the
concentration of lithium, but any intercalation material could be used to target any ion in so lu tion ... 12 1 Figure 73: Hybrid intercalation and traditional CDI for harvesting lithium or another target ion
from solution. The example intercalation material shown is lithium iron phosphate, but any intercalation material could be used for any target ion... 121
Figure 74: Projected global energy use growth through 2040.2... 123 Figure 75: A breakdown by source of the United States production (82.8 Quadrillion BTU) and
consumption (96.5 Quadrillion BTU) of energy in 2013.2... 124 Figure 76: Projection of the United States renewable energy portfolio through 2040. ... 125 Figure 77: A typical flow battery for a one electron transfer reaction. The tanks on the left and
right hold the cathodic and anodic reactants, respectively. The rectangle in the center represents the electrochem ical cell. ... 127 Figure 78: Flow battery architecture utilizing heterogeneous porous media to enhance mixing
within the cathode while keeping the electrolyte fluidically separate. 92 Reprinted
from Suss et al. w ith perm ission... 133 Figure 79: Simulation of boundary layer formation above the dispersion blocker. The boundary
layer growth has been sketched in grey.92 Reprinted from Suss et al. with permission
... 13 4 Figure 80: "a) Single-pass polarization curve results of our membraneless battery prototype for
various Br2 concentrations. b) Power density calculated from the data shown in a), demonstrating a maximum power density of 0.925 W/cm2 when using 3 M Br2 concentration. c) Voltage efficiency calculated from the data in a), where we attain a voltage efficiency of 96% at 20% maximum power (0.19 W/cm2) with 3 M Br2
concentration." 92 Reprinted from Suss et al. with permission... 140 Figure 81: "a) Results of constant current cycle testing of our membraneless flow battery
prototype at 0.2 A/cm2 current, demonstrating over 30 attained cycles with 1 M Br2 oxidant, and a decay in discharge voltage of less than 3 mV/cycle. b) Cell round-trip voltage efficiency versus cycle number, as calculated from the data in Figure 12a. For
1 M Br2, the voltage efficiency is 89% for the first cycle, and 80% for the 30th
cycle."17 Reprinted from Suss et al. with permission ... 141 Figure 82: "Leak-proof' two-part gasketing scheme. Incompressible PTFE spacers set the height
of the gasket channel, while a compressible PTFE gasket seals the liquid in. The holes around the outside are for bolts that double as alignment pins. The channel in the center is for the electrolyte stream ... 142 Figure 83: "Leak-proof' flow battery design incorporating the new two-part gasket design.... 143 Figure 84: Changes to the hydrogen bromine battery introduced by changes in the gasketing
m aterial. ... 14 4 Figure 85: HBMFB schematic used for modeling transport including dispersion... 147 Figure 86: Equivalent circuit model for calculating the resistance of the open channel in the
double-m em brane Zn-Fe flow battery. ... 152 Figure 87: "Experimentally measured and theoretically calculated Rcp as a function of
dimensionless number X. (a) Experimentally measured Rcp as a function of
dimensionless number X and linear fitting on log-log scale. Linear fitting of log X vs. 14
log Rep shows a slope of -0.7, i,e., as Rp oc X~0 7. (b) Theoretically calculated Rep as a function of dimensionless number X. (c). Comparison between theoretically
calculated Rcp (empty symbols) and experimentally measured Rcp (filled symbols) with respect with the dimensionless number X. Both measured and calculated R0p data have similar trend with respect with the dimensionless number X." Adapted from
List of Tables
Table 1: Sources of aqueous liquid radioactive wastes. Adapted with permission from Rahman et. al ... 2 2 Table 2: Features and limitation of different aqueous liquid treatment options. Adapted with
permisison from Rahman et. al ... ... ... .. .... . . . 24 Table 3: Summary of performance for each feed composition at the maximum selectivity
ob serv ed ... 7 5 Table 4: A review of Coulombic efficiencies attainable by liquid batteries... 136 Table 5: Notation for flow battery modeling ... 146
Chapter 1: Introduction to water treatment
1.1 Cleaning water across sectors
1.1.1 Drinking water
According to the World Health Organization (WHO) and the United Nations International Children's Emergency Fund (UNICEF), 29% of the global population is not using a safely managed water source.1 Eight percent of the world's population relies on surface water or another unimproved water source.1 Regionally, this fraction can soar upward of 40%.1 Even in highly developed nations like the United States, breakdowns in local infrastructure can leave many without reliable access to clean drinking water. Residents in Flint, Michigan recently had to deal with dangerously high levels of lead in their water due to corrosion of their pipes.2',3 In Lower
Saxony, Germany, copper levels in tap water have been linked to health problems in infants.4 Arsenic has been found in many well water sources throughout central Appalachia in the United States as well as across most of India.5'6 Even some safe tap water requires treatment in the form of water softening to prevent buildup of scale on plumbing and to minimize the amount of soap required to generate lather.7-9
Lead Removal
Several strategies exist for removal of contaminants. For lead, the most common recommendation is to use a filter that removes all dissolved solids, including lead."1- While effective at removing 99% of lead, the filtration cartridges must be replaced at least 4 times a year, with the standard recommendation being monthly." One such commercial filtration product, Zero Water, states that it can remove a total of 18 grams of dissolved solids before needing replacement
on a filter cartridge that costs about 9 dollars." For a typical 50 ppm tap water stream, this filter will cost about 2.5 cents per liter.
In the United States alone, there are an estimated 6.1 million lead service lines in use, serving upwards of 20 million people." According to the U.S. Environmental Protection Agency, the average household uses over 200 gallons per day for indoor water use.5 Using the average family size of 2.58 reported by the U.S. Census Bureau6, the total amount of water pumped through lead
service lines and into households can be estimated at 473 million gallons per day. If lead remediation is only performed on the water required for drinking, food preparation, and basic sanitation, the requirement drops to 20 liters per person per day'7 or 32 million gallons per day. Even if only 1% of those lead service lines begin to release lead into the drinking water, the cost of filtration would be approximately 450 thousand dollars per day ($164 million annually).
Water Softening
Technologies that seek to selectively remove magnesium and calcium are called water softeners. These technologies work by selectively adsorbing magnesium and sodium with an ion exchange resin. 18-20 To regenerate the resins, a solution with sodium or potassium chloride is used
to displace the adsorbed magnesium and sodium. Typical recommendations are a 10% solution of sodium chloride20 with 10 pounds of salt required per cubic foot of resin, which equates to about 9 lbs of NaCl per 10 lbs of multivalent salt adsorption capacity regenerated. 8 The brine generated
during regeneration of the resins cannot be reused for future regeneration of the resin as it becomes contaminated with magnesium and calcium, which severely hampers its regenerative capability.18 At a cost of about $0.15 per pound of sodium chloride,21 each pound of magnesium/calcium salt costs about $0.13 to remove. Despite the water wasted during the regeneration process which requires the brine injection as well as a fresh water flush, the overall process has a very high water
recovery.'8 There is no wasted water during normal operation, so the water recovery is set by the frequency at which the resin needs to be regenerated, which is a function of the hardness of the inlet water.
1.1.2 Wastewater management
There are countless opportunities for improvement to the treatment of various industrial wastewater streams. Two such streams that appear to have opportunity for the implementation of shock electrodialysis are flowback water from hydraulic fracturing, and radioactively contaminated waste from nuclear energy production.
Fracking flowback water.
In the 2018 Annual Energy Outlook from the U.S. Energy Information Administration, the United States energy production from natural gas is expected to increase from 28 to 37 quadrillion BTU by 2050.22 With this increased demand for natural gas, hydraulic fracturing activities will have to increase. Globally, restrictions have been put into place to limit the environmental impact of the fluid used for fracturing. In Canada in 1999, the removal of land farming as an acceptable method of disposal drove up costs and spurred companies to investigate recycling strategies.2 3
Domestic companies are pushed toward recycling as well; in natural gas production from the Pennsylvania Marcellus Shale Play, fracturing fluid is reused in about 55% of cases24. The type and amount of salinity in the recycled water can have a significant impact on operations; specifically, scale forming ions are problematic. Research into effective methods for recycling the flowback water from hydraulic fracturing continues, with some viable options, but room for
Nuclear wastewater
In the generation of nuclear energy, high volumes of water are contaminated by low concentrations of radioactive species. These low-level wastes represent 90% of the nuclear waste volume, but only 1% of the total radioactive species.30 In 2017, over 5 million cubic feet of low-level waste was transported and disposed in the United States across four sites: Andrews County, TX; Barnwell, SC; Clive, UT; and Richland, WA.3 Rahman et. al detail the most common sources of aqueous radioactive waste, many of which are low level waste streams, in Table 1 below.3 2
Table 1: Sources of aqueous liuid radioactive wastes. Adapted with permissionfrom Rahman et. a P2
Source Typical radioisotopes Characteistics
Nuclear research centers Might include relatively long lived, Generally uniform batches with nearly mixed with short lived neutral pH from regeneration of ion
exchange resins
Radioisotopes Lab. production Wide variety depending upon Small volumes of high specific activity and production and purity of targets. high chemical concentrations
Larger volumes of low specific activity Radio-labeling and 14C, 3H, 32p 35 1251 Small volume of predictable chemical
radiopharmaceuticals composition
Medical diagnosis and treatment 9TCm, 131, 85 r Large volumes of urine from patients
Small volumes from preparation and
treatment
Scientific research Variable, with short and long lived Extremely variable radioisotopes
Industrial and pilot plants Depends upon application Volumes could be large and chemical
I_ composition undefined
Laundry and decontamination Wide variety likely Large volumes with low specific activity
I but containing complexing agents
Some nuclear waste never leaves the energy generation facility due to a failure on the part of the U.S. government to take stewardship of the waste as part of the Nuclear Waste Policy Act of
1987." According to the U.S. Government Accountability Office," "DOE reported at the end of
fiscal year 2016 that the federal government has paid industry about 6.1 billion in damages and has projected future liabilities at about $24.7 billion. Each year of delay adds about $500 million to federal liabilities." Low-level wastes should be concentrated to minimize transportation and
storage costs and minimize the strain on storage capacity. Currently electrodeionization, ion-exchange, reverse osmosis, precipitation, evaporation, ultrafiltration, microfiltration, solvent extraction, and membrane distillation are all used in some capacity for the treatment of nuclear wastewater.3 2
,35,36 But, research remains ongoing for improved methods.3 7 Rahman et. al tabulate the characteristics of the most common treatment techniques below (Table 2)32.
Table 2: Features and limitation of different aqueous liquid treatment options. Adapted with permisison
from Rahman et. a32
Technology Features Limitations
Precipitation Suitable for large volumes and high salt Low Decontamination Factor content waste
Easy non-expensive operations Efficiency depends on solid-liquid separation step
Ion-Exchange Good chemical, thermal and radiation Affected by high salt content stability
Large choice of products ensuring high Blockage problems selectivity
Regeneration and recycling often difficult
employed
Evaporation *Decontamination Factor > 104 to 106 Process limitations (scaling, foaming, corrosion, volatility of certain radionuclides)
Well established technology High operation and capital costs High volume reduction factor
Suitable for a variety of radionuclides
Reverse osmosis Removes dissolved salts High pressure system, limited by osmotic pressure
Decontamination Factor 102-103 Non-back washable, subject to fouling
Economical
Established for large scale operations
Ultrafiltration Separation of dissolved salts from Fouling particulate and colloidal materials
Good chemical and radiation stability Organic membranes subject to radiation for inorganic membranes damage
Microfiltration High recovery (99%) Sensitive to impurities in waste stream Low fouling when air backwash
Solvant extraction Selectivity enables removal, recovery Generates aqueous and organic secondary or recycle of actinides waste
1.1.3 Ultrapure water production
In some applications, ultrapure water is required because the manufacturing tolerances are so
low." In semiconductor processing, the water must be essentially free of all ions, particles, and
non-water molecules to prevent contamination of the valuable components being manufactured. Pharmaceutical manufacturing requires the chemistry to remain completely identical from batch to batch. Power generation facilities, which operate by boiling water into high pressure steam to be forced through a turbine, require high purity water to avoid damage to the expensive equipment.
Other applications include academic and clinical laboratories, some food and beverage production, and chemical manufacturing.38
1.2 Incumbent water treatment technologies
1.2.1 Reverse osmosis (RO)
Reverse osmosis works by forcing fluid through a membrane as shown in Figure 1. The membrane acts as a selective barrier, preventing ions and particles from passing through, while allowing the permeation of water. As the brine becomes more concentrated, the osmotic pressure across the membrane becomes higher. This osmotic pressure and the fluidic resistance of pushing water through the small pores of the membrane must both be overcome by the pump in the system. RO is very efficient for the treatment of high salinity streams like salt water. However, at low salinity the osmotic pressure is small compared to the pressure drop due to the membrane's small pores, so the energy efficiency suffers. Generally, reverse osmosis has the advantages of being a well-understood, robust water treatment technology that operates efficiently at high salinity. Its major downfalls are its energy efficiency when treating low salinity streams and membrane scaling due to the high concentrations of contaminants that build up at the membrane interface.3 9
Membrane
1.2.2 Electrodialysis (ED)
Electrodialysis is an electrochemical method for removing dissolved salt from solution as seen in Figure 2 below. The system is usually set up with a single set of water splitting electrodes providing the current for the whole device. This allows a single electron transfer to provide desalination many times over through the repeating membrane cell pairs that comprise the rest of the device. The membranes are arranged as alternating cation exchange and anion exchange. Ion transport takes place with cations moving toward the cathode and anions moving toward the anode. The ions move out of the fresh stream with cations and anions passing easily through their respective membranes. They then enter the brine stream and continue to move toward their respective electrodes, but find their path blocked by an oppositely selective membrane. The result is alternating effluent streams of fresh and brine.
Electrodialysis is widely used to desalinate or concentrate salts.4 -4 The main advantages are
its ability to only transport ions and dramatically lower pumping costs compared to RO. Specifically, ED excels when concentrating or desalinating electrolyte solutions.45 It is not
practical for the removal of any uncharged species or charged particles. The main downfall of electrodialysis is the high capital cost of an ED stack, driven mostly by the cost of its membranes.45 Also, at very low salinity, the fresh stream conductivity becomes extremely low, causing large Ohmic resistances throughout the system.
Brine Fresh Brine 0 C' G00 o c o 20t- W 05 2 20H- 2 (D4. 2H+ 02 U +2H+ W H2 .2 0 ,0 .E .2
Figure 2: Electrodialysis operation schematic.
1.2.3 Electrodeionization (EDI)
Electrodeionization can be thought of as the combination of electrodialysis with another chemical unit operation, ion exchange.45 A schematic for EDI is given below as Figure 3. It is similar to Figure 2 except that the fresh stream channel contains a packed bed of ion exchange resin. As concentration depletes in the flow direction, less current is carried by ion transport and more is supplied by water splitting. In EDI, a mixture of cation and anion exchange resins is usually used to remove ions from solution.4 -9 In traditional ion exchange, these same resins would pull ions out of solution as they changed from the acid or base form to the adsorbed ion form. The resins would then need to be regenerated by acid or base treatment. In EDI, this regeneration could take place continuously.50 At very low ion concentration, the system does not conduct much of the ionic current through the aqueous solution. Instead ions are conducted along or through the resins.50 Even very early on, it was understood that at the points of contact between dissimilar resins, water splitting would occur. This phenomenon was also found at the interface between dissimilarly charged membranes and resins.50 The water splitting is what allows for the regeneration of resin, but it is also the main source of current inefficiency. A study from
the Atomic Energy Research Establishment showed that the fraction of current carried by H' and OH- was upwards of 90% and increased at increasing current density.
Deionization and water splitting region
Brine Fresh Brine
-0C EEE 20H-~ 0) ~ 0 @0 w.M U -02Q x-0 cm j
t/t
Desalination regionFigure 3: Electrodeionization operation schematic. Red
exchange resins.
1.3 Shock electrodialysis (SED)
t
-0 E Ui 0 2H+ I 000 H2and blue heads represent cation and anion
1.3.1 History
Concentration shocks in microchannels
Deionization shocks were first discovered and studied in nanochannels in microfluidic lab-on-a-chip devices. -2 In 2009 Zangle, Mani, and Santiago built and modeled a microchannel system to become the first to observe the propagation of a deionization shockwave. Two microchannels with a negative surface charge were filled with a stagnant electrolyte and separated by a negatively charged nanochannel, which had sufficient charge in the dilute electrolyte to have overlapping double layers (Figure 4 a and b). The nanochannel acted as an ion-selective surface to initiate the
shock, and based on differences in color, they mapped the change in the concentration of the Alexafluor dye used as the salt (Figure 4 d). Their modeling showed that the depletion on one side and enrichment on the other could be described as a shock (Figure 4 d).56'59 Evidence of stationary deionization shocks can be found as far back as 2005 in the work of Wang et al., though the shock itself was not identified at the time. Experimenters found a biomolecule trapping effect behind an ion depletion region near a nanojunction in their the device,63 (Figure 4 e) but it was not until the work of Mani, Zangle, and Santiago that the cause of the phenomenon - a deionization shock -was explained.59 In 2010, Kim et al published a microfluidic device that used the concentration polarization to desalinate seawater.5 4'5 5 By passing current in the direction of flow and through a nanochannel junction, a concentration shock and a deionized region were formed leading up to the nanojunction. This deionized fluid below the shock was collected separately from the enriched brine above the shock as seen in Figure 4 f.
b) C propagation of depletion region microchannel propagatio enrichment r nanochannel, microchannel
ITappe Ion dopletion
e) biomolecule plug region
E channelMirofludic Molmcues from ET / sample re60fVi* Chamnel En a) 1 cm 10 100 pm 20 pm wide n Reservoir I I p m high 50 or 100 nm T ._microchannel high nanochannel
GND GND
Figure 4: Microchannel experiments utilizing overlimiting current. a) Schematic for the microfluidic device used in the experiment by Zangle et. al. b) Schematic representation of the propagation from the
nanochannel through the microchannel qf an enrichment and depletion front.-6 c) Model and d) experiment
showing the depletion (black) and enrichment (yellow) f-onts propagating in time.5 e) Experiment setup f-om work by Wang et. al which produced a stagnant concentration shock. 63f) Schematic ofthe microfluidic
device used by Kim et al. to achieve continuous desalination.4,5 All figures reprinted with permission.
Concentration shocks in porous media
While the microfluidic experiments were critical to the current understanding of shock electrodialysis, they did not represent a system that could be used at a large scale. To produce any meaningful quantity of water, a massive number of parallel channels would need to be fabricated and operated. In a sense, porous media is a less stringently controlled, but much more compact system of interconnected parallel microchannels. The first designs for such a device were proposed in patent applications in 2010 from Bazant et al.64,65 Experiment and theory both pushed forward the idea of overlimiting current through a charged porous medium.6472 In 2011, Mani and Bazant showed, through theory and simulation (Figure 5 a, b, and c) the way a shock would develop and
c) 100 80 ~601 40, 20 -1000 -500 0 500 1000 Axial position (pm) d) 100 80 n o 60 egion 4 .E 40 20 -1000 -500 0 500 1000 Axial position (pm) Desaltt water V+ Seawater pressure Ion-depletion boundary
I__ _ _ _ __ _ _ _
propagate in porous media. The transport processes that allowed the passing of overlimiting current in a microchannel with charged walls were described in 2011 in modeling work by Dydek et al. The work showed that when confmed to small pores (-100 pm), electroosmotic flow dominates transport, while at even smaller pore diameters (~A pm) surface conduction takes over (Figure 5 e and f). Later visualization experiments by Nam et al. confirmed the regimes in which surface conduction and electroosmotic flow both play a role in sustaining overlimiting current in a microchannel." A boundary layer theory was also developed to predict performance of an SED device assuming that the fluid moved purely in plug flow and was unperturbed by effects such as electroosmotic flow." a) 4Vu membrane d) 15 - - + + __+_+ +-- ++ nH l 'A / 0, 0 nt/2 HeIt-E)+-- ~- - - NC1 b) -0--Vshock V pleted .. . Deionized :.- - --- -NaCl e) f) - - - - - - - - - - - - - ---->-- -- -Jn- -u
--Figure 5: Shock electrodialysis theory and physics. a) Schematic of the shock propagating away from the cation exchange membrane through a negatively charged porous medium.6 9 b) Simulation showing the propagation of a shock leaving an area of enriched brine and ion-depleted fluid.6 9 c) results showing the shockwave propagating at a constant speed with a fixed applied current and flowrate. d) proposed
architecture fbr a scaled-up stack of repeating SED units.' e) Surfiice conduction andf) electroosmotic flow as they relate to transport to a cation exchange mnembrwane at overliniting current. A11 figures
reprinted with permission.
The first simulation to attempt to fully capture the effects of electroosmotic flow on both desalination and water recovery in the SED device was published in Schlumpberger's thesis in this research group. The simulation was performed in Python using a finite volumes framework provided by Raymond Smith, an alumnus of this research group. The work extended the "Leaky membrane" model by Dydek et al.68 Figure 6 a shows the a schematic of the simulation domain with the key inclusion of an entrance region (I) as well as an exit domain (III) that was split in half by an impermeable wall (9) into a brine region on top and desalinated stream on bottom. The
simulation was able to show concentration polarization at below limiting current (Figure 6 b) and above limiting current with the shock propagating to (Figure 6 c) and past (Figure 6 d) the splitter to generate a completely deionized stream. The effects of electroosmotic flow were captured by fully solving the fluid flow through the simulation domain. The pressure profiles for the three conditions were simulated and show the electroosmotic pressures and flows becoming stronger with increased applied current density (Figure 6 e, f, g). The higher pressure gradients across the outlet of the desalinated stream compared to the brine stream results in an increase in water recovery. Figure 6 h compares the experimentally measured increase in water recovery to the water recovery predicted by the boundary layer model and the simulation. The boundary layer model cannot predict any increase in water recovery, while the simulation provides reasonable agreement in the data. Figure 6 i compares the experimentally measured ion removal to the removal predicted by the boundary layer model and the simulation. Both can predict the total removal of ions at large applied currents, but the simulation predicts the low-current behavior much better. Figure 6
j
compares the experimentally realized polarization curve to the predicted polarization curve. The simulation neglects any of the physics at the electrodes, so it misses phenomena like onsetpotentials for water splitting. It does, however, predict the slope of the curve at overlimiting current somewhat accurately. 1 2 3 L 9 7 6 5 3L x Position [cm] C) d) 50.; e) 0.; s. 0.0 x Position [cm) 0.5 1.0 1.5 x Position Itmi 2.
I
:
l
2.0 2.0 g) T0.; X Position [cmi 4 H h) 7 70 65 Z'60 855 3:45 B1.8081.608 IA107 1i005 0604 1809 1:608!1.407
1.206 1.005 0804 2.5 0402 0:201 0.000 1809 1407 1:206 1.005 0.804 2. 0402 0.201 0.000 1.3733!13270
1:2808 1.234! 25 1:141C. 1.0491 1.0033 1-419(!.
13731 13 27i 1 280i 1.1883 1.141S 2.5 1.0954 B14124 ~1373: 1328! 1280! 1:234; 1.1414 2.5 1.095. 10481 10024 40 b 0.5 1 10C 80 S6C C 40 0 20 1.5 2 2.5 Current (I/(z~c~eQ)) 3 3.5 4 4 rn1 2 3 Current (tI(z~c~eQ)) 25-1 V 20- 5-3 4 5 Potentigl (V) IS 7 8Figure 6: Simulation of the shock electrodialysis device by Schlumpberger 2015. a) "Sketch of simulation domain" b) "Anion concentration profile for a current density oJ'J.5 A/M2, aflow velocity corresponding to an experimental flow rate of 76 pL/min and an inlet concentration of 10 mM NaCl" c) "Anion concentration profile for a current density of 9.6 A/m2
, aflow velocity corresponding to an experimental flow rate of 76 pL/min and an inlet concentration of 10 mM NaCl" d) "Anion concentration profile for a current density of 20.4 A/in2, aflow velocity corresponding to an experimental flow rate of 76 pL/min and an inlet concentration of10 mMNaCl " e) "Pressure profilefor a current density of].5 A/M2
, aflow velocity corresponding to an experimental flow rate of 76 pL/min and an inlet concentration of 10 mM NaCl" f)
"Pressure profile for a current density of 9.6 A/M2 , aflow velocity corresponding to an experimentalflow rate of 76 uL/min and an inlet concentration of 10 mMNaCl" g) "Pressure profile for a current density of 20.4 A/in2
, a flow velocity corresponding to an experimental flow rate of 76 pL/min and an inlet concentration of 10 mM NaCl" h) "Comparison of the water recoveiy of the boundary layer theory, the simulation, and the experiments for 10 mMNaCl at conditions corresponding to aflow rate of 76 pL/min" i) "Comparison of the ion removal percentage of the boundary layer theory, the simulation, and the
a) 8 BL Theory Simulation DataT b) s. 0.05 BL Theory Simulation Data f) v Experiment * Simulation IMMIMwi.iiii- "'' . ", . ". n I . 2.0
experiments Jbr 10 mM NaCI at conditions corresponding to aflow rate of 76 pL/min -j) "Comparison of the theoretical IV-curve and the experimental IV-curve for 10 mMNaCl"
The first shock electrodialysis experiments were reported by Deng et al. in 2013, in which a microporous borosilicate glass frit (average pore size 500 nm) was used as the charged porous media to sustain overlimiting current.67 The device was radially symmetric (Figure 7 a, b, and c) and used copper dissolution (anode) and electrodeposition (cathode) as the electrode reactions to supply an overlimiting current through a copper sulfate electrolyte. The device was able to achieve a four order of magnitude reduction in the concentration of copper sulfate, showing for the first time the possibility of SED as a water desalination technology. Theory for SED in porous media was also presented in that paper, explaining some of the effects of the interconnectivity of the pores and the scaling laws expected for current due to electroosmotic flow and surface conduction (Figure 7d).67 It also directly showed the importance of surface conduction by demonstrating that
overlimiting current could only be sustained when the charge of the porous medium matched that of the membrane near the depleted region as shown in Figure 7e. In 2015, the same device was demonstrated to have additional water purification capabilities that are not present in other desalination technologies.7' Specifically, it demonstrated filtration of large particles, separation of charged dye (Figure 7f), and disinfection of E Coli K12 (Figure 7 g and h).7' The device worked well and served to validate the theories that had been presented so far, but the radially symmetric geometry made scale-up difficult. Even in early on, the necessity was pointed out of transitioning to a more scalable architecture as shown in Figure 5d.
a) d) 10-2 10-1 104 10-1 10-6 anode (Cu) reservoir - SO42- Cu2+
glass frit
membrane cathode(Cu) b) 104 10 10-2 10-' Concentration (M) e) 0.I[
0.08- 0.06-0.04 U c) 0.02F 100 Voltage (V) 0.8 0.7 0.6 tiO'i 10 10Flow rate ( I/min)
Figure 7: The first shock electrodialysis device. a) b) and c SchemIICHUCS and picture of the first published
SED device.6 7
d) a breakdown of conductance into its electroosmotic flow and surface conduction
components as a function of the concentration of solution.! e) demonstration of overlimiting conduction being dependent on the matching of surface charge with membrane charge.6 f) Demonstration oj the removal of an ionic species that is not electrochemically active at the electrodes. A charged dye (fluorescein) was used in a system performing copper electrodeposition and dissolution. g) E. Coli K12 in the fred to the stream andf) in the effluent showcasing the disinfection capabilities ofthe device. Live cells are stained green while dead cells are stained red." Allfigures reprinted with permission.
The next generation device employed a rectangular geometry to make future scale-up efforts easier.72 In 2015, Schlumpberger et al. showed that the new architecture (Figure 8a and b) could still achieve over 99.99% desalination.72 The work also demonstrated that for a binary salt, the desalination was insensitive to the specific salt chosen as seen in Figure 8c. The desalination was
--- negative (bare silica)
---.-- -positive (LBL) .positive (silanization) 1.5 - 5--sc 2 cm' I
only a function of the dimensionless current, given below as equation (1.1). I is the current, z+ is the charge number of the cation, c+ is the concentration of the cation, F is Faraday's constant, and
Q
is the volumetric flowrate into the frit.7 2 The work also reported the effect of electroosmotic flow on the water recovery in the system. Because the surface transport will always be occurring in the deionized region and the electroosmotic flow is in the direction of the surface transport, an increase in water recovery results from an increase in applied current and therefore electroosmotic flow (Figure 8d).i
I (1.1) z+c FQ e-a) Anodemc)
1/2H2 ' /4 02 Frit -d Splitter Shock Deionized 0H_ H2 /2H2 Na+ Cathodem 10' 10 M 76 0Jmin Na2SO 10 mM 76 pJmin KC 10 mM 76 ImJ/in KNO3 10 mM 76 pWmin Naal n 100 mM 76 Jmin Na0 * 1mM 76 0JmmnNaCI * 10 mM 38 pJminNaC 102 -v 10 mM 152 Imin NaO 0 1 2 3 4 5 6Current (I/(z c eQ))
b) Cathode-side Outlet Anode-side Outlet d .8
Catholyte Outlet Anolyte Outlet (Desalinated) (Enriched)
a0.7 0.6 a 10 mM76 Almin KCS 0.5 0 mm76Wmin KNO3 10 mM 76 Wimin NaCI
I
* 10mm 76 iiWmin .0 0.4 1mM30AJminNaCi V 10 m#Al12 IiA~mNaCO 0 1 2 3 4Catholyte Inlet Frit Anolyte Inlet Splitter Device/Frit Inlet Pt wIre Current (E(K/(poQ))
Figure 8: The development of a scalable architecture for SED. a) Schematic showing the design and operation of the first scalable SED architecture. b) Pictures showing the make-up of the device. c) Desalination results of the device, showing four order of magnitude reduction in inlet concentration. All the desalination data collapses onto a master curve when scaled by as shown in equation (1. 1). d) Water recovery increases as a function of applied dimensionless current and collapses to a master curve.
Increased water recovery is due to increased electroosmoticflow in the device at high currents.2 Allfigures reprinted with permission.
1.3.2 Operating principle summary
Shock electrodialysis operates by passing a high current through an electrolyte that is confined by charged walls. At high enough (overlimiting) current, a sharp deionization front (called a shock) emerges and begins to propagate. In the depleted region, current is sustained by surface conduction and electroosmotic flow, which keep ions close to the walls while the bulk fluid is deionized. In cross flow, the deionized fluid can be collected separately from the rest of the electrolyte. The current prototype accomplishes this separation as shown below in Figure 9.
NaC Anode

![Figure 20: Effluent conductivities of each stream with a feed composition ofNaCIl:MgCl 2 = 1:]](https://thumb-eu.123doks.com/thumbv2/123doknet/14471255.522384/54.917.123.696.130.573/figure-effluent-conductivities-stream-feed-composition-ofnacil-mgcl.webp)


![Figure 25: Effluent pH in each stream with a feed composition of NaCl:MgCl 2 1:]](https://thumb-eu.123doks.com/thumbv2/123doknet/14471255.522384/60.917.152.694.134.573/figure-effluent-ph-stream-feed-composition-nacl-mgcl.webp)


