DEVELOPMENT AND ANALYSIS OF STARTUP STRATEGIES FOR A PARTICLE BED NUCLEAR ROCKET ENGINE
by
DAVID E. SUZUKI B.S., Astronautical Engineering United States Air Force Academy, 1991
Submitted to the Department of Aeronautics and Astronautics and the
Department of Nuclear Engineering
in Partial Fulfillment of the Requirements for the Degrees of Master of Science in Aeronautics and Astronautics
and
Master of Science in Nuclear Engineering . at the
Massachusetts Institute of Technology June 1993
This paper is declared a work of the U.S. Government and is not subject to copyright protection in the United States. Signature of Author
Department of Aeronautics and Astronautics Department of Nuclear Engineering, April 26, 1993 Certified by
Profes r Jack L. Kerrebrock, Department of Aeronautics and Astronautics Thesis Co-Supervisor Certified by
Professor David D. Lanning, Departmeinof Nuclear Engineering Thesis Co-Supervisor
Accepted by
-Professor Harold Y. Wachman, DepartCnt of Aeronautics and Astronautics Chairman, Department Graduate Committee Accepted by
aeror Prmfessor Alian F. Hen, Department of Nuclear Engineering Chairman, Department Graduate Committee MASSACHUSETTS INSTITUTE
O TF HNI)I OGY
JUN 08
1993
DEVELOPMENT AND ANALYSIS OF STARTUP STRATEGIES FOR A PARTICLE BED NUCLEAR ROCKET ENGINE
by
DAVID E. SUZUKI
Submitted to the Department of Aeronautics and Astronautics and the
Department of Nuclear Engineering on April 26, 1993 in Partial Fulfillment of the Requirements for the Degrees of Master of Science in Aeronautics and Astronautics
and
Master of Science in Nuclear Engineering
Abstract
The particle bed reactor (PBR) nuclear thermal propulsion rocket engine concept is the focus of the Air Force's Space Nuclear Thermal Propulsion program. While much progress has been made in developing the concept, several technical issues remain. Perhaps foremost among these concerns is the issue of flow stability through the porous, heated bed of fuel particles. There are two complementary technical issues associated with this concern: the identification of the flow stability boundary and the design of the engine controller to maintain stable operation. This thesis examines a portion of the latter issue which has yet to be addressed in detail. Specifically, it develops and analyzes general engine system startup strategies which maintain stable flow through the PBR fuel elements while reaching the design conditions as quickly as possible. The PBR engine studies are conducted using a computer model of a representative particle bed reactor and engine system. The computer program utilized is an augmented version of SAFSIM, an existing nuclear thermal propulsion modeling code; the augmentation, dubbed SAFSIM+, was developed by the author and provides a more complete engine system modeling tool. Elements of the startup strategy considered include: the coordinated control of reactor power and coolant flow; turbine inlet temperature and flow control; and use of an external starter system. The simulation results indicate that flow instability is an issue which must be considered in formulating the engine startup strategy. The use of an external starter system enables the engine to reach design conditions very quickly while maintaining the flow well away from the unstable regime. If a bootstrap start is used instead, the transient progresses somewhat slower and approaches closer to the unstable flow regime, but allows for greater engine reusability. These results can provide important information to engine designers and mission planners. In addition, this thesis demonstrates the versatility and robustness of the SAFSIM+ computer model developed to simulate the engine system.
Acknowledgements
This material is based upon work supported under a National Science Foundation Graduate Research Fellowship. Any opinions, findings, conclusions or recommendations expressed in this publication are those of the author and do not necessarily reflect the views of the National Science Foundation.
I would like to acknowledge the contributions of several key people who made this work possible: my thesis advisors, Prof. Jack Kerrebrock of the Department of Aeronautics and Astronautics and Prof. David Lanning of the Department of Nuclear Engineering, for providing assistance and guidance whenever asked; Mr. (soon to be Dr.) Jonathan Witter of MIT for diverting himself from his own nuclear propulsion work to answer many questions; Dr. Dean Dobranich of Sandia National Laboratories for assistance with his remarkable SAFSIM computer program; Capt. Jay Moody of the Air Force Space Nuclear Thermal Propulsion program, Kirtland AFB, NM, and the members of the MMII program, Grumman Electronic Systems Division, Bethpage, NY, for their support of my research.
Table of Contents
Abstract ...
Acknowledgements ...
List of Figures ...
List of Tables
...
Chapter 1 Introduction ...
1.1 Objective ... 1.2 Nuclear Thermal Propulsion ...1.2.1 Concept ... 1.2.2 History ...
1.2.3 Particle Bed Reactor ... 1.2.3.1 Concept ...
1.2.3.2 Basic Design ... 1.2.3.3 Technical Issues ... 1.3 Flow Instability ...
1.3.1 Description ...
1.3.2 Boundary Identification Methods . 1.3.2.1 M aise ... ... 1.3.2.2 W itter ... 1.3.2.3 Kerrebrock & Kalamas ... 1.3.3 Stability M ap ... 1.4 Organization of the Report ...
Chapter 2 Computer Model ...
2.1 General Requirements ... 2.2 System Analysis Flow SIMulator ...
2.2.1 Background ... ... 2.2.2 Physics Modules ...
2.2.2.1 Fluid Mechanics Module ....
2.2.2.2 Heat Transfer Module ... 2.2.2.3 Reactor Dynamics Module ..
2.2.3 Function Controlled Variables ....
2.2.4 Limitations . ... 2.3 Nuclear Thermal Propulsion SIMulator .
.o... 2 .10.... 3 .... ... . . 1 1
...
...
...
...
0 0oooooo oooooooooo 0 o 0oooooooo0 0 0oo 0o0oo0o000o0ooo 0ooao00oo0o00o0 ooo0
... 0 00.00 000.. . .. .. .. . .. .. . .. . . . . . . . °. .°..° ... . . . .. .o .. .. .. . .. . .. . .. ... . . . .. . . .. . . . ... . .. . . .. . . . ... . .. .... . .. ., .. • .. . . .. .. . .. ,., • .. . . . .. .. .. . . . . ... .. . .o. . . . , o . . . . . . . . . . . ° ° °.. . . . . . .°. ... . . . o . . . ... . . . .. . . . . . . . . . . . . . . . . . . . . .. . ... . . .o. . . o. .. . . . . . . . o. . . . .. . . . . . . . . . . . . . ... . .l .. . . . . . . . . . . . . . . . . . °. . . . . . . . . . . . . . . . . .
2.3.1 Background ...
Fluid Mechanics ... Turbopump Assembly Model 2.3.2.3 Reactor M odel ... 2.3.2.4 Control Laws ... 2.4 SAFSIM+ ... 2.4.1 Description ... 2.4.2 Model Coupling ... 2.4.3 Program Structure ... 2.4.4 Additional Information ...
Chapter 3 System Description ...
3.1 Engine System ... 3.1.1 Basic Design Parameters ... 3.1.2 Engine Cycle ...
3.1.2.1 Hot Bleed Cycle ... 3.1.2.2 Design State Points ... 3.1.2.3 Starter System ... 3.1.2.4 Fluid Properties ... 3.1.3 Turbopump Assembly ... 3.1.3.1 Pump Performance Maps ... 3.1.3.2 Turbine Performance ... 3.1.3.3 TPA Size ... ... 3.1.4 Engine Design Balance ... 3.1.4.1 Coolant Flow Rates ... 3.1.4.2 Flow Area Sizing ... 3.2 Reactor System ...
3.2.1 General Properties ... 3.2.2 Reactor Structure ...
3.2.2.1 Overview ...
3.2.2.2 Fuel Element ... 3.2.2.3 Moderator and Other Structures 3.2.3 Reactor Kinetics ... 3.2.3.1 Power Distribution ... 3.2.3.2 Point-Kinetics Parameters ... 5 ... 2 2 2.3.2.1 2.3.2.2 2.3.2 Program Elements ... 22 ... 2 3 ... 2 4 ... 2 4 ... 24 ... 2 4 ... 2 4 ... 2 5 ... 25 ... 26 ... 2 6 ... 2 6 ... 2 6 ... 26 ... 2 8 ... 2 9 ... 2 9 ... 3 0 ... 3 0 ... 3 1 ... 3 1 ... 3 1 ... 3 1 ... 3 2 ... 3 3 ... 3 3 ... 33 ... 3 3 ... 3 6 ... 3 7 ... 3 7 ... 3 7 ... 3 8
3.2.3.3 Decay Heat Groups ... 3.2.3.4 Reactivity Feedback ... 3.2.3.5 Control Drums ... 3.2.4 Steady-State Design ...
3.2.4.1 Mass Flow and Inlet Pressure ...
3.2.4.2 Main Nozzle and Bleed Valve ....
3.3 Engine Performance Summary ...
Chapter 4 Startup Controller Development
4.1 Control Framework ...
4.1.1 Startup Strategy Goal ... 4.1.2 Overall Engine Control ... 4.1.3 General Startup Framework ... 4.1.4 Neutronic Power Control ...
4.1.4.1 General Requirements ... 4.1.4.2 Implementation ... 4.1.5 Base Line Strategy ...
4.1.5.1 General Description ... 4.1.5.2 Reactor Power Control ... 4.1.5.3 Flow Control ... 4.1.5.4 Results ... ... 4.2 Strategy Development and Analysis ...
4.2.1 Focus of Improvements ... 4.2.2 Power/Flow Coordination ...
4.2.2.1 Objective ... 4.2.2.2 Implementation ... 4.2.2.3 Results ... ... 4.2.3 Turbine Flow Control ... 4.2.3.1 Objective ... 4.2.3.2 Implementation ... 4.2.3.3 Results ... ... 4.2.4 Turbine Inlet Temperature Control ...
4.2.4.1 Objective ... 4.2.4.2 Implementation ... 4.2.4.3 Results ... ... 4.2.5 Bleed Flow Control ...
6 ... 3 9 ... 3 9 ... ... 40 ... ... 40 ... ... 40 ... ... ... 41 ... 4 1
and Analysis ... 43
... 4 3 ... 4 3 ... 4 3 ... 4 4 ... 4 5 ... 4 5 ... 4 5 ... 4 6 ... 4 6 ... 4 6 ... 4 6 ... 4 7 ... 5 0 ... 5 0 ... 5 0 ... 5 0 ... 50 ... 5 1 ... 5 2 ... 5 2 ... 5 2 ... 5 3 ... 5 5 ... 5 5 ... 5 6 ... 5 6 ... .. 574.2.5.1 O bjective ... ... 57 4.2.5.2 Implementation ... 58 4.2.5.3 Results ... ... ... 58 4.2.6 Starter System ... 60 4.2.6.1 Objective ... 60 4.2.6.2 Implementation ... 60 4.2.6.3 Results ... ... 61 4.3 O ther Issues ... . 65
4.3.1 Sensitivity to TPA Inertia ... 65
4.3.2 Reactivity Feedback ... 65
4.3.2.1 Nominal Operation ... ... 65
4.3.2.2 Control Drums Inoperable ... 66
4.3.3 Controller Choice ... 68
4.3.3.1 General Factors ... 68
4.3.3.2 Engine Mission ... 68
4.3.3.3 Flow Stability ... 69
Chapter
5
Summary, Conclusions, and Recommendations ... 70
5.1 Summary ... 70
5.2 Conclusions ... 71
5.3 Recommendations ... 72
References ...
74
Appendix A Modifications to SAFSIM Program ...
78
Appendix B SAFSIM+ User's Manual ... ... 79
Appendix C Additional Results for Fast Bootstrap Start ... 99
List of Figures
Figure 1.1 Performance Advantage of Nuclear Thermal Propulsion Figure 1.2 Figure 1.3 Figure 3.1 Figure 3.2 Figure 3.3 Figure 3.4 Figure 3.5 Figure 3.6 Figure 3.7 Figure 3.8 Figure 3.9 Figure 4.1 Figure 4.2 Figure 4.3 Figure 4.4 Figure 4.5
PBR Fuel Element Design ... Flow Stability Boundaries ... ... Engine Cycle Schematic ... Pump Performance Maps ... ... Turbine Efficiency Map ... Single Element Reactor Model Schematic ... Reactor Finite Element Diagram ... Fuel Element Design ... Fuel Element Power Distribution ... Axial Power Distributions in Core ... Control Drum Worth ... Reactor Power and Coolant Flow for Base Line Strategy Chamber Conditions for Base Line Strategy ... TPA Speed for Base Line Strategy ... Stability Map for Base Line Strategy ... Cubic Power/Flow Coordination ...
Figure 4.6 Stability Map with Cubic Power/Flow Coordination
... 12 ... 14 ... 17 ... 27 ... 30 ... 31 ... 34 ... 35 ... 36 ... 38 ... 38 ... 41 ... 48 ... 48 ... 49 ... 49 ... 5 1 ... ... 51 Figure 4.7 Chamber Conditions with Cubic Power/Flow Coordination
Figure 4.8 Control Law for SCV Area vs. Chamber Pressure ... Figure 4.9 Chamber Conditions with SCV Control ... Figure 4.10 SCV Flow Area with SCV Control ... Figure 4.11 Turbine Inlet Temperature without TCV Control ...
Figure 4.12 Figure 4.13 Figure Figure Figure Figure Figure Figure Figure Figure Figure Figure Figure Figure' Figure'
Turbine Inlet Temperature with TCV Control ... Demanded Bleed Valve Area vs. Chamber Pressure . 4.14 Chamber Conditions for Fast Bootstrap Start .. 4.15 Stability Map for Fast Bootstrap Start ... 4.16 Starter Cartridge Burn Profile ... 4.17 TPA Speed with Starter System ... 4.18 Reactor Power and Flow with Starter System .. 4.19 Chamber Conditions with Starter System ... 4.20 Turbine Flow with Starter System ... 4.21 Stability Map with Starter System ... 4.22 Chamber Conditions for Larger TPA Inertia ... 4.23 Core Reactivity with Starter System ... 4.24 Core Reactivity with Control Drums Inoperable 4.25
4.26
Power and Chamber Temperature with Drums I Comparison of Total Impulse vs. Mass Flow ..
... 6 3 ... 64 ... 6 4 ... 6 5 ... 6 6 ... 6 7 noperable ... 68 ... 6 9
List of Tables
Table 1.1 Maximum Performance Achieved by NERVA Program ... 13
Table 3.1 Engine System Design State Points ... 28
Table 3.2 Engine Fluid Properties ... 30
Table 3.3 Design Point Coolant Flow Rates ... 32
Table 3.4 Element Design Flow Areas ... 33
Table 3.5 Power Deposition in Core ... 37
Table 3.6 Delayed Neutron Group Parameters ... 39
Table 3.7 Reactivity Feedback Terms ... 40
Table 3.8 Engine Design Parameters ... 42
Chapter 1 Introduction
1.1 Objective
The particle bed reactor (PBR) nuclear rocket engine concept is the focus of the United States Air Force's Space Nuclear Thermal Propulsion program. While much progress has been made in developing the concept, several technical issues remain. Perhaps foremost among these concerns is the issue of flow stability through the porous, heated bed of fuel particles. There are two complementary technical issues associated with this concern: the identification of the flow instability region and the design of the engine controller to maintain stable operation. The objective of this thesis is to study a portion of the latter issue which has yet to be addressed in detail. Specifically, it is to develop and analyze engine system startup strategies which maintain stable flow through the PBR fuel elements while reaching the design conditions as quickly as possible.
1.2 Nuclear Thermal Propulsion
1.2.1 Concept
Nuclear thermal propulsion (NTP) rocket systems differ from conventional chemical propulsion systems in that they utilize a nuclear reactor rather than a chemical reaction to provide the energy necessary to produce thrust. The reactor coolant fluid removes the thermal energy generated by the reactor and serves as the propellant which is exhausted through the rocket nozzle. NTP systems can achieve significant performance advantages, measured in terms of specific impulse (Isp), over chemical propulsion systems. Specific impulse is defined as the ratio of engine thrust to propellant weight flow rate; the higher the engine specific impulse, the more fuel efficient the rocket system will be. This efficiency can translate into a lower initial vehicle mass for a given mission velocity increment (AV), or a greater possible AV for a given initial mass. The ideal specific impulse of a rocket system is related to the propellant chamber temperature and molecular mass according to: Isp oc -TFM. The most advanced chemical propulsion systems, using cryogenic oxygen and hydrogen, are limited in efficiency to about 475 sec IsP due to the requirement for relatively heavy, combustible propellants. NTP systems,
however, do not have this limit. Therefore, the preferred propellant for NTP systems is hydrogen, which has a very low molecular mass. The chamber temperature--which is actually the reactor coolant exit temperature--for solid-core NTP systems is limited to about 3000 K by the solid material properties. An NTP system using hydrogen at 3000 K has an ideal specific impulse of approximately 1000 sec. The performance advantage gained by this increase in efficiency is shown in Figure 1.1. The figure compares the payload fraction of ignition mass as a function of the mission AV requirement for an NTP system and both a cryogenic (liquid oxygen/liquid hydrogen) and hypergolic (nitrogen tetroxide/monomethyl hydrazine) chemical system. Included on the graph is the AV requirement for a typical low earth orbit (LEO) to geosynchronous equatorial orbit (GEO) orbital transfer vehicle (OTV) mission and the range of mission energies for which nuclear thermal propulsion is mission enabling. The calculations assume that the entire AV is provided by a single rocket stage.
Figure 1.1 Performance Advantage of Nuclear Thermal Propulsion [S-2]
TYPICAL
0.9
I LEOEO
01V -- NT/ckaM ENABUNG .1 0.0 0 20000 40000 60000 80000 100000 Delta V (ft/sec) 1.2.2 HistoryNuclear thermal propulsion was originally studied and developed through ground demonstration during the Nuclear Engine for Rocket Vehicle Applications (NERVA)
program from 1955 to 1972, at which point the program was phased out along with the Apollo program. The NERVA program designed, built, and tested several engine designs. Table 1.1 summarizes key performance parameters achieved during the program [K-2].
Table 1.1 Maximum Performance Achieved by NERVA Program
Power PHOEBUS-2A 4100 MW
Thrust PHOEBUS-2A 930 kN
Specific Impulse PEWEE 845 sec
Chamber Temperature PEWEE 2750 K
Total Time at Full Power NF-1 109 minutes
Number of Restarts XE 28
Recently, NTP rocket engines have received much renewed attention due to the greatly improved performance which they offer. NTP systems have been identified as a key technology for the Space Exploration Initiative since they can greatly reduce the trip time needed for a manned mission to Mars [S-1]. Nuclear propulsion systems have also been investigated as part of the Strategic Defense Initiative and by the Air Force for use as an upper stage for a launch vehicle, as an orbital transfer vehicle, and for various other missions.
1.2.3 Particle Bed Reactor 1.2.3.1 Concept
The particle bed reactor is a new reactor concept originated by Brookhaven National Laboratory [P-2]. This reactor is the focus of the Air Force's Space Nuclear Thermal Propulsion program. Unlike the NERVA reactors, in which the propellant flowed axially through coolant passages in long, hexagonal fuel elements, the propellant in the PBR
flows radially through a porous bed of small (-500 i) fuel particles. This configuration increases the surface area available for heat transfer from the fuel to the hydrogen coolant, thus increasing both the maximum possible coolant temperature and the maximum possible reactor power density. The PBR has a nominal fuel volume power density of about 40 GW/m' compared to a maximum of only 5.2 GW/m' for the NERVA reactors. The high power density greatly reduces the size of the PBR engine compared to the relatively large and heavy NERVA engines, which leads to a higher engine thrust-to-weight ratio. This advantage makes the PBR concept particularly attractive to the Air Force, especially for small, high-energy missions.
Figure 1.2 PBR Fuel Element Design [B-2]
NLET
PLATE ARTCLE
PLATE
OUTLET PLENUN
1.2.3.2 Basic Design
The PBR core consists of multiple fuel elements (the number is dependent on the desired power level or thrust) arranged in an hexagonal pattern. The fuel elements are embedded in a moderator and contained within a pressure vessel. Each fuel element is annular in shape, and may be tapered axially. The bed of fuel particles is contained between two
porous frits. The hydrogen coolant enters the inlet plenum from the moderator cooling passages and then flows radially through the cold frit, the packed bed of fuel particles, and the hot frit. The hot coolant then turns and flows down the outlet plenum to a chamber where the flows from each element are mixed and then exhausted through a rocket nozzle. Figure 1.2 shows a representative fuel element design.
1.2.3.3 Technical Issues
Much progress has been made in developing the PBR concept, including work on reactor physics, fuel fabrication, and testing of individual fuel elements. However, some technical issues remain to be resolved in the continuing development of this novel reactor concept. Perhaps foremost among these concerns is the issue of flow instability through the porous, heated bed of fuel particles.
1.3 Flow Instability
1.3.1 Description
The possibility for flow instability in a PBR fuel element exists due to the multiple flow paths which the coolant may take once it enters the porous, heated bed of fuel particles.
The mechanism for the instability can be outlined as follows [M-1,W-3]:
a) multiple flow paths through a heated medium are connected at plenum regions with fixed inlet pressure and temperature and fixed outlet pressure;
b) a perturbation in one flow path causes the temperature to rise, thus increasing the fluid viscosity and reducing the fluid density;
c) since the pressure drop is fixed by the plena, the mass flow in this path will decrease;
d) the reduction in mass flow will result in a higher fluid temperature in this flow path, assuming the heat generation remains constant;
e) this process could continue until the temperature exceeds failure limits for the fuel element.
The location of the flow stability boundary for a particular fuel element geometry has not yet been well established, but experimental, analytical and numerical analyses are
currently being conducted at MIT and other organizations. In addition, the exact nature of the instability is not yet fully understood. However, Lawrence [L-1 ] has shown that an instability appears to exist near the regions predicted by several different analyses.
1.3.2 Boundary Identification Methods 1.3.2.1 Maise
The method used by Maise [M-1] to identify the flow instability regime is an adaptation of the well-known Bussard and DeLauer parallel channel analysis [B-4]. This method assumes simple relations for hydrogen properties as a function of temperature, and assumes that the multiple flow paths are one-dimensional parallel channels. The Ergun relation is used to calculate the pressure drop through the packed bed of fuel particles. The neutral stability criterion is defined as the minimum point of pressure drop as a function of coolant flow rate for a particular fuel element power density. The locus of these minima over the range of possible power densities then forms the neutral stability line which separates the stable and unstable flow regimes.
1.3.2.2 Witter
Witter [W-3] uses a method and criterion similar to that of Maise, but uses more accurate hydrogen property data and actual fuel element dimensions. The hydrogen properties are based on National Bureau of Standards properties for para-hydrogen. Witter also uses the Ergun relation, but calculates the pressure drop by numerically integrating the applicable equations over the thickness of the fuel bed.
1.3.2.3 Kerrebrock & Kalamas
Kerrebrock and Kalamas [K-l] use a completely different method than those of Maise and Witter. This method is based on the three-dimensional momentum and energy equations for the coolant using approximate relations for the hydrogen properties as a function of temperature. The effect of conductivity within the bed is also included in the analysis. To simplify the calculations, they assume a planar rather than a cylindrical
geometry. Kerrebrock and Kalamas use a stability criterion based on the growth or decay of harmonic perturbations introduced into the bed.
1.3.3 Stability Map
The stability boundaries calculated by the methods of Maise, Witter, and Kerrebrock and Kalamas are shown in Figure 1.3. The plotted curves show the element temperature rise
T -T
ratio, = Tout- Tin, as a function of the superficial Reynolds number at the bed inlet
Tin
which results in nuetrally stable flow. The superficial Reynolds number is defined as: Re = where rh is the fluid flow rate, d is the fuel particle diameter, A is the total cross-sectional flow area (particles and voids), and t is the fluid viscosity. The region above each curve represents the operating regime where the possibility for flow instability exists.
Figure 1.3 Flow Stability Boundaries 100.0 - 50.0-25.0 - _.. S- Maise 10.0- , ... Witter S.. ... Kerrebrock
06o & Kalamas
5.0-2.5
1.0
0.1 1.0 10.0 100.0 1000.0
Superficial Reynolds Number
While the curves are somewhat different based on the differing methodologies, they show that flow instability can be expected during low flow but high temperature operation. The analysis of Kerrebrock and Kalamas predicts that the stability is actually enhanced at
Reynolds numbers below approximately 17; this effect is due to the conductivity in the bed region which tends to dissipate heat, thus abating the growth of hot spots in the bed. Low flow but high temperature operation may be expected during startup or shutdown of the engine system; this possibility requires that proper control strategies be developed to ensure that the flow through the fuel elements is maintained in the stable flow regime. It should be noted at this point that a more precise understanding of the instability phenomenon and more accurate modeling will be needed to further refine the location of the instability region. In addition, the flow characteristics which determine stability are dependent on the coolant distribution and the heat generation in each element, which may vary significantly among the fuel elements in the reactor core and may also vary over the operating life of the engine.
1.4 Organization of the Report
This report is divided into five (5) chapters. Chapter 1 has been an introduction, providing the necessary background information on nuclear thermal propulsion, the particle bed reactor, and the issue of flow instability in PBR fuel elements. Chapter 2 describes the computer model used to simulate the particle bed reactor engine system. Additional information on the computer model is presented in Appendices A and B. Chapter 3 provides a description of the nominal PBR engine system model used for this study. Chapter 4 describes the general control framework for the system and the development of the engine system startup strategies, and analyzes the performance of these strategies based on the simulation results. Additional results of the simulations are provided in Appendices C and D. Chapter 5 summarizes the findings of this thesis, draws appropriate conclusions, and makes several recommendations based on the results of this work.
Chapter 2 Computer Model
2.1 General Requirements
The development and analysis of the startup strategies for this thesis were conducted using computer modeling and simulation of a nominal particle bed reactor engine system. In order to accomplish the objective, a simulation and modeling code was needed which captures the key aspects of the system--that is, those aspects which most affect the dynamic response of the system during startup. The general requirements for the system model were determined to be the ability to:
a) model transient thermal hydraulics, heat transfer and reactor dynamics for the particle bed reactor;
b) model the transient response of remaining engine system components such as the turbopump assembly, flow control valves, nozzles, and an external starter system;
c) implement user-defined reactor power control laws; d) implement user-defined flow control laws.
In addition, it was desired that the simulation code allow for relative ease in modifying the system model and control algorithms.
2.2 System Analysis Flow SIMulator
2.2.1 Background
The System Analysis Flow SIMulator (SAFSIM) program is a FORTRAN program developed at Sandia National Laboratories [D-l]. This program was developed to simulate the integrated performance of systems involving fluid mechanics, heat transfer, and reactor dynamics. Because of its suitability for modeling nuclear thermal propulsion systems which necessarily include all three of these phenomena, the SAFSIM code has been chosen by the NASA/DOE/DOD interagency team as the base computational engine for an NTP system model [W-2]. The fluid mechanics and heat transfer portions of the SAFSIM program have been successfully benchmarked to NERVA NRX/EST test data [L-2].
2.2.2 Physics Modules
The SAFSIM computer program contains three basic physics modules: fluid mechanics, heat transfer, and reactor dynamics. Each module solution is advanced individually, but all are coupled at each system timestep via convection, heat generation and reactivity feedback effects. The parameters of each module can be fully specified by the user through the SAFSIM input file.
2.2.2.1 Fluid Mechanics Module
The fluid mechanics module uses a one-dimensional finite-element solution method. It solves the quasi-steady, compressible thermal and mechanical energy equations using: combined momentum and mass continuity; advection, conduction, and convection within the fluid; and an extensive library of pressure drop and heat transfer coefficient correlations. The basic finite-element is described by the inlet, outlet, and average flow areas, the flow length, the hydraulic diameter, and the pressure drop correlation. In addition to this basic finite element, special elements exist which model: a porous media element using either the Ergun or Achenbach correlation; a distributed flow element which allows flow to enter or exit along its length rather than only at the ends; a compressor/pump element using characteristic pump maps; and a choked-flow element based on compressible, isentropic flow. The fluid properties are specified by the user using either functional relations or supplied databases. The hydrogen properties chosen were National Bureau of Standards properties for para-hydrogen [W-l]. These data provided the most accurate data over the wide temperature range encountered during startup of the engine system. However, since the SAFSIM program uses pressure and temperature as the inputs to the fluid properties routine, there is no possibility of simulating two-phase flow; even a homogeneous equilibrium model is not possible. This places a limit on the minimum fluid temperature which can be modeled.
2.2.2.2 Heat Transfer Module
The heat transfer module uses a one-dimensional finite element solution. It allows for the specification of the element geometry and multiple heat exchange surfaces for both
convective and radiative coupling of the heat transfer solution to the fluid mechanics solution. The heat generation rate in the elements can also be specified, and can be a function of the 'reactor power in order to couple the solution to the reactor dynamics module. The finite-element material properties including specific heat and conductivity are user-defined, and can be functions of temperature.
2.2.2.3 Reactor Dynamics Module
The reactor dynamics module uses a point-kinetics solution to model the reactor neutronic power dynamics. Reactivity feedback terms can be specified as any function of any variables calculated by either the fluid mechanics or heat transfer modules, allowing the reactor dynamics solution to be coupled to the other solutions. Any number of delayed neutron groups and decay heat groups can be specified, including the effective fractions, time constants, and initial concentrations for each group. The reactor control law is user supplied and can be modified as required.
2.2.3 Function Controlled Variables
The SAFSIM program includes the capability for function controlled variables, which allows almost any model parameter to be specified as a function of any other model parameters or variables. This very powerful feature allows, for example, the implementation of flow control laws by varying an element flow area based on a node pressure. In addition to a library of available functions, user-defined functions can also be implemented. The importance of this feature will be discussed in section 2.4.
2.2.4 Limitations
There are two limitations to the current version of the SAFSIM program which restrict its usefulness for modeling entire particle bed reactor engine systems during startup. The first limitation is the quasi-steady-state solution used for modeling the fluid mechanics of the system. This makes it difficult, but not impossible, to model components such as an external starter system whose performance is heavily dependent on mass accumulation and pressure buildup in the main system. The second limitation is the lack of a turbine or
integrated turbopump assembly (TPA) element. The performance of the TPA is key during startup since it controls the coolant flow through the entire system. This limitation is more severe than the first and necessitates the augmentation of the SAFSIM program with a model capable of simulating the TPA performance.
2.3 Nuclear Thermal Propulsion SIMulator
2.3.1 Background
The Nuclear Thermal Propulsion SIMulator (NTPSIM) is a FORTRAN computer program developed by the author by modifying the ENGine SIMulator (ENGSIM) code previously used at Grumman Electronic Systems Division to model the performance of NTP systems. The modifications include modularization of the code and improvement of certain element modules. The modularization enables the code to model many different engine cycles rather than the particular cycle for which ENGSIM was developed. Improvements to the element modules include a more realistic formulation for the coolant temperature rise within the reactor core, the addition of a more complete neutronic power controller, correction of a few small errors, and conversion to metric units. In addition, a variable step size, stiff-equation integration package was added to replace the fixed step size Runge-Kutta integrator.
2.3.2 Program Elements 2.3.2.1 Fluid Mechanics
The NTPSIM program consists primarily of a simplified dynamic flow simulator which includes the mass accumulation term due to unsteady flow. The framework for the fluid mechanics solution is essentially a series of alternating 'resistor' and 'capacitor' finite elements. The resistor elements include orifices, valves and check valves; capacitor elements include tanks, ducts, flow splitters, and flow mixers. In addition, a turbopump assembly model and a reactor model (discussed below) are included. The system model to be studied can be constructed using any combination of the above elements. The resistor elements determine the mass flow into and out of the adjacent capacitor elements based on the pressure difference between the two elements and the effective flow area of
the resistor element; the governing equations are based on compressible flow through orifices. Capacitor elements calculate the time rate of change of pressure and pressure divided by temperature in the element due to mass accumulation and heat transfer into the element; the governing equations are based on conservation of energy and use ideal gas law relations. Multiple fluids can be specified at different points within the system; ideal gas properties are used for each fluid.
2.3.2.2 Turbopump Assembly Model
The turbopump assembly model includes a coupled pump model and turbine model. The pump performance is based on similarity maps for the pump pressure rise and the
AP/N2 SHP/N3 required pumping power. The maps provide relations for AP/N2 and SHP as
IAPIN
2 ID lSHP/N31DQ/N
known functions of , where N is the TPA speed, AP is the pump pressure rise,
IQINID'
SHP is the required shaft power, Q is the pump volume flow rate, and D signifies the pump design point conditions. These maps allow the pump pressure rise and required shaft power to be calculated from the pump flow rate and the TPA speed without modeling the complex fluid mechanics within the pump. The pump flow rate is determined by assuming quasi-steady flow through the pump and pump discharge valve such that the pump pressure rise for the given flow and TPA speed is consistent with the driving pressure necessary to produce the same mass flow through the pump discharge valve. The power generated by the turbine is determined using isentropic expansion relations to calculate the ideal temperature change, and hence enthalpy change, across the turbine. This change is then modified appropriately using a turbine efficiency versus flow rate map. The efficiency map relates to the normalized spouting ratio, U/C where rl is the turbine efficiency, U is the turbine blade tip speed, C is the mach velocity at the turbine inlet, and D denotes the design conditions. The difference between the turbine power output and the required pumping power is the power available to accelerate the TPA. In this manner, the dynamic response of the TPA can be effectively simulated.
2.3.2.3 Reactor Model
The reactor model used by the NTPSIM code is a very simplistic lumped fluid mechanics and heat transfer model, with a single finite element for the moderator and a single element for the fuel section. The reactor dynamics solution uses point-kinetics. Because of this simplicity, the NTPSIM code was deemed inappropriate for modeling the complex fluid mechanics and heat transfer phenomena present in a particle bed reactor core.
2.3.2.4 Control Laws
The NTPSIM program includes a user-defined subroutine for specifying control laws for any variable in the system model. Typically, this feature would be used to specify the demanded flow area for system valves in order to simulate flow control algorithms.
2.4 SAFSIM+
2.4.1 Description
The SAFSIM+ program was developed by the author and is designed to incorporate the best features of both the SAFSIM program and the NTPSIM program since neither was deemed capable of individually simulating all the key features of a particle bed reactor engine system during startup. The SAFSIM+ program maintains all portions of the SAFSIM code and links it with the NTPSIM code, excluding the reactor model. This augmented version of the SAFSIM code is capable of modeling both the coupled fluid mechanics, heat transfer, and reactor dynamics within the PBR core and the dynamic response of the remainder of the engine system including the turbopump assembly and starter system.
2.4.2 Model Coupling
The two portions of the SAFSIM+ model are coupled at the boundaries of the reactor model. The extent of the reactor portion of the model is arbitrary, but should include as much of the system as possible since the fluid mechanics, fluid property, and heat transfer models of the SAFSIM program are more accurate than those of the NTPSIM model. At each system time step, the SAFSIM reactor model calculates the coolant flow rate
through the reactor and the coolant outlet temperature based on the inlet temperature and the inlet and outlet pressure boundary conditions imposed on the reactor. The NTPSIM portion of the model then uses the reactor coolant flow rate and exit temperature to update the pressure and temperature at the boundary elements.
2.4.3 Program Structure
The linkage of the NTPSIM code into the SAFSIM code to create the SAFSIM+ program was accomplished via the function controlled variable (FCV) and user-defined function capabilities built into the SAFSIM program. The inlet and outlet boundary conditions for the reactor portion of the model are specified as FCVs for the system; these variables are updated at each system time step using user-defined functions. The user-defined function structure includes the specification of inputs to the functions; the reactor coolant flow rates and exit temperature required by the NTPSIM code are identified in this manner. A subroutine is provided with the SAFSIM code for specification of the user-defined functions. To create the SAFSIM+ program, this subroutine includes the logic for calling the NTPSIM variable step size integration routine and transferring the data between the NTPSIM and SAFSIM portions of the program using additional common blocks. The remaining NTPSIM subroutines are then simply linked with the SAFSIM subroutines using a FORTRAN compiler and linker. The input data for the NTPSIM portion of the engine system model is incorporated into the SAFSIM+ program using the User-Defined Input block of the standard SAFSIM input file.
2.4.4 Additional Information
Additional information on the SAFSIM+ program is included in Appendices A and B. Appendix A contains a record of slight modifications to the SAFSIM code necessary to implement the SAFSIM+ program and model the PBR engine system. These changes do not include substantive changes to the physics modules or solution methods. Appendix B contains a User's Manual for the SAFSIM+ program.
Chapter 3 System Description
3.1 Engine System
3.1.1 Basic Design Parameters
The engine studies in this thesis are conducted for a representative particle bed reactor nuclear thermal propulsion engine system. The engine is designed for a nominal orbital transfer vehicle mission requiring approximately 100 kN thrust. Hydrogen is chosen for the propellant, with a design operating condition of 7.0 MPa and 3000 K just upstream of the main rocket nozzle; this point in the system will be referred to as the 'chamber' for consistency with chemical rocket propulsion technology which uses the term 'combustion chamber'. This system requires a 500 MW reactor to achieve the desired thrust level.
3.1.2 Engine Cycle 3.1.2.1 Hot Bleed Cycle
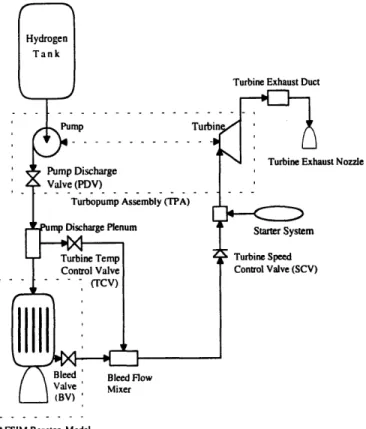
A hot bleed cycle is chosen for the orbital transfer vehicle mission since most PBR studies have focused on this engine cycle. Expander cycles are generally not desirable for PBR applications since they require complicated flow paths to extract the energy necessary to drive the turbopump assembly. A schematic diagram of the hot bleed cycle is shown in Figure 3.1. The cycle uses a mixture of hot gas bled from the chamber and cold gas (actually supercritical fluid) from the pump discharge plenum to drive the TPA. The system includes a carbon-carbon composite main rocket nozzle so that regenerative cooling of the nozzle is not necessary.
The engine system model, as shown in Figure 3.1, is simplified to include only those portions of an actual engine system which are most likely to affect the system response during startup. The coolant/propellant is stored at constant pressure and temperature in the hydrogen tank. The hydrogen pressure is then increased by the pump side of the TPA; flow through the pump is controlled by the pump discharge valve (PDV). The coolant then enters the pump discharge plenum where it is split into two flow paths. The main coolant flow enters the reactor and is heated in the moderator and fuel sections. The
majority of this flow is exhausted through the main rocket nozzle, providing the primary thrust for the system. The remainder of the flow from the pump discharge plenum is combined with bleed flow from the chamber in a mixing region. The amount of cold flow from the pump discharge plenum is controlled by the turbine temperature control valve (TCV); the hot bleed flow from the reactor is controlled by the bleed valve (BV). The combined flow then passes through the turbine speed control valve (SCV) and enters a small mixing region; this region also accepts flow from an external starter system. In order to prevent starter gases from entering the reactor, a check valve is included at the SCV location. The combined flow in this mixing region then expands through the turbine, creating shaft power to turn the TPA. Gas from the turbine collects in the turbine exhaust duct and is then expelled through the turbine exhaust nozzle, creating a small amount of thrust.
Figure 3.1 Engine Cycle Schematic
Hydrogen Tank
Turbine Exhaust Duct
Pump Turbi
Turbine Exhaust Nozzle
Turbopump Assembly (TPA)
Starter System
Turbine Speed
Control Valve (SCV)
-- - -- (TCV)
Bleed Bleed Flow
Valve Mixer
(BV) '
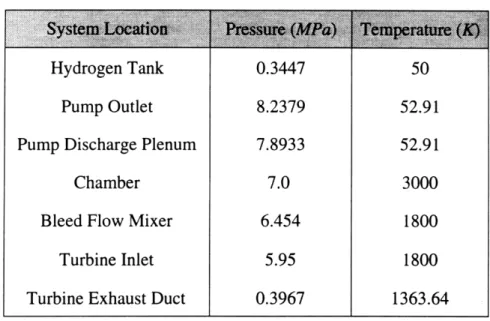
3.1.2.2 Design State Points
Table 3.1 provides the chosen design state points at different locations throughout the engine system.
Table 3.1 Engine System Design State Points
Hydrogen Tank 0.3447 50
Pump Outlet 8.2379 52.91
Pump Discharge Plenum 7.8933 52.91
Chamber 7.0 3000
Bleed Flow Mixer 6.454 1800
Turbine Inlet 5.95 1800
Turbine Exhaust Duct 0.3967 1363.64
The hydrogen tank temperature for the model was chosen to be 50 K even though the tank temperature for an actual engine is likely to be about 25 K in order to maintain the hydrogen propellant in a liquid state. This change was made for two reasons associated with the limits of the SAFSIM program. First, as previously mentioned, the SAFSIM program has no mechanism for simulating two-phase fluid flow, which does occur for temperatures in the range of 25-50 K at low pressures. Second, even when single-phase conditions exist in the 25-50 K range, the fluid properties may change very rapidly as a function of temperature. In this regime of very sharp negative slopes for some fluid properties, it was found that the SAFSIM solution method had difficulty converging. By initially starting the hydrogen at 50 K, these difficulties are averted. Although this change will have a slight effect on system performance (e.g. pressure drops through the core may be slightly different), it is not expected to affect the nature of the overall system startup response.
The pump discharge plenum pressure is based on the design point pressure drop through the reactor core; this is discussed in more detail in section 3.2.4. The pump outlet pressure is calculated from the pump discharge plenum pressure and the pressure drop through the pump discharge valve; the pressure drop is designed to equal the tank pressure so that the required pump pressure rise is equal to the reactor inlet pressure. The temperature rise between the tank and pump outlet is due to the pump efficiency. The design turbine inlet temperature is assumed to be 1800 K, which also sets the bleed flow mixer temperature. No heat loss is modeled over the length of piping between the bleed flow mixer and the turbine, although such losses are expected in an actual engine system. The bleed flow mixer and turbine inlet pressures are chosen to be 92.2% and 85% of the chamber pressure, respectively. The turbine exhaust pressure is based on a 15:1 expansion ratio turbine; the turbine exhaust temperature is calculated from the turbine expansion ratio and the turbine efficiency.
3.1.2.3 Starter System
The engine model includes an external starter system located just upstream of the turbine inlet. This system may be used to initially accelerate the TPA before substantial bleed flow is available from the chamber. Such a system typically consists of a small solid rocket motor which exhausts its propellant into the turbine inlet. This system is modeled as a tank with fixed pressure and temperature and an adjustable check valve. The pressure and valve flow area can be adjusted to simulate a particular solid rocket motor system. The valve flow area can be changed as a function of time to simulate a system with a non-constant mass flow rate; the valve area is set equal to zero for all times after burnup of the solid rocket motor. If an engine system without a starter system is desired, the valve flow area can simply be set to zero so that the same engine model can be used.
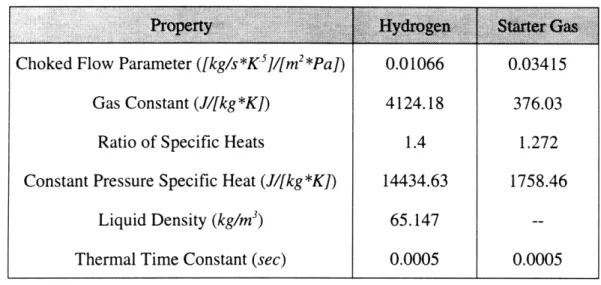
3.1.2.4 Fluid Properties
The NTPSIM portion of the SAFSIM+ computer model used to simulate the engine system uses ideal gas properties for each fluid type as discussed in Chapter 2. Table 3.2 lists the fluid properties used for both the hydrogen coolant [G-2] and the starter system
exhaust gas [T-l]. Note that the fluid density provided is the liquid density and is only used by the pump model.
Table 3.2 Engine Fluid Properties
Property' Hydrogeni Starer Gas
Choked Flow Parameter ([kg/s*K5]/[m2*Pa]) 0.01066 0.03415
Gas Constant (J/[kg*K]) 4124.18 376.03
Ratio of Specific Heats 1.4 1.272
Constant Pressure Specific Heat (J/[kg*K]) 14434.63 1758.46
Liquid Density (kg/m') 65.147
--Thermal Time Constant (sec) 0.0005 0.0005
3.1.3 Turbopump Assembly 3.1.3.1 Pump Performance Maps
The coolant pump performance is based on similarity maps which define the normalized pump pressure rise and normalized shaft power as a function of normalized pump flow as described in paragraph 2.3.2.2. Figure 3.2 shows the performance maps used for the nominal engine cycle model [G-l]. The design pump efficiency is assumed to be 75%.
Figure 3.2 Pump Performance Maps
1.5 (AP/N^2) (SHP/N^3). 1.0 (SHP3esig 0.5 0.0 0.0 0.5 1.0 1.5 2.0 (Q/N) / (Q/N)desiqn
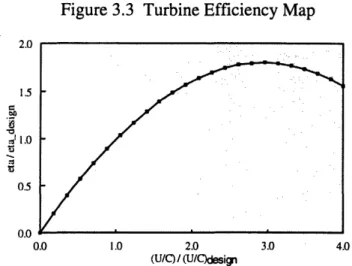
3.1.3.2 Turbine Performance
The turbine performance is determined as described in paragraph 2.3.2.2. Figure 3.3 shows the modeled turbine efficiency as a function of the normalized spouting ratio [G-l]. The design turbine efficiency is 45%.
Figure 3.3 Turbine Efficiency Map 2.0 1.5 S1.0 0.5 0.0 0.0 1.0 2.0 3.0 4.0 (U/C) / (U/Ckesign 3.1.3.3 TPA Size
The TPA size is extrapolated from a high temperature turbopump assembly designed by Garrett Fluid Systems Division [0-1]. Only a single turbine stage is modeled, with a diameter of 0.18 m. The design TPA speed is 55600 rpm. The mass of the rotating portions of the TPA is estimated to be 10 kg. Based on this mass, and assuming that the radius of gyration is half the turbine radius, the TPA polar moment of inertia was estimated to be 0.010125 kg*m2. The system performance is relatively sensitive to the assumed value of the TPA inertia since this value determines how much energy is required to accelerate the TPA to its design speed. This effect will be quantified and discussed in more detail in section 4.3.1.
3.1.4 Engine Design Balance 3.1.4.1 Coolant Flow Rates
In order to achieve the desired steady-state design conditions, the engine system flow rates must be balanced to provide the proper driving flow to the turbine. There are three
conditions which must be satisfied at the design conditions to achieve the proper engine balance: (1) the required pumping power must equal the turbine power produced; (2) the hot bleed flow and cold bypass flow must be balanced to provide the desired turbine inlet temperature; and (3) the total pump flow must equal the flow through the reactor and the cold bypass flow. These conditions can be expressed as follows:
1) i px P E x -P = , x Cxi ,xT, x 1- P Rj
2) nt, x Tin = 2h X Th+ tnc x Tc
3) rhp = rlh, + c
The pump pressure rise, reactor flow rate, and hot bleed flow temperature are calculated based on the reactor steady-state design as described in section 3.2.4 below. The fluid properties, TPA efficiencies, turbine pressure ratio, and the cold flow and turbine inlet temperatures have been defined. The above equations can therefore be solved simultaneously to find the design coolant flow rates. Table 3.3 summarizes the calculated flow rates for each portion of the engine system.
Table 3.3 Design Point Coolant Flow Rates
LocationF/ Pump 9.86802 Turbine 0.253095 Reactor 9.766 Cold Bypass 0.10203 Hot Bleed 0.151065 Main Nozzle 9.61492
3.1.4.2 Flow Area Sizing
The design point flow areas for the flow restricting elements in the engine model are calculated based on the design mass flow rate through the element and the design
---pressure levels at the inlet and outlet (inlet only for choked flow elements) of the element. Table 3.4 summarizes the calculated flow areas for the engine model.
Table 3.4 Element Design Flow Areas
Pump Discharge Valve 1.9797e-3
Turbine Inlet 1.6930e-4
Turbine Exhaust Nozzle 2.2101e-3 Temperature Control Valve 1.1148e-5 Speed Control Valve 2.8248e-4
3.2 Reactor System
3.2.1 General Properties
The nuclear reactor model for the engine system is based on a representative particle bed reactor design. Since no complete PBR design has yet been published, the model used here is extrapolated from preliminary designs and the author's knowledge of particle bed reactor engines. The basic PBR design chosen is a 500 MW core consisting of 19 fuel elements. The elements are arranged in an hexagonal pattern with a center element surrounded by two rings of 6 and 12 elements, respectively. The fuel elements are embedded in a beryllium moderator and contained within a carbon-carbon composite pressure vessel. The SAFSIM reactor model also includes the main nozzle and the hot bleed valve.
3.2.2 Reactor Structure 3.2.2.1 Overview
For simplicity, only one of the 19 fuel elements and its associated coolant passages are modeled using the SAFSIM program. The reactor flow rate and the main nozzle and
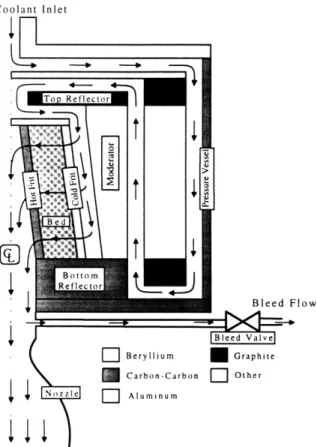
bleed valve flow areas are scaled by 1/19 to account for the fact that only a single element is modeled. When the reactor model is linked to the remainder of the engine system model, the flow rates calculated by SAFSIM are rescaled to the full reactor size to properly couple the solutions. The reactor model is described in cylindrical coordinates and assumes axial symmetry. A schematic diagram of the single fuel element reactor model is shown in Figure 3.4. The hydrogen coolant enters the top of the reactor and then flows downward cooling the pressure vessel. The flow then turns and flows upward through a coolant passage in the moderator. The flow next cools the top axial reflector and enters the top of the inlet plenum. The hydrogen is then distributed axially and flows radially through the cold frit, fuel bed, and hot frit. The hydrogen then enters the exit plenum and turns to flow into the chamber region. The majority of the flow is exhausted through the main nozzle while a small portion is bled off through the bleed valve to run the turbine.
Figure 3.4 Single Element Reactor Model Schematic
Coolant Inlet I1 Bleed Flow -l Beryllium Graphite Carbon-Carbon F Other r Aluminum
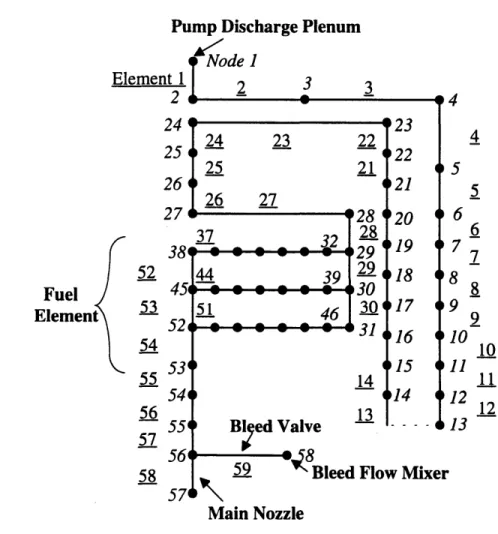
The SAFSIM reactor model contains 59 fluid mechanics finite elements connected at 58 nodes; the fuel element portion of the model includes 3 axial levels and 7 radial rings--i for each frit and 5 for the fuel bed. Figure 3.5 shows the finite element diagram for the model. The reactor inlet pressure and temperature boundary conditions are imposed at node 1 which corresponds to the pump discharge plenum. The reactor outlet pressure boundary condition is imposed at node 58 which represents the bleed mixer. The choked flow element which models the main nozzle provides the final boundary condition for the SAFSIM portion of the model. The parameters which are used in the NTPSIM portion of the solution are the total reactor flow rate (measured at element 1), the bleed flow rate (element 59), and the bleed flow temperature (node 58).
Figure 3.5 Reactor Finite Element Diagram Pump Discharge Plenum
Node I Element 1 2 3 2 - -24 25 24 23 25 26 2126 27 27 32 Fuel Element 52 53 54 55 56 57 58 22 21 8 3732 28 38 29 44 39 29 45 30 51 46 30 52 . .. :z i 53 54 554 56 57 123 '22 021 '20 '19 018 o17 '16 14 14 Bleed Valve 13
59 Bleed Flow Mixer Main Nozzle 5 6 7 8 9 10 11 12 M J1(
Figure 3.6 Fuel Element Design 3.6 3.3 3.0 2.0 1.75
Hot Frit Inlet Plenum
Cold Frit 60 B 2.2922 F e. ... 2.54 3.54 3.84 4.14
Notes: (1) all dimensions in cm (2) radial dimensions drawn
approximately to scale
3.2.2.2 Fuel Element
The fuel element consists of the cold frit, fuel bed, and hot frit. Figure 3.6 shows the fuel element design including appropriate dimensions. The overall element size was chosen to achieve a 25.2 GW/m3 bed averaged power density, which, for a 37% bed porosity, corresponds to a 40 GW/m' fuel volume power density. This power density was chosen based on preliminary PBR engine designs [L-3]. The fuel length and taper was chosen to ensure outlet plenum velocities less than about Mach 0.2. The bed pressure drop is calculated using the Ergun correlation and the heat transfer is modeled using the Achenbach correlation. The fuel particles are assumed to have a diameter of 500 g. The bed porosity for the innermost and outermost rings was modeled as 37.8% and 37.2%, respectively, rather than the 37% used for the middle three rings, to account for increased voidage next to the frits. The cold frit is modeled using aluminum with a 35% porosity. The pressure drop is calculated using the Ergun correlation for the friction factor plus fixed loss coefficients to simulate the engineered pressure drop of the cold frit design.
--The loss coefficients are varied over the three axial levels to achieve relatively uniform bed outlet temperatures. The hot frit is modeled as carbon-carbon; the pressure drop is calculated using a friction factor based on an equivalent diameter of 250 g.
3.2.2.3 Moderator and Other Structures
The moderator model includes the approximate volume of beryllium associated with each of the 19 fuel elements for a centerline-to-centerline pitch of 11 cm. The moderator is cooled by hydrogen flow between the elements and in the fuel element inlet plenum. Other structures modeled in the reactor core include the carbon-carbon pressure vessel and the top and bottom graphite axial reflectors. Each of these structures is cooled by hydrogen flow.
3.2.3 Reactor Kinetics 3.2.3.1 Power Distribution
The reactor thermal power is assumed to be deposited in the fuel element as well as the moderator, axial reflectors, and pressure vessel. Table 3.5 shows the percentage of power deposited in each structure.
Table 3.5 Power Deposition in Core
Fuel Element 95.0
Moderator 3.5
Reflectors 0.5
Pressure Vessel 1.0
The heat generation in the fuel element has an exponential radial distribution as shown in Figure 3.7 [D-3]; there is no axial power variation modeled. The reflectors, moderator, and pressure vessel have axial power distributions as shown in Figure 3.8 [D-3]; no radial distribution is modeled. The bottom reflector power distribution is the mirror image of
the top reflector power distribution. The power profiles are modeled based on an average fuel assembly.
Figure 3.7 Fuel Element Power Distribution
1.0 2.0 3.0
Rndinl Ditnn-n. (em)
Figure 3.8 Axial Power Distributions in Core
Relative Power OD 02 0.4 Of, 0 1D 12 OD V Moderator 01 0. Ob 07 Relative Power 00 02 OA 06 0 ID 1.2 Relative Power 00 02 OA 06 01 ID 3.2.3.2 Point-Kinetics Parameters
The reactor dynamics for the PBR model are calculated using point-kinetics. The prompt neutron lifetime is 33.3.10-6 sec and the effective delayed neutron fraction is 0.0079 based on measurements conducted by Ball, et. al. [B-l]. The delayed neutron fraction is divided into 15 delayed neutron groups, including 9 photoneutron groups due to the
1.0 0.8 0.6 0.4 0.2 0.0 __ II ac;
beryllium moderator. Table 3.6 summarizes the effective neutron fractions, Pi, and the effective decay constants, ,1, for each group.
Table 3.6 Delayed Neutron Group Parameters
0.000256 0.00169 0.001513 0.003049 0.000888 0.00325 6.7659-10-7 4.5106.10-7 0.0124 0.0305 0.111 0.301 1.14 3.01 6.24.10-7 2.48.10-6 3.0862-10-6 3.7984.10-' 4.2732.10-6 4.3681.10-5 2.1960.10-4.3444.10-' 2.4571.10-' 1.59.10-6.20.10-5 0.000267 0.000742 0.0036 0.00885 0.0226
3.2.3.3 Decay Heat Groups
Although the SAFSIM program includes the capability to model fission product decay heat generation, no decay heat groups are modeled. This is due to the very short time frame associated with the reactor startup. As will be shown in Chapter 4, the time scale for system startup is on the order of 10 sec, which does not allow enough time for significant buildup of decay heat precursors.
3.2.3.4 Reactivity Feedback
The reactor model includes the effects of six reactivity feedback terms. These are: doppler effect (ApF) and bed expansion (APBE) based on the average fuel temperature; hot frit expansion (APHF) based on the average hot frit temperature; coolant density (Ap and ApOp) based on the average inlet plenum and outlet plenum coolant densities,
-respectively; and moderator temperature (Ap,) based on the average moderator temperature. Table 3.7 shows the equations used for each feedback term [D-2].
Table 3.7 Reactivity Feedback Terms
Ap F = -2.7 - 10-5 x ATfue Tfuel APBE = 2.24 -10-7 x ATfuel APHF = 7.0. 10-8 x ATHF Ap lP = 1.204. 10-3 x Adlp Ap OP = 7.0. 10- 4 x Ado ApM = (-9.76 - 10-5 +4.4398 - 10-8 x TM+... 1 1 0.040958 x + 1.17507 x )x ATM TM T 2 3.2.3.5 Control Drums
The mechanisms used to control the reactor reactivity are rotating control drums located in the reflector region. As the drums rotate, they expose varying amounts of a neutron poison material which increases neutron absorption in the reflector region and reduces the core reactivity. The drum reactivity worth has a span of 0.0470 or $5.95 with a sinusoidal variation as shown in Figure 3.9. The initial critical state is assumed to occur with the control drums at 900 at an idling power of 5.0 kW. The drum rotation rate is limited to 1800 per second.
3.2.4 Steady-State Design
3.2.4.1 Mass Flow and Inlet Pressure
The design point reactor coolant flow rate was determined using the SAFSIM program by imposing a mass flow and temperature boundary condition at the reactor inlet and a pressure boundary condition at the reactor chamber. The inlet temperature was set to 52.91 K and the chamber pressure was set to 7.0 MPa. The mass flow rate was then varied until a chamber temperature within a few degrees of 3000 K was achieved. The
coolant flow rate was found to be 0.514 kg/sec for the single element modeled; this value was multiplied by 19 fuel elements to give the 9.766 kg/sec flow rate shown in Table 3.3. The required inlet pressure to achieve this flow rate, as calculated by SAFSIM, was 7.8933 MPa.
Figure 3.9 Control Drum Worth 4 3 2 0 -2 --3 -4 0 15 30 45 60 75 90 105 120 135 150 165 180
Drum Angle (degrees)
3.2.4.2 Main Nozzle and Bleed Valve
The main nozzle was sized by modeling only the chamber and nozzle in SAFSIM. The chamber pressure and temperature were imposed as boundary conditions, and the flow area of the nozzle was varied until the required mass flow rate (9.61492 / 19 = 0.50605 kg/sec) was achieved. The bleed valve was sized by modeling only the chamber, nozzle and bleed valve. The reactor pressure and temperature, and the nozzle and bleed valve flow rates were imposed as boundary conditions. The bleed valve flow area was then varied until the desired bleed mixer pressure (6.454 MPa) was achieved. The temperature of the bleed flow entering the mixer was found to be 2980 K.
3.3 Engine Performance Summary
The engine thrust is calculated assuming a main nozzle expansion ratio of 50:1 and a turbine exhaust nozzle expansion ratio of 10:1. The thrust, based on isentropic nozzle flow, is 92.94 kN for the main nozzle and 1.38 kN for the turbine exhaust nozzle. The