HAL Id: hal-02333700
https://hal.archives-ouvertes.fr/hal-02333700
Submitted on 20 Nov 2020
HAL is a multi-disciplinary open access
archive for the deposit and dissemination of sci-entific research documents, whether they are pub-lished or not. The documents may come from teaching and research institutions in France or abroad, or from public or private research centers.
L’archive ouverte pluridisciplinaire HAL, est destinée au dépôt et à la diffusion de documents scientifiques de niveau recherche, publiés ou non, émanant des établissements d’enseignement et de recherche français ou étrangers, des laboratoires publics ou privés.
Revisiting fluorescein and layered double hydroxide
using a synergistic approach: A complete optical study
Paul Legentil, Fabrice Leroux, Sandrine Therias, Rachid Mahiou, Geneviève
Chadeyron
To cite this version:
Paul Legentil, Fabrice Leroux, Sandrine Therias, Rachid Mahiou, Geneviève Chadeyron. Revisiting fluorescein and layered double hydroxide using a synergistic approach: A complete optical study. Jour-nal of Luminescence, Elsevier, 2019, 215, pp.116634. �10.1016/j.jlumin.2019.116634�. �hal-02333700�
1
Revisiting Fluorescein and layered double hydroxide using a synergistic approach: a complete
1
optical study
2
Paul Legentil, Fabrice Leroux, Sandrine Thérias, Rachid Mahiou and Geneviève Chadeyron* 3
Université Clermont Auvergne, Institut de Chimie de Clermont-Ferrand, UMR CNRS 6296, BP 10448, 4
F-63000 Clermont-Ferrand, France 5
Abstract
6
The luminescence of Fluorescein, an inexpensive dye, ought to be interesting for lighting 7
application devices such as commercial LEDs. However, the molecule suffers from severe instability, 8
making it inappropriate for such applications. As previously studied, fluorescein molecules may be 9
hosted in a layered double hydroxide (LDH), and the role of such an inorganic material in stabilizing 10
the dye has been underlined. However, a deep understanding of the resulting optical properties is 11
still required. Using extremely small amounts of fluorescein, it is demonstrated here that Zn2Al
12
cation-based LDH tethering acts as a «solid solvent» for the dye, enabling its luminescence even in 13
powder form, whereas fluorescein molecules on their own emit no luminescence at all in the solid 14
state. However, aggregations of the dye occur in the interlamellar space, leading to non-radiative 15
emission. Emission and excitation spectra, as well as fluorescence decays, are studied to explain the 16
difference between the hybrid LDH-Fluorescein material and an aqueous solution of fluorescein. 17
Additionally, LDH platelets are found to help the dispersion of the intercalated fluorescein in silicone 18
to obtain a homogeneous composite film, which exhibits luminescent properties. Finally, an 19
accelerated photoaging study demonstrates that the LDH-fluorescein filler has a pro-degradant effect 20
on polymer aging under UV radiation. 21
1. Introduction
22
In recent years, global warming on Earth has been causing major environmental problems. To 23
respond to this growing concern, scientists orient their research towards sustainable solutions, and 24
develop processes to save energy. Almost 20 % of the electricity consumption in the world is due to 25
the lighting sector, explaining why light-emitting diodes (LED) have emerged to provide efficient and 26
sustainable products replacing common lighting devices such as incandescent bulbs. However, 27
commercial LEDs are manufactured using rare earth-based phosphors; these elements are expensive 28
and not eco-friendly due to their extraction process and their life-cycle assessment. They might be 29
replaced by organic fluorescent molecules that are cheaply available and sustainable. Even if these 30
molecules exhibit high photoluminescent quantum yields, they nevertheless suffer from a lack of 31
robustness in standard operating conditions, thus greatly limiting them as efficient phosphors in 32
marketed lighting devices. 33
Fluorescein is a very common organic dye which has met with great interest for many years in a 34
wide range of applications thanks to its biocompatibility, high molar absorptivity and excellent 35
fluorescence quantum yield [1]. 36
Fluorescein is an organic molecule belonging to the xanthene family and is used as a probe in 37
medical and biological applications (optical imaging, detection of analytes…) [2-4]. Fluorescein is a 38
red powder in the solid state, emitting a strong yellow-green light in liquid solution (in water at basic 39
pH or ethanol for example) at low concentration (below 10-3 M) and under UV-blue excitation. At 40
higher concentrations, a quenching phenomenon appears to reduce its light emission, and the solid 41
powder does not luminesce at all. In solution, the dye can take several prototropic forms depending 42
on the pH [5]. The dianionic form is the most luminescent one, and its contribution to the dye total 43
2 emission exceeds the others. A shoulder on the edge of the main peak (emission of the dianionic 44
form) may be observed, indicating the presence of the monoanionic form [6]. Indeed, the 45
monoanionic form also exhibits luminescent properties but its emission is much weaker, and the 46
global emission spectra are blue-shifted with a broadening of the emission band compared to that of 47
the dianionic form. 48
The optical properties of fluorescein could also lead to an interesting future in lighting 49
applications, and particularly in the LED-based field. Indeed, fluorescein emits green-yellow radiation 50
under blue excitation (λmax exc = 490 nm) compatible with a blue LED chip to produce a modulable
51
(warm or cold) white light emission for lighting applications. Some studies [1, 7] have already 52
emphasized the potential of fluorescein to replace phosphors associated with blue LEDs in 53
commercial devices such as rare-earth based common YAG:Ce. However fluorescein, like organic 54
molecules, is very sensitive to external photonic and thermal stress, and its luminescence quickly 55
breaks down in use [8], which has so far been a limiting factor for further development. 56
To overcome this issue, one alternative is to protect the dye from quenching and instability (i.e. 57
avoiding aggregation, thermal degradation, and so on) using a solid inorganic matrix, such as for 58
example using Layered Double Hydroxides (LDH), an anion host structure. Recently, photoactive 59
molecules intercalated into LDH layers have drawn much attention for the development of 60
nanophotosensitizers for therapeutic uses [9], stimuli-responsive intelligent materials and 61
luminescent sensors [10, 11]. Some studies [12] reported the intercalation of fluorescein molecules 62
into LDH. These materials present an interest, especially for catalysis and environmental applications 63
[13-15]. Their general chemical formula is: [M(II)1−xM(III)x(OH)2]x+[An−]x/n·mH2O where M(II) is a
64
bivalent cation such as Zn2+, Mg2+, Fe2+, etc.; M(III) is a trivalent cation such as Al3+, Fe3+, etc. and An− is 65
an anion. The structure is layered and therefore anisotropic, built from cations and hydroxides having 66
a net positive charge caused by the partial substitution of bivalent cations by trivalent cations. To 67
ensure electroneutrality, anions are located in the interlayer space of the LDH with the presence of 68
water molecules. Since the Fluorescein molecule is an anionic dye, it may be hosted within the LDH 69
structure. The idea here is to possibly tether and stabilize fluorescein molecules while optimizing 70
their luminescence properties. It also allows fluorescein to be isolated from the outside environment 71
(O2 from air) to avoid any accelerated oxidation and improve the dispersion of the fluorescein in a
72
polymer to produce homogeneous composite films for LED-based devices. LDH-based fluorescent 73
and phosphorescent thin films (TFs) elaborated by layer by layer (LBL) method have been reported in 74
the literature [16-18]. Herein, we focused on self-supporting thin luminescent composite films LDH-75
Fluorescein/silicone which have been prepared by solution casting onto a Teflon surface using an 76
Elcometer 4340 automatic film applicator. Indeed, from the point of view of the organic dye, LDH 77
inorganic filler can be viewed as an anti-aggregation and protective agent, while from the LDH side, 78
the dye appears as an organo-compatibilizing agent to better resist polymer dispersion. 79
In this paper, the synthesis and characterization of a hybrid LDH-Fluorescein (LDH-F) material are 80
presented, and its optical properties are thoroughly examined. Among the several LDH, the Zn-Al 81
host matrix was chosen for this study as it displays a higher crystallinity compared to the more usual 82
hydrotalcite Mg-Al for example, thus allowing a more accurate characterization by XRD of the hybrid 83
materials as well as the filler upon polymer dispersion. LDH was used as host matrix to prevent 84
aggregation of fluorescein dye, allowing to avoid the quenching of the luminescence and acting as a 85
protective environment. Indeed, the usual passive LDH filler becomes here a photofunctional active 86
filler. The LDH matrix creates a dilute environment for the dye that is normally observed in an 87
aqueous solution: the LDH provides the fluorescein molecules with an environment which is suitable 88
for them to luminesce well. Although, several studies [19-21] about nanohybrids LDH-Fluorescein 89
have been reported for different applications a complete understanding of the mechanisms involved 90
is scarcely reported so far. In this work, the optical properties were deeply investigated and a better 91
understanding is highlighted to unravel mechanisms responsible of the luminescence of the solid 92
3 powder LDH-F. Indeed, a better understanding permits here the mechanisms responsible for the 93
luminescence to be identified. It is also demonstrated from an analysis of the photostability that LDH 94
platelets stabilize the dye under potential operating conditions. 95
2. Experimental section
96
2.1. Materials
97
The two-component silicon polymer, Bluesil RTV 141 part A and part B, was supplied by Elkem. 98
Zn(NO3)2 .6H2O (purity 99.9+%), Al(NO3 )3 .9H2O (purity 99.9+%) and NaOH (97%) were obtained from
99
Sigma Aldrich. The fluorescein disodium salt C20H10Na2O5 was purchased from Alfa Aesar.
100
2.2. Synthesis procedure of LDH hybrid materials using the
101
coprecipitation method
102
The fluorescein layered double hydroxide phase, Zn2Al– F, was prepared by the coprecipitation
103
method with different fluorescein concentrations. The synthesis of [Zn2Al1(OH)6]+[NO3-]1-x[F2−]x·mH2O
104
was performed using fluorescein disodium salt in 50 mL of de-ionized water. 50 mL of an aqueous 105
solution of Zn2+ (3.4x10⁻² M) and Al+3 (1.7x10⁻² M) was added dropwise over a period of 3 hours under 106
magnetic stirring. For instance, to make the [Zn2Al1(OH)6]+[NO3-]0.999[F2−]0.0005·mH2O sample, 5.2x10⁻¹
107
mmol of fluorescein disodium salt was used. 108
The pH was maintained at 10.5 by adding 0.25 M NaOH during the synthesis processes. 109
Coprecipitation was performed under nitrogen at 20°C. The mixture was centrifuged at 5,000 rpm for 110
5 minutes; the sedimented solid on the bottom of the flask was washed several times with de-ionized 111
water until a clear and transparent supernatant was obtained. A paste was recovered and stored at 112
5°C. A small amount was dried overnight at room temperature to obtain a powder and to determine 113
the proportion of the dry extract. 114
2.3. Elaboration of Silicone/HDL-F resin composite films
115
The LDH-F (0.05 %) powder or the similar paste was used to elaborate the polymer/hybrid 116
composite material with different loadings. The two-component silicone polymer (silicone Bluesil-117
RTV 141 A&B) was composed of a viscous liquid, called part A, cured by a polyaddition reaction with 118
a catalyser, part B. 119
The silicone film was prepared as follows: a mixture of part A and 10 phr of part B was prepared, 120
homogenised with a mechanical mixer (Planetary Centrifugal vacuum Mixer “Thinky Mixer”) for 10 121
minutes at 500 rpm. Next, the final composite film was prepared by casting onto a Teflon surface 122
using an Elcometer 4340 automatic film applicator. The knife blade height was set at 200 µm and the 123
casting speed was 30 mm/s. This two-component silicone polymer was cured at 80°C for 2 hours. The 124
film thickness was measured using an Elcometer 456 coating thickness gauge. 125
The preparation and the curing process for the composite films were the same as for the silicone 126 film. 127
2.4. Characterisation
1282.4.1. X-ray diffraction
129LDH powders were characterised by X-Ray Diffraction; the patterns were measured with a 130
Philips X-Pert Pro diffractometer operating with Cu-Kα radiation (λ=1.5418 Å). The data were 131
collected in a 2θ range of between 5° and 70° with a step size of 1°/min. 132
4
2.4.2. Elemental analyses CHNS
133
Elemental analyses of LDH powders LDH-F were performed to determine the composition of samples 134
with a Flash 2000 CHNS analyzers (Thermo Electron). 135
2.4.3. Thermogravimetric analysis
136
Thermogravimetric (TG) analysis were performed on a Setaram TGA 92 instrument with a 137
linear heating rate of 5 °C.min-1 under air. 138
2.4.4. Fourier-transformed infrared spectroscopy
139
The infrared spectra were recorded using a Nicolet 5700-FTIR spectrometer with Omnic 140
software. Spectra were obtained using a summation of 32 scans and a resolution of 4 cm−1. LDH and 141
fluorescein powders were studied using the KBr pellet technique. 142
In the case of silicone/LDH-F composite films, calibration of the thickness of the non-143
photodegraded samples was performed by normalising the absorbance at 2140 cm-1 in IR spectra, 144
which corresponds to a vibration band of the (Si–H) bending mode relative to the silicone. All the 145
spectra were compared with an absorbance of 0.240 at 2140cm-1. 146
2.4.5. UV-Visible absorption
147
The UV–visible absorption spectra of the samples were recorded in the wavelength range of 148
200 to 800 nm with a UV–vis spectrophotometer (SP-3000 Plus) equipped with an integrating sphere 149
and UV-Probe software. 150
2.4.6. Luminescence
151
Quantum yield efficiencies were measured using a C9920−02G PL-QY integrating sphere 152
measurement system from Hamamatsu Photonics. The setup consisted of a 150 W monochromatized 153
Xe lamp, an integrating sphere (Spectralon coating, ⌀= 3.3 in.) and a high-sensitivity CCD camera. 154
Excitation and blue-excited emission spectra were recorded with a Jobin-Yvon apparatus consisting 155
of a Xe lamp operating at 400 W coupled with two monochromators (Triax 550 and Triax 180) and a 156
cryogenically cooled charge-coupled device (CCD) camera (Jobin–Yvon Symphony LN2 series) for 157
emission spectra and Hamamatsu 980 photomultiplicator for excitation spectra. Excitation spectra 158
were corrected for instrument response and Xe lamp intensity using sodium salicylate. The resolution 159
of the system was better than 0.1 nm in both emission and excitation configurations.Luminescence 160
decays were recorded using second-harmonic generation on a pulsed Nd:YAG OPO Ekspla NT342A 161
laser (3–5 ns pulse duration, 10 Hz, 5 cm−1 line width, 0.3 mJ- 20 mJ in the UV-blue). The emitted 162
photons were detected at right angles to the excitation and analyzed via an Edinburgh FLS980 163
spectrometer (Czerny-Turner monochromator, 300 mm focal length, 1200 grooves mm−1 grating and 164
minimum pass band of 0.1 nm) equipped with Hamamatsu R928P PMT (200–850 nm range). 165
166
2.4.7. Scanning electron microscopy (SEM)
167
Scanning electron microscopy was performed with a ZEISS Supra 55 VP scanning electron 168
microscope in high vacuum at 20 kV using a back-scatter electron detector (QBSD). 169
2.5. Irradiation of films
170
Polymer and composite photodegradation under artificial aging conditions was performed in a 171
SEPAP 12-24 unit (ATLAS) by UV-visible light irradiation (λ>300 nm) in presence of oxygen at 60°C 172
(controlled by a Pt thermocouple). The device comprised four medium-pressure mercury lamps 173
(Novalamp RVC 400W) situated vertically at each corner of the chamber. The samples were placed 174
5 on a rotating carousel positioned in the centre of the chamber. Wavelengths below 300 nm were 175
filtered by the glass envelope of the lamps. 176
3. Results and discussion
177
3.1. XRD characterisation
178
3.1.1. Diffractogram results
179
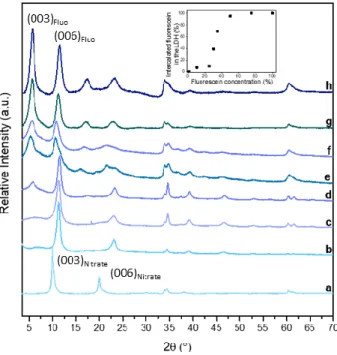
Figure 1 shows the XRD patterns of LDH-fluorescein powders synthetized by coprecipitation. The 180
XRD patterns are shown as a function of the fluorescein relative input. The latter is expressed by the 181
mole ratio between fluorescein and Al3+ cations used during coprecipitation. Diffraction planes (00l) 182
are the fingerprints of the layered structure of LDH [22]. For the sample with the least amount of 183
fluorescein (a), the positions of 2 = 10.1° and 20.2° (i.e. 0.78 nm and 0.39 nm) are characteristic of a 184
nitrate LDH phase, and assigned to diffraction planes (003) and (006), respectively. As the amount of 185
fluorescein increases, these peaks at 10.1° and 20.2° progressively disappear, and a series of 186
harmonic peaks is shifted to a lower angle and located at 5.5°, 11°, 16.5°, and 22° for the sample with 187
the highest fluorescein content. For the intermediate contents (fig. 1b, 1c, 1d and 1e), the XRD 188
patterns overlapped and correspond to a combination of nitrate and fluorescein phases which are 189
mixed. These XRD peaks can be integrated to calculate the amount of fluorescein present in the 190
interlayer space (inset fig 1). A simple methodology based on pole concentration is used here. 191
Indeed, for sample (h), the experimental XRD pattern does not show the nitrate signal, and the ratio 192
of the integration of the first and second harmonics (003)/(006) of the fluorescein signals can be 193
calculated, resulting in a constant . For other samples for which a combination of nitrate 194
and fluorescein is observed, the (006) peak of the fluorescein signal merges with the (003) peak of 195
the nitrate signal. Using the constant and the integration of the merged signals, the ratio 196
(003)Fluo/(003)nitrate may be calculated for all the samples studied. These results are shown in the inset
197
in figure 1. 198
For the series of harmonic peaks, the one at 2 = 5.5° leads to a basal spacing of 1.61 nm and is 199
ascribed to diffraction plane (003), such values agreeing well with the basal spacing observed for 200
fluorescein intercalated between LDH layers according to either Costantino et al. [23] or Tanaka et al. 201
[24]. Indeed, Costantino et al. showed that fluorescein can be intercalated in a Zn2Al LDH matrix by
202
the ion-exchange method from a LDH-perchlorate in a fluorescein solution. As in the present study, 203
several concentrations of fluorescein were used, resulting in the presence of a pristine LDH phase 204
with a fluorescein LDH phase exhibiting a basal spacing of 1.65 nm. A slightly lower value of 1.58 nm 205
is observed for MgAl LDH. In this case and similarly to the present study, Tanaka et al. performed 206
fluorescein intercalation by coprecipitation and reported the setting up of two distinct fluorescein 207
phases depending on the pH of the synthesis, leading to two interlayer distances of 0.78 and 1.58 208
nm. According to Tanaka et al., guest accommodation within the interlayer domain for the former is 209
horizontal to the inorganic sheets, while it is vertical (perpendicularly tilted) for the latter. 210
Elemental analysis of powders was performed for some samples (sample a, d and h) to 211
determine the experimental fluorescein amounts remaining in the LDH powders after the synthesis. 212
Microanalyses CHNS allows to find the mass fraction of C, N and H elements contained in each 213
sample. Elemental analyses results are reported in table 1. Carbonate pollution in interlamellar space 214
is likely as XRD patterns shown and has been taken into account in the calculations. Thus, the 215
experimental formula can be easily calculated by using the experimental molecular mass Mw 216
determined with thermogravimetric analysis (see fig. S1 in the Supporting Information). For instance, 217
the experimental formula of the sample d obtained is: Zn22+Al3+(OH-)6 (CO32-)0.26(NO3-)0.22(Fluo2-)0.13,
6 1.5 H2O in making assumption that the ratio Zn/Al = 2 is fixed, in this way x = 0.13 for fluorescein
219
amount whereas the theoretical value expected was x = 0.15. In the same way, experimental formula 220
for sample h is Zn22+Al3+(OH-)6 (CO32-)0.09(NO3-)0.0.06(Fluo2-)0.38, 2.8 H2O whereas theoretical amount of
221
fluorescein was x = 0.5. The experimental calculations were distorted when the amount of 222
fluorescein was too weak (for the sample a) otherwise the experimental values are closed from the 223
theoretical values. Thus, the coprecipitation method for intercalation fluorescein is well effective. 224
225
3.1.2. XRD interpretation of fluorescein intercalation
226
From the above interpretations, the attribution of the former value to an intercalated fluorescein 227
LDH phase is questionable, since it corresponds to the basal spacing of the nitrate form. Tanaka et al. 228
argued that the amount of fluorescein was 16.5 % of the total interleaved anions and that the 229
amount of fluorescein adsorbed onto LDH carbonate platelets represented only 2.70 %. However, it 230
is known [25] that carbonate anions present a high affinity towards the LDH framework and that they 231
are not easily displaced unless acidic conditions or calcination are employed. Although Costantino et 232
al. also worked with different concentrations of fluorescein, only one unique basal spacing of 1.65 233
nm was observed, although the pH of the ion-exchange reaction was the same (pH = 8) as the one for 234
which Tanaka et al. observed a horizontal distribution of the fluorescein molecules with a basal 235
spacing of 0.78 nm. The interpretation of Tanaka et al. is also in discrepancy with the present results, 236
showing a unique stacked structure for a fluorescein loading of 10 %, which is comparable to some 237
extent to the Tanaka et al. experimental conditions. It is interesting to note that for the low 238
fluorescein content, the nitrate phase is observed. However, for a loading of 10 % fluorescein, a 239
carbonate phase is clearly evidenced by the saw-toothed structure around 60° and attributed to 240
diffraction peaks (110) and (103). Interestingly, carbonates anions displaced the initially interleaved 241
anions when the interlayered gap was not fully occupied by the same anions (b, c and d), making 242
some possible paths available within the interlayer space for the carbonate anions to diffuse. 243
To conclude this structural discussion, the basal spacing at 0.78 nm is characteristic of the nitrate 244
LDH phase, and does not correspond to horizontally accommodated fluorescein molecules, since the 245
space available, 0.30 nm (knowing that the thickness of the LDH cationic sheets is 0.48 nm), is too 246
small for the cumbersome guest molecule and the not strictly planar fluorescein molecule (Figure 2) 247
to be correctly lodged in the interlamellar space; this in addition to the low charge matching, which is 248
not reasonably in favour of such a horizontal accommodation. 249
3.2. Luminescence properties
250
3.2.1. Emission spectra interpretation
251
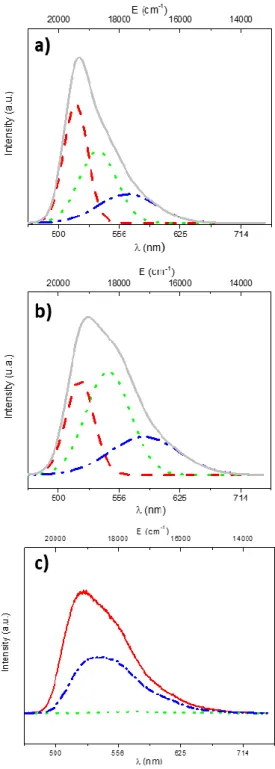
Fluorescein powder does not exhibit luminescence properties; while in aqueous media the 252
fluorescein dye is characterized by a bright yellow-green emission under blue excitation (fig. 3a) [5, 253
26, 27]. As shown in Fig 3b and c, a yellow green emission is recorded for HDL/fluorescein powder 254
upon excitation at 450 nm, which is the wavelength corresponding to the emission of a commercial 255
blue LED for a potential further association. 256
Fluorescence emission studies were undertaken using an excitation wavelength of 450 nm 257
(corresponding to the emission of a commercial blue LED). The emission spectra of LDH-fluorescein 258
(0.05 %, 1.25 % and 35%) powders are shown in fig. 3c. For comparison, the emission spectrum of 259
fluorescein in aqueous solution (10-7 M, pH 10) has been added (fig. 3a). As the amount of fluorescein
260
in the LDH phase increases, fluorescence intensity decreases and the spectra show a gradual red shift 261
(fig. 3c). A high concentration of fluorescein in the LDH phase leads to a luminescence quenching 262
7 phenomenon (as seen in fig. 3c). The emission spectrum of the 0.05% LDH-Fluorescein sample shows 263
a predominant peak at 520 nm with a shoulder at 556 nm. A similar trend in the emission spectrum is 264
observed for fluorescein in diluted solution (fig. 3a). As described by De et al. [26, 28] the main 265
emission is ascribed to the dianion while the shoulder contains several contributions, arising from the 266
emission of some species due to a neutral form of the dye or some dye aggregates. The 267
deconvolution of the broad emission band by Gaussian functions (fig. 3a and b) defines three 268
contributions, both for the fluorescein in solution and for the LDH-F powder. However, as shown in 269
table 2, the position and the intensity of each contribution are slightly different for the two samples, 270
which can be explained by a change in the environment of the fluorescein dye. Each contribution 271
could be ascribed to three different fluorescent species. Thus, based on previous work, we can 272
consider that fluorescein luminesces through three forms which can be attributed, for the aqueous 273
solution, to the dianionic form as well as the monoanionic and the neutral forms [28]. In this case, 274
the dianionic form is the most luminescent form (red curve/solid line in fig. 3a), whereas the 275
monoanionic form (green curve/dashed line in fig. 3a) and the neutral form (blue curve/dash-dot 276
line) are red-shifted with a lower intensity. For the LDH-F sample, the green (dashed line) 277
contribution intensity becomes higher than the red one (solid line) indicating that the monoanionic 278
population is higher than the dianionic population. This result can be explained by introducing the 279
concept of “aggregates”. Aggregation depends on many parameters, such as the structure of the 280
monomer but also the nature of the solvent (if the environment is liquid), temperature, pH values 281
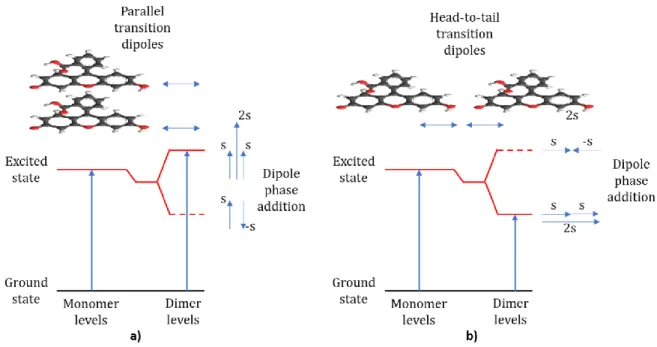
and ionic strength. According to the Kasha and El-Bayoumi report [29], several absorption peaks are 282
observed in a solution containing aggregates. A monomer molecule has a singlet excited state, while 283
a dimer will have two levels: one with lower energy than the monomer singlet excited state and one 284
at higher energy, according to the molecular exciton model. Figure 4 illustrates the mechanism 285
resulting from the aggregation of two single fluorescein molecules. Depending on the orientation of 286
the molecules in the aggregate, one of these levels will be a permitted absorption transition, which 287
will be forbidden for the others. For a dye such as fluorescein, which belongs to the xanthene family, 288
aggregation is due to conjugated rings through the π-stacking effect. When dipoles of each molecule 289
are arranged in a parallel manner (fig. 4a), only the transition to the higher energy level is allowed, 290
and hence the electronic absorption transition in the dimer will be blue-shifted in comparison to the 291
monomer [30]. For aggregates in which the monomers are arranged in a head-to-tail manner (fig. 292
4b), only a transition to the lowest split level is permitted. As a result, the emission spectrum is red-293
shifted with respect to the monomer. As mentioned by S. Das et al., the head to tail arrangement 294
cannot be observed in LDH-F. Based on these results, the different contributions of the emission 295
spectrum in figure 3b can be detailed as follows: the main emission peak can be assigned to the 296
dianionic form (monomer), while the peak at the shorter wavelength can be attributed to the 297
dianionic dimer arranged in a parallel manner, and the peak at the higher wavelength (590 nm) 298
corresponds to the monoanionic monomer. 299
To examine the fluorescein environment close to LDH platelets, the excitation spectra were 300
recorded and studied. 301
3.2.2. Excitation spectra
302
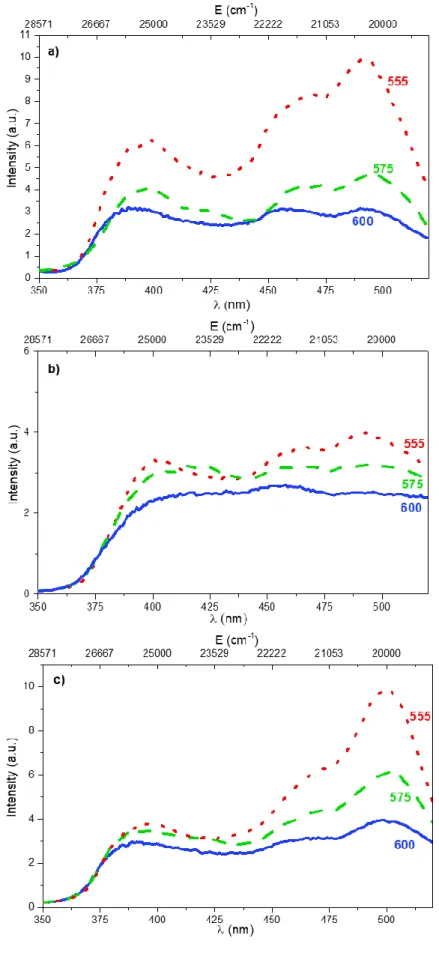
The excitation spectra of the LDH-F sample were recorded by monitoring three emission 303
wavelengths (fig. 5). It appears that the excitation spectra depend strongly on the monitored 304
emission wavelength. In any case, the excitation bands were located in the range lying between 375 305
and 530 nm and exhibited three contributions corresponding to the different arrangements of the 306
fluorescein dye. As previously stated, we can easily attribute the band close to 490 nm to the 307
dianionic form, and the shoulder around 475 nm to the monoanionic form of the fluorescein. The 308
broad band located at 400 nm can be ascribed to another fluorescein form. Indeed, according to 309
8 Sjoback et al. [31] this excitation band may arise from dimers constituted of two aggregated 310
monomers in parallel stacking.This assumption is in agreement with the findings of Kasha and El 311
Bayoumi, who expected a blue-shifted band [21]. We also could not exclude the possibility that part 312
of the fluorescein was adsorbed onto the surface of the LDH layers. To attempt to discard or retain 313
this possibility, the excitation spectra of calcinated LDH-nitrate and LDH-carbonate with adsorbed 314
fluorescein were recorded (fig. 5b and c, respectively). These samples were prepared from calcinated 315
LDH-nitrate and LDH-carbonate dispersed in fluorescein solution (10-6 M). In these conditions, the 316
fluorescein dye was only adsorbed at the surface of the oxide obtained by the calcination of the LDH 317
or of the layers in the case of the LDH-carbonate. In the absence of any intercalation, the same 318
behaviour was observed, meaning that the environment between intercalated and adsorbed 319
fluorescein molecules in the LDH (fig. 5a) is similar. Stacking onto the platelets is surmised at this 320
stage. 321
3.2.3. Luminescence Decays
322
All the excitation spectra shown in Fig.5 clearly exhibit three broad contributions peaking at 323
around 400, 450 and 490 nm. The intensities of these bands differ from one sample to another, but 324
remain quite constant in position when the monitored emission is modified. Selective excitation is 325
difficult to elucidate, since the three contributions are close in position and overlapping. Considering 326
the sample of interest (Fig.5a), the excitation at around 490 nm seems to be the most useful for an 327
analysis of the dynamic processes. This position fits the absorption maximum observed for 328
fluorescein in the xanthene major form in solution, as reported by Zhang et al. [32], which is around 329
496 nm. It is attributed to the 1S0 1S1 absorption transition. The time decay of the fluorescein in
330
solution is reported to be around 3-4 ns and must be measured using a high-frequency laser with ps 331
pulse duration. These possibilities are not available with our measurement apparatus. 332
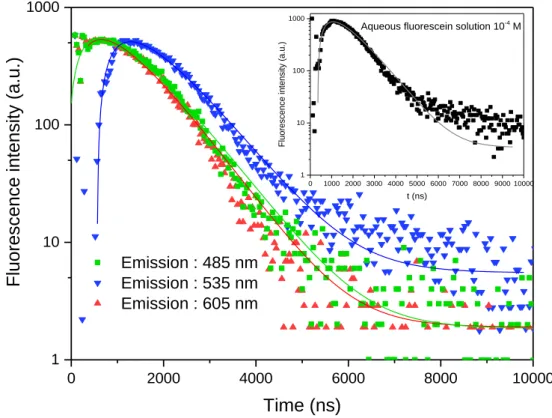
Despite this, luminescence decays can be recorded for the LDH-F sample, indicating that the 333
LDH host modifies the decay time of the fluorescein since the time range of luminescence decays 334
extends to the ms range, as observed in fig 6. To record the luminescence decays, three wavelengths 335
were considered, one in the middle of the broad emission band at 535 nm and the two others on the 336
high and low edge energy sides at 485 and 605 nm. 337
The deconvolution method was used to fit the decays by double exponential form, one in the 338
rise and the second in the tail of the decays using the function I(t)= A - B.exp (-t/1) +C.exp (-t/2), where 339
A corresponds to the contribution of the noise and B and C are respectively the contributions of the 340
rise and the long decay with the 1 and 2 time constants. The reliability of the fits is higher than 96%,
341
the A contribution to the overall luminescence decays is less than 4.10-3 % and can be l considered 342
as negligible. The derived 1 and 2 values are reported in table 3. All decays have the same shape and
343
show no dependence on either emission or excitation wavelengths. We can state that the recorded 344
luminescence, due to the long luminescence decay time, is inherently phosphorescent, arising from 345
the triplet state of the fluorescein. Such consideration has been reported by D-J. Lougnot et al. [33] 346
which have estimated that absorption-emission-decaying 1S01S1 processes occur during the laser
347
pulse when its duration is larger than the photoionization process. However, the transition emission 348
arising from the 3T1 state should be accompanied by a red shift for the emission. To the best of our
349
knowledge, only one paper reports the position of the 3T11S0 transition in the case of fluorescein,
350
which lies at around 625 nm. Our measurements of the luminescence emissions show clearly that no 351
such notable shift was observed between fluorescein in solution and that in LDH-F. Moreover, the 352
luminescence decays of the fluorescein in solution exhibit the same shape than that of fluorescein 353
intercalated in LDH. 354
9 Considering the decay results, the rise is always similar at around 700 ns. The nature of this 355
rise was the subject of further experiments, notably by checking Time Resolved Spectroscopy. The 356
long decay time constant is around 700 ns. The two values are similar, indicating that that the species 357
present in the LDH-F are probably thermalized in terms of energy levels and exhibit mutual energy 358
transfer. The increase in fluorescence lifetime in LDH-F compared to the reported results concerning 359
fluorescein in solution is an indication that the photoluminescence quantum yield is reduced. 360
3.2.4. Absolute photoluminescence quantum yields
361
The absolute photoluminescence quantum yields (PL QYab) of LDH-F powder and paste samples
362
with varying amounts of fluorescein (between 0.05% to 35% of the occupied interlamellar space) 363
were recorded upon excitation in the 250-500 nm range, as shown in fig. 7. For all the samples 364
(fig. 7a for powders and 7b for pastes), the PL QYab evolution as a function of the excitation
365
wavelength, leads to the same profiles. The absolute quantum yield of the fluorescein in water-based 366
solution of 10-4 mol. concentration, upon 450 nm excitation, is of about 65%. The emission spectrum 367
of LDH-F (fig. 3b) is the same as the emission spectrum of fluorescein in solution (fig. 3a) under such 368
excitation, indicating that the intercalation doesn’t modify the main electronic structure of the 369
emitting species. For the LDH-F the LDH layers to some extent confine the fluorescein molecules on 370
the basis of host−guest interactions (such as ionic interactions), and the anionic state, molecular 371
configuration and microenvironment of interlayer fluorescein may be totally different from the 372
fluorescein solution. 373
The samples with a very small amount of fluorescein exhibit only photoluminescence 374
properties. Indeed, the amount of fluorescein must be lower than 1 % in the LDH to record a PL QYab
375
higher than 5% for either powder or paste. For both samples, the best PL QYab is reached for an
376
excitation wavelength of 490 nm, corresponding to maximum fluorescein absorption. The maximum 377
values of absolute quantum yield were measured for LDH-F (0.05 %) paste, with a value of 21.4 %. PL 378
QYab is higher for the paste sample than for the powder, and two assumptions can be suggested. The
379
first concerns the effect of water in the paste; indeed, the paste produced after centrifugation 380
contains roughly 80 wt. % of water and 20 wt. % of powder. In this case, the fluorescein molecules 381
are in an environment that is close to that of a solution, explaining why luminescence is increased. 382
The second possibility relies on the reflective index (RI). The RI of water is 1.33, against 1 for air; thus, 383
the paste which contains water will absorb more photons. Accordingly, absorption is greater for the 384
paste and its PL QYab is improved.
385
The intercalation of fluorescein in such low concentrations (0.05 %) cannot be detected from 386
XRD patterns, where only the nitrates are visible (as seen in fig. 1). Nevertheless, we can suppose, 387
based on the emission and excitation spectra that the fluorescein molecules are in close proximity to 388
the LDH, most probably adsorbed onto the LDH platelet surfaces. 389
We have demonstrated that the fluorescein dye must be present in the LDH in small 390
quantities to provide luminescence properties. Such behaviour can be explained by a concentration 391
quenching phenomenon, which is predominant when the concentration of fluorescein dye increases. 392
When the fluorescein molecules are closed, they formed aggregates by π-stacking (parallel stacking) 393
due to conjugated xanthene rings or by hydrogen bonding (head-to-tail) with carboxylic acid and 394
alcohol groups [26]. Fluorescein is well-known [28] for self-quenching its luminescence when the 395
concentration reaches a sufficiently high value to form these aggregates of monomer molecules such 396
as dimers, trimers etc. Although the monomer exhibits good luminescence properties, all the 397
aggregates led to an extinction of the optical properties due to non-radiative energy transfer 398
between the dye molecules [34]. This phenomenon increases with the dye concentration in solution, 399
and for fluorescein powder no luminescence is observed. As a conclusion, we have shown that the 400
10 lamellar space of the LDH host matrix can be considered as a dilution medium for the fluorescein 401
dye, and plays the same dispersing role as that of an aqueous solution. 402
3.3. Composite film LDH-F/silicone
403
3.3.1. Luminescence properties
404
The LDH-F powder presenting the best absolute quantum yield efficiency value was used in 405
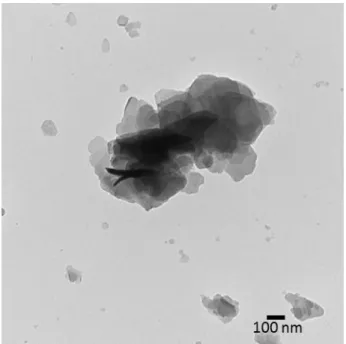
this section. TEM (see fig. S2 in the Supporting Information) revealed that LDH-F powder consisted of 406
pseudo-hexagonal nanosheets stacked on top of each other. The LDH-F (0.05 %) was dispersed in a 407
silicone resin to prepare the composite films. The thickness of the composite films ranged from 100 408
to 120 µm. Composite film homogeneity as well as the random orientation dispersion of the LDH 409
platelets has been shown by SEM (see fig. S3 in the Supporting Information). In order to get a 410
composite film suitable for a commercial blue LED, the LDH/dye nanohybrids were dispersed in a 411
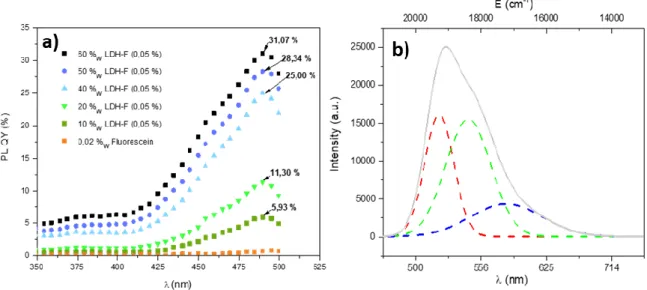
polymer such as silicone. The PL QYab of the composite films with variable amounts (between 10 %
412
to 60 %) of LDH-F (0.05% powder), were recorded under excitation in the 250-500 nm range, as 413
shown in fig. 8a. The best PL QYab was achieved on excitation at 490 nm for each composite film, 414
and increased gradually with the quantity of LDH-F particles in the silicon matrix. This could be 415
explained by an increase in the absorption of photons with the increase in filler loading. On the other 416
hand, when the percentage of LDH-F particles was too high (> 40 wt. %), the mixture of powder and 417
silicon became inhomogeneous and the composite films could not be hardened, due to excessive 418
quantities of nanoparticles compared to the silicone resin. Thus, the percentage of LDH-F (0.05 %) 419
particles dispersed within the silicone resin is fixed at 20 wt. % in the following. Moreover, the PL 420
QYab recorded for the homogenous composite film elaborated with a loading of LDH-F of 40 wt. % (PL
421
QYab=25%) is higher than that obtained for the powder and paste LDH-F (0.05 %) samples. The value
422
of 25% for the PL QYab remains low for general lighting LED but could be of interest for other LED
423
applications such as display and anticounterfeiting for example. We can also add that the silicone 424
matrix enables the creation of a dilution medium for the LDH-F powder, thus improving its 425
luminescent properties. 426
LDH platelets exhibit a good compatibility with the silicone matrix thereby providing a 427
homogeneous dispersion. Previous studies demonstrated an efficient dispersion of organo-modified 428
LDH within PDMS type polymer [35]. To confirm the interest of the LDH matrix in the dispersion of 429
fluorescein in the silicone matrix, a composite (silicone/fluorescein0.02%) film was prepared. The
430
amount of fluorescein therein was comparable to the amount of pure fluorescein contained in the 431
composite silicone LDH-F (0.05 %) film with 20 wt. % of filler loading. This composite 432
silicone/fluorescein0.02% film emits no luminescence at all, as shown in figure 8a, thus confirming the
433
action of LDH as a “solid solvent” in diluting the fluorescein, resulting in greater luminescent 434
properties for the composite films. In this 2D organized structure, the fluorescein dye is intercalated 435
in the interlayer gallery space. In this configuration, the fluorescein molecules are spaced away from 436
each other and the quenching due to the aggregation is avoided. 437
438
The emission spectrum of the composite films is similar to that recorded for the powder. 439
Indeed, as for the LDH-F (0.05 %) powder, the three contributions of fluorescein are observed (fig. 440
8b). 441
3.3.2. Photostability of LDH-F/silicone composite films
442
The photostability of the fluorescein chromophore dispersed into the composite films 443
represents one of the key parameters for potential application in LED device. To the best of our 444
11 knowledge, this paper is the first study of the phostostability of LDH-F/silicone composite films. 445
Composite films with LDH-fluorescein and LDH-nitrate and pure silicone film were irradiated in 446
accelerated ageing conditions (λ>300, 60°C) to study the potential effects that LDH and fluorescein 447
could have on silicone photooxidation. 448
The chemical modifications during irradiation were monitored by IR spectroscopy. Fig. 9a 449
presents the FTIR spectra of a pure silicone film (without filler) as a reference during irradiation 450
under accelerated artificial conditions. The initial spectrum is typical of a silicon polymer like PDMS. 451
The two intense bands at 2960 and 2075 cm-1 are relative to the (C-H) vibration mode of the silicone. 452
The region between 1800 and 2200 cm-1 reveals IR bands corresponding to (Si-O) and (Si-H) vibration 453
modes. The two bands near 1405 and 1445 cm-1 are ascribed to CH3 symmetrical bending vibration.
454
The IR spectrum of silicone during the aging process presents a decrease in two bands, one at 2140 455
cm-1 relative to the (Si-H) vibration mode and one at 905 cm-1 (Si-O-Si). In fig. 9b and c, both IR bands 456
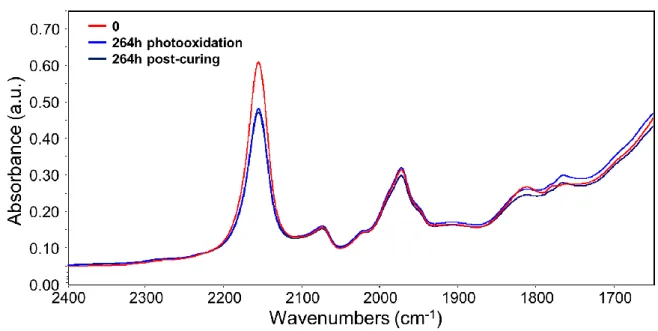
are shown after subtracting the spectra from the initial spectrum (t = 0). To distinguish the thermal 457
curing effect from the photooxidation of the silicone polymer, a post-curing experiment was 458
performed at 80°C for 264 hours on the composite films and the pure silicone film. FTIR spectra were 459
then recorded before and after post-curing. Both FTIR spectra of the pure silicon film are presented 460
in fig. 10. The IR spectrum after post-curing shows the decrease in absorbance of the two IR bands at 461
2140 cm-1 and 905 cm-1. Thus, the modifications of these two bands are due to a post-curing 462
phenomenon and not to a photooxidation process. 463
Fig. 11a shows the spectra of a silicone/LDH-F composite film during irradiation, and Figs 11b 464
and c, present subtracted spectra. Before irradiation, the IR spectrum of the silicone/LDH-F 465
composite film shows a broad and intense band around 3500-3600 cm-1, assigned to the (O-H) 466
stretching of water molecules and hydroxyl groups from the LDH matrix. At 1605 cm-1, water from 467
the LDH is observed, as well as the characteristic band at 1350 cm-1 of nitrate in LDH. The metal-468
oxygen vibrations of LDH can be noticed in the region of 1000-400 cm-1. During irradiation, two IR 469
bands are modified at 2140 cm-1 and 905 cm-1, as observed in the case of the reference silicone film. 470
Moreover, a new IR band at 1725 cm-1 develops upon irradiation for the silicone/LDH-F composite 471
film. This new IR band can be ascribed to photodegradation products of the polymer matrix. The 472
modification observed for the broad and intense band around 3500 cm-1 may be due to a change in 473
the hydration of the samples during irradiation. 474
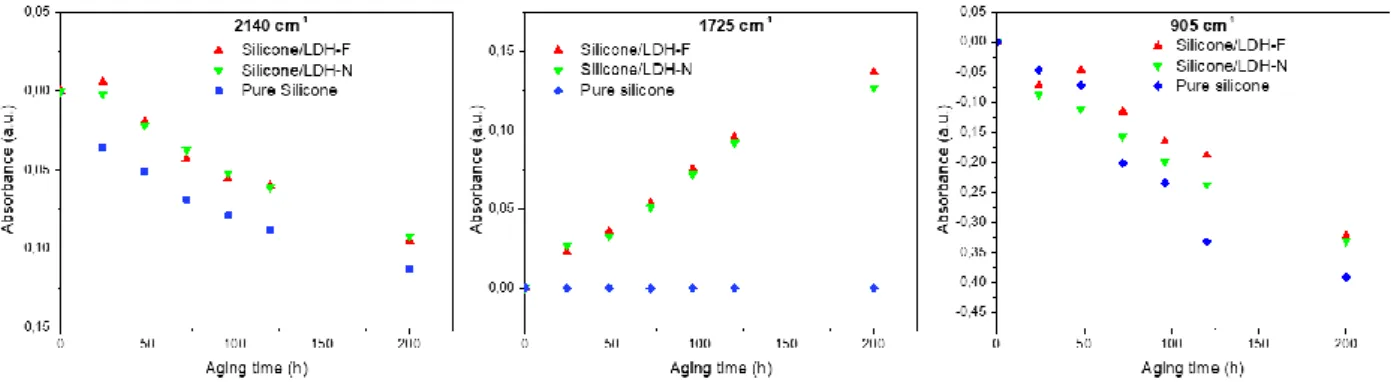
Variations in the absorbance of the IR bands at 2140 cm-1, 1725 cm-1 and 905 cm-1 during 475
irradiation were plotted as a function of time for the silicone film and both composite films, 476
silicone/HDL-F (0.05%) and silicone/LDH-N (with nitrate ions intercalated), and are shown in Fig. 12. 477
A decrease in absorbance for the two IR band at 2140 cm-1 and 905 cm-1 was observed for the three 478
films (pure silicone and the two composite films with LDH-F and LDH-N), with approximately the 479
same kinetic curves, due to a post-curing phenomenon. 480
At 1725 cm-1, the same modification is observed during photoaging between the 481
silicone/LDH-F composite and the composite film with LDH-N, both adopting a similar kinetic. The 482
band at 1725 cm-1 in the pristine silicone film is also slightly visible (Fig. 9b). Thus, the formation of
483
this IR band in the composite film could be explained by the photodegradation of the silicone 484
polymer, where the presence of an LDH matrix (in both cases, LDH-F and LDH-N) has a pro-degradant 485
effect. 486
These results show that in accelerated aging conditions, photodegradation of the silicone 487
matrix is observed in presence of LDH, either with LDH-F or with LDH-N. This effect is not due to the 488
presence of fluorescein molecules in the composite. 489
12
4. Conclusion
490
In this study, it has been demonstrated that fluorescein molecules could be intercalated in large 491
amounts into an LDH host structure, adopting a vertical orientation. However, only extremely small 492
amounts of fluorescein in the lamellar space enable a yellow luminescent powder to be obtained. 493
Fluorescein accommodation is then not detected by XRD. Indeed, from the optical properties of the 494
LDH-F hybrid material, several emission contributions relative to different species are explained by a 495
model in which the dianionic monomer, the monoionic monomer and the dianionic dimer forms of 496
the fluorescein coexist. Thus, LDH brings a “solid solvation effect” to the fluorescein. The LDH-F 497
hybrid material can be dispersed in a polymer matrix such as silicone to yield a luminescent 498
composite film. LDH enables a homogeneous film to be produced, which was not possible with 499
fluorescein alone. From the point of view of the organic phosphor, LDH layers provide dispersion 500
avoiding quenching and migration while for LDH, the dye supplies the photoactivity. 501
The dispersion of the LDF-F filler in the silicone matrix does not affect the optical properties of the 502
hybrid material, the PLQY being even higher than for the powder. From the photoaging study, it has 503
been shown that the presence of LDH-F or LDH-N filler modifies polymer photostability during 504
irradiation, and that this is due to the presence of LDH platelets rather than being caused by the 505
fluorescein molecules. Fluorescein was used as a model to study the added-value of hybrid materials 506
based on a phosphor and an LDH host matrix. In this vein LDH host efficiently the organic phosphor. 507
These results showed the potentiality of LDH as photofunctional active filler and this approach can be 508
extended to other phosphors such as organic dyes or quantum dots. 509
510
Formatting of funding sources
511
This work was supported by CPER DEFI MMASYF through its 2016 «MetaProfile» project. Thus, the 512
authors thank European Union in the framework of the European Regional Development Fund 513
(ERDF), and Région Auvergne Rhône-Alpes, which co-funded this project. 514
References 515
[1] J.-Y. Jin, H.-G. Kim, C.-H. Hong, E.-K. Suh, Y.-S. Lee, White light emission from a blue LED, 516
combined with a sodium salt of fluorescein dye, Synthetic Metals, 157 (2007) 138-141. 517
https://doi.org/10.1016/j.synthmet.2007.01.008
518
[2] R.F. Spaide, J.M. Klancnik, Jr, M.J. Cooney, Retinal vascular layers imaged by fluorescein 519
angiography and optical coherence tomography angiography, JAMA Ophthalmology, 133 (2015) 45-520
50. https://doi.org/10.1001/jamaophthalmol.2014.3616
521
[3] H. Komatsu, N. Iwasawa, D. Citterio, Y. Suzuki, T. Kubota, K. Tokuno, Y. Kitamura, K. Oka, K. Suzuki, 522
Design and Synthesis of Highly Sensitive and Selective Fluorescein-Derived Magnesium Fluorescent 523
Probes and Application to Intracellular 3D Mg2+ Imaging, Journal of the American Chemical Society, 524
126 (2004) 16353-16360. https://doi.org/10.1021/ja049624l
525
[4] A. Kaines, I. Tsui, D. Sarraf, S. Schwartz, The Use of Ultra Wide Field Fluorescein Angiography in 526
Evaluation and Management of Uveitis, Seminars in Ophthalmology, 24 (2009) 19-24. 527
https://doi.org/10.1080/08820530802520095
528
[5] N. Klonis, W.H. Sawyer, Spectral properties of the prototropic forms of fluorescein in aqueous 529
solution, Journal of Fluorescence, 6 (1996) 147-157. https://doi.org/10.1007/bf00732054
530
[6] C.A.B. Rodrigues, C. Graça, E. Maçôas, A. Fedorov, C.A.M. Afonso, J.M.G. Martinho, Excited-State 531
Proton Transfer of Fluorescein Anion as an Ionic Liquid Component, The Journal of Physical Chemistry 532
B, 117 (2013) 14108-14114. https://doi.org/10.1021/jp408616r
533
[7] P. Uthirakumar, C.-H. Hong, E.-K. Suh, Y.-S. Lee, Yellow light-emitting polymer bearing fluorescein 534
dye units: Photophysical property and application as luminescence converter of a hybrid LED, 535
13 Reactive and Functional Polymers, 67 (2007) 341-347.
536
https://doi.org/10.1016/j.reactfunctpolym.2007.01.012
537
[8] S.A. Smith, W.A. Pretorius, The conservative behaviour of fluorescein, Water SA, 28 (2002) 403-538
406. https://doi.org/10.4314/wsa.v28i4.4913
539
[9] R. Gao, X. Mei, D. Yan, R. Liang, M. Wei, Nano-photosensitizer based on layered double hydroxide 540
and isophthalic acid for singlet oxygenation and photodynamic therapy, Nature Communications, 9 541
(2018) 2798. 10.1038/s41467-018-05223-3 542
[10] Y. Zhao, H. Lin, M. Chen, D. Yan, Niflumic Anion Intercalated Layered Double Hydroxides with 543
Mechano-Induced and Solvent-Responsive Luminescence, Industrial & Engineering Chemistry 544
Research, 53 (2014) 3140-3147. https://doi.org/10.1021/ie404054v
545
[11] R. Gao, D. Yan, Layered host–guest long-afterglow ultrathin nanosheets: high-efficiency 546
phosphorescence energy transfer at 2D confined interface, Chemical Science, 8 (2017) 590-599. 547
https://doi.org/10.1039/C6SC03515A
548
[12] J.H. Lee, D.Y. Jung, E. Kim, T.K. Ahn, Fluorescein dye intercalated layered double hydroxides for 549
chemically stabilized photoluminescent indicators on inorganic surfaces, Dalton transactions, 43 550
(2014) 8543-8548. https://doi.org/10.1039/c4dt00692e
551
[13] L. Yan, Y. Wang, J. Li, S. Kalytchuk, A.S. Susha, S.V. Kershaw, F. Yan, A.L. Rogach, X. Chen, Highly 552
luminescent covalently bonded layered double hydroxide–fluorescent dye nanohybrids, Journal of 553
Materials Chemistry C, 2 (2014) 4490. https://doi.org/10.1039/c3tc32483d
554
[14] E. Conterosito, I. Benesperi, V. Toson, D. Saccone, N. Barbero, L. Palin, C. Barolo, V. Gianotti, M. 555
Milanesio, High-Throughput Preparation of New Photoactive Nanocomposites, ChemSUSchem, 9 556
(2016) 1279-1289. https://doi.org/10.1002/cssc.201600325
557
[15] S.P. Lonkar, B. Kutlu, A. Leuteritz, G. Heinrich, Nanohybrids of phenolic antioxidant intercalated 558
into MgAl-layered double hydroxide clay, Applied Clay Science, 71 (2013) 8-14. 559
https://doi.org/10.1016/j.clay.2012.10.009
560
[16] D. Yan, J. Lu, L. Chen, S. Qin, J. Ma, M. Wei, D.G. Evans, X. Duan, A strategy to the ordered 561
assembly of functional small cations with layered double hydroxides for luminescent ultra-thin films, 562
Chemical communications, 46 (2010) 5912-5914. 10.1039/C0CC00522C 563
[17] R. Gao, D. Yan, Ordered assembly of hybrid room-temperature phosphorescence thin films 564
showing polarized emission and the sensing of VOCs, Chemical communications, 53 (2017) 5408-565
5411. https://doi.org/10.1039/C7CC01794D
566
[18] R. Gao, D. Yan, D.G. Evans, X. Duan, Layer-by-layer assembly of long-afterglow self-supporting 567
thin films with dual-stimuli-responsive phosphorescence and antiforgery applications, Nano 568
Research, 10 (2017) 3606-3617. https://doi.org/10.1007/s12274-017-1571-x
569
[19] W. Shi, S. He, M. Wei, D.G. Evans, X. Duan, Optical pH Sensor with Rapid Response Based on a 570
Fluorescein-Intercalated Layered Double Hydroxide, Advanced Functional Materials, 20 (2010) 3856-571
3863. https://doi.org/10.1002/adfm.201001081
572
[20] W. Shi, M. Wei, D.G. Evans, X. Duan, Tunable photoluminescence properties of fluorescein in a 573
layered double hydroxide matrix and its application in sensors, Journal of Materials Chemistry, 20 574
(2010) 3901-3909. 10.1039/B921290F 575
[21] W. Shi, Z. Sun, M. Wei, D.G. Evans, X. Duan, Tunable Photoluminescence Properties of 576
Fluorescein in a Layered Double Hydroxide Matrix by Changing the Interlayer Microenvironment, The 577
Journal of Physical Chemistry C, 114 (2010) 21070-21076. https://doi.org/10.1021/jp1069863
578
[22] S. Aisawa, S. Sasaki, S. Takahashi, H. Hirahara, H. Nakayama, E. Narita, Intercalation of amino 579
acids and oligopeptides into Zn–Al layered double hydroxide by coprecipitation reaction, Journal of 580
Physics and Chemistry of Solids, 67 (2006) 920-925. https://doi.org/10.1016/j.jpcs.2006.01.004
581
[23] U. Costantino, N. Coletti, M. Nocchetti, G.G. Aloisi, F. Elisei, L. Latterini, Surface Uptake and 582
Intercalation of Fluorescein Anions into Zn−Al−Hydrotalcite. Photophysical Characterization of 583
Materials Obtained, Langmuir, 16 (2000) 10351-10358. https://doi.org/10.1021/la001096d
584
[24] A.S. Tanaka M., Takahashi S., Natita E., Synthesis and cellular uptake of fluorescein intercalated 585
layered double hydroxide, The Clay Science Society of Japan, 14 (2010) 5. 586
https://doi.org/10.11362/jcssjclayscience.14.5_197
14 [25] T. Hibino, Acid Treatment of Layered Double Hydroxides Containing Carbonate, European
588
Journal of Inorganic Chemistry, 2014 (2014) 5311-5321. https://doi.org/10.1002/ejic.201402372
589
[26] S. De, S. Das, A. Girigoswami, Environmental effects on the aggregation of some xanthene dyes 590
used in lasers, Spectrochimica Acta Part A: Molecular and Biomolecular Spectroscopy, 61 (2005) 591
1821-1833. https://doi.org/10.1016/j.saa.2004.06.054
592
[27] N.N. Math, L.R. Naik, H.M. Suresh, S.R. Inamdar, Dual fluorescence and laser emissions from 593
fluorescein-Na and eosin-B, Journal of Luminescence, 121 (2006) 475-487. 594
https://doi.org/10.1016/j.jlumin.2005.11.013
595
[28] S. De, R. Kundu, Spectroscopic studies with fluorescein dye—Protonation, aggregation and 596
interaction with nanoparticles, Journal of Photochemistry and Photobiology A: Chemistry, 223 (2011) 597
71-81. https://doi.org/10.1016/j.jphotochem.2011.07.002
598
[29] M. Kasha, H. Rawls, M. Ashraf El-Bayoumi, The exciton model in molecular spectroscopy, in: 599
Pure and Applied Chemistry, 1965, pp. 371-392. 600
[30] A. Eisfeld, J.S. Briggs, The J- and H-bands of organic dye aggregates, Chemical Physics, 324 (2006) 601
376-384. https://doi.org/10.1016/j.chemphys.2005.11.015
602
[31] R. Sjöback, J. Nygren, M. Kubista, Absorption and fluorescence properties of fluorescein, 603
Spectrochimica Acta Part A: Molecular and Biomolecular Spectroscopy, 51 (1995) L7-L21. 604
https://doi.org/10.1016/0584-8539(95)01421-P
605
[32] X.-F. Zhang, J. Zhang, L. Liu, Fluorescence Properties of Twenty Fluorescein Derivatives: Lifetime, 606
Quantum Yield, Absorption and Emission Spectra, 24 (2014) 7.
https://doi.org/10.1007/s10895-014-607
1356-5
608
[33] D.J. Lougnot, C.R. Goldschmidt, Photoionization of fluorescein via excited triplet and singlet 609
states, Journal of Photochemistry 12 (1980) 9. 610
[34] S. Das, A.P. Chattopadhyay, S. De, Controlling J aggregation in fluorescein by bile salt hydrogels, 611
Journal of Photochemistry and Photobiology A: Chemistry, 197 (2008) 402-414. 612
https://doi.org/10.1016/j.jphotochem.2008.02.003
613
[35] J.F. Naime Filho, F. Leroux, V. Verney, J.B. Valim, Percolated non-Newtonian flow for silicone 614
obtained from exfoliated bioinorganic layered double hydroxide intercalated with amino acid, 615
Applied Clay Science, 55 (2012) 88-93. https://doi.org/10.1016/j.clay.2011.10.010
616 617 618 LDH sample C (wt %) N (wt %) H (wt %) Mw (g.mol -1) a 0.84 4.6 3.0 449.84 d 0.93 10.5 3.20 334.13 h 0.21 21.4 3.8 431.43
Table 1 : Elemental analyses obtained from CHNS analysis and molecular mass obtained by TGA analysis of LDH samples a, d
619
and h.
620 621 622
Emission spectra λmax (nm) E (cm-1) FMWH (cm-1)
Fluorescein in water (10-7 M)
Red contribution (dash) 514 19437 926
Green contribution (dot) 535 18706 1453
Blue contribution (dash-dot) 564 17736 2239
LDH-fluorescein (0.05%) powder
Red contribution (dash) 518 19288 1083
Green contribution (dot) 545 18358 1707
Blue contribution (dash-dot) 582 17171 2660
Table 2 : Results of the emission bands deconvolution by the sum of three gaussian functions fig. 3a and b
15 624
625
Time constants Fitting goodness
τ1 (ns) τ2 (ns) Adjusted R2 Emission wavelengths 485 nm 706 716 0.967 535 nm 707 723 0.992 605 nm 674 676 0.996
Table 3 : Time constants derived from the fitting of the experimental values of the LDH-F (0.05%) powder fluorescence
626
lifetime decay monitored at three emission wavelengths
627
628
Figure 1 : X-Ray diffractograms of LDH-Fluorescein powder samples with different concentrations of fluorescein (a, b, c, d, e,
629
f, g and h: 0.05%, 10%, 25%, 30%, 35%, 50%, 75% and 100%). Inset: Amount of intercalated fluorescein in LDH interlayer
630
space in function of fluorescein concentration used in the XRD samples taking a and h as end-member of the nitrate vs
631
fluorescein LDH substitution respectively.
632 633
634
Figure 2 : Schematic representation of fluorescein seen from the xanthen frame plan
635 636
16 637
638
Figure 3: Emission spectra at 20°C with excitation at 450 nm of: a)
639
fluorescein in water (10-7 M) with deconvolution in three
640
contributions. b) LDH-fluorescein (0.05%) powder with deconvolution
641
in three contributions. c) LDH-fluorescein powder with three loadings
642
of fluorescein in LDH host (0.1 % ___, 1.25 % __ _ __and 35%_ _ _)
643 644 645 646
17 647
648
Figure 4 : Exciton band energy diagram for a molecular dimer with parallel (a) and head-to-tail (b) transition dipoles
18 650
Figure 5 : Fluorescence excitation spectra monitoring at several wavelengths emission (555, 575 and 600) of: a)
LDH-651
fluorescein (0,05%) powder b) calcinated LDH-nitrate with fluorescein adsorption c) LDH-carbonate with adsorbed
652
fluorescein
653 654
19 0 2000 4000 6000 8000 10000 1 10 100 1000 0 1000 2000 3000 4000 5000 6000 7000 8000 9000 10000 1 10 100 1000 Flu or esce nce inte nsity ( a.u .) t (ns)
Flu
or
esce
nce
inte
nsity (
a.u
.)
Time (ns)
Emission : 485 nm Emission : 535 nm Emission : 605 nmAqueous fluorescein solution 10-4 M
655
Figure 6: Fluorescence lifetime decay of the powder LDH-F (0.05%) monitored at different emission wavelengths and with an
656
excitation wavelength fixed at 492 nm. Inset: fluorescence lifetime decay of aqueous fluorescein solution (10-4 M) with
657
excitation wavelength fixed at 450 nm and emission wavelength at 520 nm.
658 659
660
Figure 7: Absolute quantum yield depending on the wavelength with different amounts of fluorescein (i :0.05 %, ii: 0.1 %, iii:
661
1.25 %, iv: 10 for paste samples (a) and powder samples (b)
662 663
20 664
665
Figure 8 : Absolute PL QY of composite films silicone/LDH-F (0,5 %) for several loadings of LDH powder (a). Emission
666
spectrum of a composite film silicone/LDH-F (0,05 %) 80:20 with λexc=450 nm (b).
21 668
669
670
Figure 9 : FTIR spectra during photooxidation at λ>300 nm, 60°C, of a pristine silicone film : a) between 400 and 4000 cm-1 b)
671
between 1650 and 2400 cm-1 (after subtraction of the initial spectrum) and c) between 885 and 950 cm-1 (after subtraction
672
of the initial spectrum).
22 674
Figure 10 : FTIR spectra of a pristine silicone film (between 1600 and 2400 cm-1), after 264h of photooxidation λ>300 nm,
675
60°C and after post-curing treatment in oven at 80°C.
676 677 678 679 680 681 682
23 683
684
685
Figure 11: FTIR spectra during photooxidation at λ>300 nm, 60°C, of a composite film silicone/LDH-F (0.05%) (with 20 %w of
686
LDH-F) : a) between 400 and 4000 cm-1 b) between 1650 and 2400 cm-1 (after subtraction of the initial spectrum) and c)
687
between 885 and 950 cm-1 (after subtraction of the initial spectrum).
688 689
24 690
691
Figure 12: Variations of absorbance at 2140, 1725 and 905 cm-1 as a function of irradiation time for the composite film
692
silicone/LDH-F (0.05%), the composite film silicone/LDH-N and the pristine silicone film
693 694 695
Supporting Information
696 697 698 0 200 400 600 800 1000 40 50 60 70 80 90 100 LDH-F (a) LDH-F (h) Relative weigh t loss (%) T (°C) LDH-F (d) 699Figure S1: TGA of LDH-F powders under air (sample a, d and h)
700 701 702 703 704 705 706
25 707
708
709
Figure S2: TEM image of LDH-F powder
710 711
712
Figure S3: SEM image of Silicone/LDH-F composite film
713 714 715 716 717