HAL Id: hal-01963248
https://hal.archives-ouvertes.fr/hal-01963248
Submitted on 21 Dec 2018
HAL is a multi-disciplinary open access archive for the deposit and dissemination of sci-entific research documents, whether they are pub-lished or not. The documents may come from
L’archive ouverte pluridisciplinaire HAL, est destinée au dépôt et à la diffusion de documents scientifiques de niveau recherche, publiés ou non, émanant des établissements d’enseignement et de
Patterned two-photon illumination by spatiotemporal
shaping of ultrashort pulses
Eirini Papagiakoumou, Vincent de Sars, Dan Oron, Valentina Emiliani
To cite this version:
Eirini Papagiakoumou, Vincent de Sars, Dan Oron, Valentina Emiliani. Patterned two-photon illumination by spatiotemporal shaping of ultrashort pulses. Optics Express, Optical Society of America -OSA Publishing, 2008, 16 (26), pp.22039-22047. �10.1364/OE.16.022039�. �hal-01963248�
Patterned two-photon illumination by
spatiotemporal shaping of ultrashort pulses
Eirini Papagiakoumou,1 Vincent de Sars,1 Dan Oron,2 and Valentina Emiliani1*
1
Neurophysiology and New Microscopies Laboratory: Wavefront engineering microscopy group, CNRS UMR8154, INSERM S603, Paris Descartes University, 45, rue des Saints Pères, 75270 Paris Cedex 06,
France 2
Department of physics of complex systems, Weizmann institute of science, Rehovot 76100, Israel *Corresponding author: [email protected]
Abstract: Multiphoton excitation by temporally focused pulses can be
combined with spatial Fourier-transform pulse shaping techniques to enhance spatial control of the excitation volume. Here we propose and demonstrate an optical system for the generation of such spatiotemporally engineered light pulses using a combination of spatial control by a two-dimensional reconfigurable light modulator, with a dispersive optical setup for temporal focusing. We show that although the properties of a holographic beam significantly differ from those of plane-wave illumination used in previous temporal focusing realizations, this leads only to a slightly reduced axial resolution. We show that the system can provide scanning-less, arbitrarily shaped, depth resolved excitation patterns that offer new perspectives for multiphoton photoactivation and optical lithography applications.
©2008 Optical Society of America
OCIS codes: (090.1995) Digital holography; (180.4315) Non-linear microscopy; (230.6120)
Spatial light modulators; (320.5540) Pulse shaping.
References and links
1. P. Gorostiza and E. Y. Isacoff, "Optical switches for remote and noninvasive control of cell signaling," Science 322, 395-399 (2008).
2. C. M. Tang, "Photolysis of caged neurotransmitters: theory and procedures for light delivery," Curr. Protoc. Neurosci. (2006).
3. F. Zhang, L. P. Wang, E. S. Boyden, and K. Deisseroth, "Channelrhodopsin-2 and optical control of excitable cells," Nat. Meth. 3, 785-792 (2006).
4. S. Szobota, P. Gorostiza, F. Del Bene, C. Wyart, D. L. Fortin, K. D. Kolstad, O. Tulyathan, M. Volgraf, R. Numano, H. L. Aaron, E. K. Scott, R. H. Kramer, J. Flannery, H. Baier, D. Trauner, and E. Y. Isacoff, "Remote control of neuronal activity with a light-gated glutamate receptor," Neuron 54, 535-545 (2007). 5. A. A. Bagal, J. P. Kao, C. M. Tang, and S. M. Thompson, "Long-term potentiation of exogenous
glutamate responses at single dendritic spines," Proc. Natl. Acad. Sci. USA 102, 14434-14439 (2005). 6. D. A. DiGregorio, J. S. Rothman, T. A. Nielsen, and R. A. Silver, "Desensitization properties of AMPA
receptors at the cerebellar mossy fiber granule cell synapse," J. Neurosci. 27, 8344-8357 (2007). 7. G. M. Shepherd and K. Svoboda, "Laminar and columnar organization of ascending excitatory projections
to layer 2/3 pyramidal neurons in rat barrel cortex," J. Neurosci. 25, 5670-5679 (2005).
8. M. Canepari, G. Papageorgiou, J. E. Corrie, C. Watkins, and D. Ogden, "The conductance underlying the parallel fibre slow EPSP in rat cerebellar Purkinje neurones studied with photolytic release of L-glutamate," J. Physiol. 533, 765-772 (2001).
9. L. J. Horneck, "128 X 128 Deformable Mirror Device," IEEE Trans. Electron Devices 30, 539 (1983). 10. S. Wang, S. Szobota, Y. Wang, M. Volgraf, Z. Liu, C. Sun, D. Trauner, E. Y. Isacoff, and X. Zhang, "All
optical interface for parallel, remote, and spatiotemporal control of neuronal activity," Nano Lett. 7, 3859-3863 (2007).
11. N. Farah, I. Reutsky, and S. Shoham, "Patterned optical activation of retinal ganglion cells," Conf. Proc. IEEE Eng. Med. Biol. Soc. 2007, 6369-6371 (2007).
12. S. Shoham, D. H. O'Connor, D. V. Sarkisov, and S. S. Wang, "Rapid neurotransmitter uncaging in spatially defined patterns," Nat. Meth. 2, 837-843 (2005).
13. B. Judkewitz, A. Roth, and M. Hausser, "Dendritic enlightenment: using patterned two-photon uncaging to reveal the secrets of the brain's smallest dendrites," Neuron 50, 180-183 (2006).
14. C. Lutz, T. S. Otis, V. DeSars, S. Charpak, D. A. DiGregorio, and V. Emiliani, "Holographic photolysis of caged neurotransmitters," Nat Meth 5, 821-827 (2008).
15. D. L. Pettit, S. S. Wang, K. R. Gee, and G. J. Augustine, "Chemical two-photon uncaging: a novel approach to mapping glutamate receptors," Neuron 19, 465-471 (1997).
16. E. B. Brown, J. B. Shear, S. R. Adams, R. Y. Tsien, and W. W. Webb, "Photolysis of caged calcium in femtoliter volumes using two-photon excitation," Biophys J 76, 489-499 (1999).
17. M. Oheim, E. Beaurepaire, E. Chaigneau, J. Mertz, and S. Charpak, "Two-photon microscopy in brain tissue: parameters influencing the imaging depth," J. Neurosci. Methods 111, 29-37 (2001).
18. M. Matsuzaki, G. C. Ellis-Davies, T. Nemoto, Y. Miyashita, M. Iino, and H. Kasai, "Dendritic spine geometry is critical for AMPA receptor expression in hippocampal CA1 pyramidal neurons," Nat. Neurosci. 4, 1086-1092 (2001).
19. A. G. Carter and B. L. Sabatini, "State-dependent calcium signaling in dendritic spines of striatal medium spiny neurons," Neuron 44, 483-493 (2004).
20. S. Gasparini and J. C. Magee, "State-dependent dendritic computation in hippocampal CA1 pyramidal neurons," J. Neurosci. 26, 2088-2100 (2006).
21. C. D. Harvey, R. Yasuda, H. Zhong, and K. Svoboda, "The spread of Ras activity triggered by activation of a single dendritic spine," Science 321, 136-140 (2008).
22. S. K. Mohanty, R. K. Reinscheid, X. Liu, N. Okamura, T. B. Krasieva, and M. W. Berns, "In-depth activation of ChR2 sensitized excitable cells with high spatial resolution using two-photon excitation with near-IR laser microbeam," Biophys. J. 95, 3916-3926 (2008).
23. M. Matsuzaki, G. C. Ellis-Davies, and H. Kasai, "Three-dimensional mapping of unitary synaptic connections by two-photon macro photolysis of caged glutamate," J Neurophysiol. 99, 1535-1544 (2008). 24. D. Oron, E. Tal, and Y. Silberberg, "Scanningless depth-resolved microscopy," Opt. Express 13,
1468-1476 (2005).
25. E. Tal, D. Oron, and Y. Silberberg, "Improved depth resolution in video-rate line-scanning multiphoton microscopy using temporal focusing," Opt. Lett. 30, 1686-1688 (2005).
26. D. Oron and Y. Silberberg, "Harmonic generation with temporally focused ultrashort pulses," J. Opt. Soc. Am. B 22, 2660-2663 (2005).
27. M. E. Durst, G. Zhu, and C. Xu, "Simultaneous spatial and temporal focusing in nonlinear microscopy," Opt. Commun. 281, 1796-1805 (2008).
28. E. Tal and Y. Silberberg, "Transformation from an ultrashort pulse to a spatiotemporal speckle by a thin scattering surface," Opt. Lett. 31, 3529-3531 (2006).
29. R. W. Gerchberg and W. O. Saxton, "A pratical algorithm for the determination of the phase from image and diffraction pictures," Optik 35, 237-246 (1972).
30. F. Wyrowski and O. Bryngdahl, "Iterative Fourier-transform algorithm applied to computer holography," J. Opt. Soc. Am. A 5, 1058 (1988).
1. Introduction
In recent years the use of advanced optical techniques is generating a continuously growing interest in the field of neurobiology, not only for visualizing neuronal structures and signaling processes, but also for controlling neuronal activity [1]. This is possible thanks to a growing list of existing photosensitive tools that, upon illumination, can modify their chemical or conformational structures. For example, caged-compounds [2] are commonly used photoactivable molecules that are rendered inert by a covalently bounded protecting group (cage). Upon light excitation, the covalent bond is broken and the physiologically active molecule (e.g. Ca2+, ATP or a neurotransmitter) is released at the location of illumination. Alternatively, depolarization or hyperpolarization of neuronal cells can be optically controlled by expressing in neurons foreign light-sensitive rhodopsin ion channels (ChR2) [3] or by attaching photo-switchable chemical ligands to an endogenous channel of interest [4]. The use of these compounds in conjunctions with spatiotemporally resolved photo-stimulation techniques allows a precise control of neuronal activity and to date represents an extremely promising alternative to electrode stimulation.
To reproduce a variety of intra- and extracellular signaling patterns, it is desirable to have as much flexibility as possible in the generation of light patterns. Localized brief transients associated with single synaptic events can be mimicked by using diffraction limited spots [5,6]. Meanwhile, different lens-based systems and laser- or lamp-based illumination methods can be used to generate extended illumination in order to stimulate larger areas of a neuron or multiple neurons [3,4,6-8]. Clearly both approaches are desirable and complementary. However, none of them allows for a quick tuning of the spot size from a small diffraction-limited spot to extended wide-field areas; moreover, they are typically
limited to the generation of simple patterns (generally of circular symmetry). More complex excitation patterns can be generated by using active devices such as digital mirror devices (DMD) or acousto-optic deflectors (AOD). However, for DMDs, a large fraction of laser power is lost because the intensity patterning is created by redirecting unwanted light out of the excitation field [9-11]. AODs allow for a fast scanning of a single excitation beam [12]. However, the finite residence and traveling time required by this approach limit the number of positions (arranged in discrete points or in uniformly filled regions of interest) that can be considered ‘simultaneously’ activated on a biological timescale (sub-millisecond)[13].
Recently, we have presented a one-photon (1P) scanning-less holographic microscope [14], where the use of a Liquid Crystal Spatial Light Modulator (LC-SLM) in the excitation pathway allows to quickly modify the size of the excitation spot and generate simultaneous bi-dimensional (2D) and three-bi-dimensional (3D) multiple spots to mimic multiple localized inputs. The release of active molecules along extended dendritic segments can be induced by producing spots that perfectly match the shape of specific sub-cellular compartments. We have also shown that for large illumination areas holographic illumination allows a significant improvement in the axial resolution with respect to the use of a Gaussian beam.
Still, when performing photoactivation in brain slices, near-UV light is heavily scattered and has a poor axial resolution. One way to overcome these limits consists in using two photon (2P) excitation [15,16]. In this case the nonlinearity of the 2P process gives to the technique an intrinsic 3D resolution with 80% of the excitation confined to the focal volume. The second advantage of 2P excitation is the increased depth penetration in scattering tissues [17]. The latter is a crucial parameter for in vivo experiments. Improvement in depth and axial resolution has been proved in a large number of experiments using a 2P diffraction-limited spot for the photoactivation of caged compounds [18-21]. Very recently, Mohanty and colleagues have also demonstrated depth 2P activation of ChR2 molecules [22].
However, a major drawback in the use of 2P diffraction-limited spots is that the number of activatable receptors/channels within the excitation volume might be insufficient e.g. to generate an action potential [23] or a detectable calcium fluorescence signal [22]. Increasing the pulse length or laser intensity would help, but photodamage limits these approaches [18,22]. A more promising scheme is to increase the excitation spot size by under-filling the objective back aperture, as proposed by M. Matsuzaki et al. [23]. However, the rapid loss of axial resolution inherent in this approach limits its use to small excitation areas.
To overcome these limitations, we present in this paper a new method to generate high resolution extended 2P illumination patterns based on spatiotemporal shaping of ultra-short pulses. The system combines the mentioned advantages of holographic illumination with those of 2P excitation and permits the generation of scanning-less arbitrarily shaped, depth resolved excitation patterns by implementing the recently introduced technique of temporal focusing [24-27]. While depth resolution in standard two-photon microscopy is based on the concept that the peak intensity at the focal plane is highest, due to the strong spatial focusing, in temporally focused microscopy depth resolution results from the fact that the excitation pulse is temporally stretched by dispersion of geometrical origin outside the focal plane. Therefore, the laser pulse is compressed as it propagates through the sample, reaches its peak value at the focal plane and stretches again as it propagates beyond it.
In the previous realizations of temporal focusing, geometrical dispersion of the pulses has been obtained either by using a Gaussian illumination with slowly varying spatial phase impinging on a grating (as compared with the demagnified diffraction limited spot on the grating; in the following this is referred to as "flat phase") [24,25], or by fully randomizing the spatial phase of an ultrashort pulse, passing the beam head-on through a diffuser. In the former case, it was shown that the optimal axial resolution can be equivalent to that of line scanning multiphoton microscopy and is determined by the numerical aperture of the objective. For the latter, however, the depth resolution was shown to be linearly dependent on the excitation pulse duration [24,28], and reaching a depth of focus comparable to that of line scanning requires the use of ultra short pulses (~10fs), which is impractical for most microscopy applications.
Here a LC-SLM is used to spatially modulate the wavefront of the excitation beam to control the lateral extension of the excitation spot, while a grating based scheme for temporal focusing is used to control the depth response. The combined effect of the holographic spatial phase and the geometrical dispersion of a grating on depth resolution are accounted for in a theoretical analysis. This analysis enables to show that like in the case of temporal focusing with plane-wave excitation [24-27], the axial resolution is not directly dependent on the excitation pulse duration but only on the numerical aperture of excitation.
These findings are experimentally demonstrated and we show that, despite the rapidly varying spatial phase of an excitation beam generated by digital holography, it is possible to create, with 140fs pulses and a NA=0.9 objective, arbitrary excitation patterns with a pattern-independent depth resolution of ~5μm, i.e only slightly larger than that achievable with wide-field temporally focused microscopy with flat phase excitation.
2. Experimental realization
The experimental realization for the spatiotemporal control of holographic patterning is schematized in Fig. 1(a). As a light source we used a mode-locked Ti:Sapphire laser (Tsunami, Spectra-Physics; λ=780nm, Δλ=12nm), whose output beam power was controlled by a liquid crystal variable phase-retarder (Meadowlark Optics, LRC-200-IR1) combined with a polarizer cube (Meadowlark Optics, BB-050-IR1). The beam was spatially expanded (10x) to match the input window of a LC-SLM (PPM – Programmable Phase Modulator – X8267-13, Hamamatsu Photonics K.K.), which operates in reflection mode. The beam wavefront at the SLM plane was modified by using a custom-designed software that, given a target intensity distribution at the focal plane of the microscope objective, calculates the corresponding phase-hologram [14] by using an iterative Fourier transform algorithm (IFTA) [29,30]. After diffraction by the SLM, typically ~50% of the incoming beam (I0) goes in the
first order (I1+1) and the rest is distributed among the zero order (I10) and higher order
components. To separate the target intensity spot from the zero order spot, a phase grating was added in all phase holograms. The pulse width after reflection at the SLM plane was 140fs, measured with an autocorrelator. The beam reflected from the SLM (I1) was Fourier
transformed by a 1000mm focal length achromatic lens (L1) and formed a first image of the target intensity and the zero order spot onto a blazed reflectance grating (830 lines/mm) placed at the focal plane of L1 and aligned perpendicular to the optical axis of the microscope. An illumination angle of 40.5º was chosen such as the central frequency of the +1 order beam (I2+1) diffracted by the blazed grating (~70% of I1) was directed along the optical axis of the
microscope while the zero order beam (I20) was blocked. The grating dispersed the various
frequency components of the pattern, which were imaged onto the sample via a telescope comprised of an achromatic lens (L2=500mm focal length) and the microscope objective (Olympus, LUMPLFL60xW/IR2, NA 0.90). This gave rise to a depth-resolved temporally focused excitation pattern at the focal plane of the objective whose lateral spatial distribution was a reduced (~1/170) replica of the pattern generated on the grating. Two-photon holographic patterns were used to excite emission from a ~0.9μm thick spin-coated fluorescent layer of Rhodamine Chloride 610 in PMMA (5% w/v in Chloroform) that was collected by a second objective (Olympus, UPLSAPO60xW, NA 1.20) placed opposite to the excitation one [14]. The use of two independent objectives allowed us to straightforwardly image out-of-focus planes of the excitation volume and therefore to precisely derive the axial propagation of the excitation beam around the objective focal plane (see below). The fluorescence was imaged by a tube collection lens (TL=150 mm) to a CCD camera (CoolSNAP HQ2, Roper Scientific). To reject the excitation light, an emission filter (Chroma Technology HQ 535/50M) and a dichroic filter (Chroma Technology 640DCSPXR) were placed in front of the CCD camera.
Fig. 1. (a) Layout of the experimental setup. (b) Images of 10, 20 and 30µ m diameter spots, obtained by two-photon excitation of a ~0.9μm thick spin-coated fluorescent layer. (c) A confocal image is recorded from a Purkinje cell loaded by Alexa 535. A selected region of interest (dashed box) is extracted and sent as the input for the calculation algorithm. (d) Phase-hologram generated by the algorithm (e) Illumination spot generated at the objective focal plane, with the phase-hologram of (d), visualized by exciting the thin fluorescent layer. (f) Overlay of (c) and (e).
3. Results
Figures 1(b) and 1(e) show different illumination shapes generated by using the LC-SLM and visualized by exciting a thin fluorescent layer. As a first example, we show a series of spots of different diameters (Fig. 1(b)). Alternatively, more complex excitation volumes can be produced by interactively designing their shapes based on fluorescence images. An example is shown in Figs. 1(c)-1(f). A region of interest comprising a specific dendritic segment was extracted from a confocal image of a Purkinje cell loaded with Alexa 532 (Fig. 1(c)). The extracted image was used as the input for the calculation algorithm which generates the corresponding phase-hologram (Fig. 1(d)) used to configure the LC-SLM. An excitation spot was generated at the objective focal plane (Fig.1(e)), which precisely reproduced the original fine structures, as it is demonstrated from the overlay of the fluorescence images of the cell and the excitation spot, Fig. 1(f).
In order to evaluate the axial propagation of holographic beams around the objective focal plane, optical sections of the excitation volumes generated by different holographic beams
(b)
10 µm(d)
(e)
(f)
(c)
10 µm(a)
Laser Liquid Crystal Polarizer Beam Expander SLM Diffraction Grating L1 L2 TL CCDI
0I
1I
1+1I
10I
2+1I
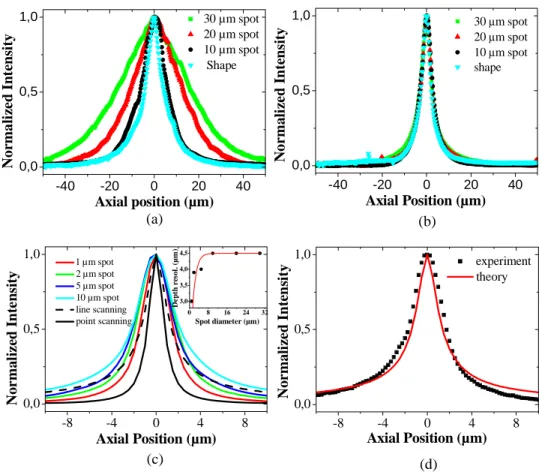
20 Blockerwere imaged by varying, with a piezo objective positioner (P-721.CDQ, Physik Instrument), the position of the excitation objective with respect to a fixed thin fluorescent layer while the collection objective was kept at a fixed position. To precisely characterize the effect of temporal focusing we first performed the optical sectioning in a configuration where the diffraction grating was replaced with a mirror. In Fig. 2(a) the measured axial intensity distribution of 10, 20 and 30µm diameter holographic spots and of the holographic dendritic shape of Fig. 1(e) are shown. These profiles were extracted by measuring, for the different sections, separated by 0.25µm, the integrated intensity over a region of interest equal to the contour-line of the excitation shape at the focal plane (a circle or the dendritic shape). If we define the depth resolution, b, as the full width at half maximum (FWHM) of the intensity profiles, we found, for circular spots, a ratio of about 1:1 between the spot diameter and the depth resolution. Also, we found a significant improvement in axial resolution when the excitation spot is precisely tailored on the base of the fluorescent image (Fig. 1(e)). To excite the same region as in Fig. 1(e) using a circular spot, one would need a holographic excitation spot of ~14μm, such a spot would give rise to a larger depth of focus, b, of ~14μm (vs 9µm, Fig. 2(a)). The use of shaped spots has the further advantage that it precisely targets
Fig. 2. Measured axial profiles of the intensity distribution for the 30, 20, 10µ m diameter spot and the dendritic shape of Fig. 1; (a) without temporal focusing; the grating was replaced by a reflecting mirror. (b) with temporal focusing. (c) Calculated axial intensity distribution for a 1, 2, 5 and 10µ m diameter spot compared to the two limiting cases of Gaussian circular illumination and line illumination, with temporal focusing. Inset: dependence of the calculated depth resolution on the lateral spot size. (d) Experimental (black squares) and theoretical (red solid line) axial intensity distribution profile for a temporally focused Gaussian beam (flat phase). (d) -8 -4 0 4 8 0,0 0,5 1,0 experiment theory Axial Position (µm) N o rm a liz ed Int ens it y (c) 1 µm spot 2 µm spot 5 µm spot 10 µm spot line scanning point scanning -8 -4 0 4 8 0,0 0,5 1,0 No r m a li z ed I n te n si ty Axial Position (µm) 0 8 16 24 32 3,0 3,5 4,0 4,5 D ept h r es o l. ( µ m ) Spot diameter (µm) 30 µm spot 20 µm spot 10 µm spot Shape -40 -20 0 20 40 0,0 0,5 1,0 N o rm al iz ed In te n sit y Axial position (µm) (a) (b) -40 -20 0 20 40 0,0 0,5 1,0 Axial Position (µm) N o rm a liz ed I n te nsi ty 30 μm spot 20 μm spot 10 μm spot shape
the illumination to specific parts of the cell while minimizing ‘unwanted’ photoactivation of other regions. Finally, it is worth mentioning that the use of phase-only optical modulation allows redirecting light on the desired region without loss of power (contrary to intensity-modulation based systems-e.g. DLP devices). This is a key point for 2P excitation, as the low 2P cross section of most of the existing cages and light activate channels requires high power excitation. To full benefit of these advantages, a true 3D sculpting of the excitation volume is desirable and this was achieved by applying temporal focusing, i.e. by placing a diffraction grating at the focal plane of L1, (Fig. 1(a)). In this configuration, we repeated the optical sectioning as described previously for the circular and shaped spot and found for all patterns a similar axial response, with a measured FWHM of 5.5±0.4µm (Fig. 2(b)). The experimental results were verified by full numerical simulations of the optical setup. In these, the generated image on the grating (taken as a complex amplitude) was propagated for a discretized number of frequencies in the pulse spectrum, using the angular spectrum of waves approach, to retrieve the complex amplitude A(x,y,z,ω) at the vicinity of the objective focal plane. These were then Fourier transformed back into the time domain to get A(x,y,z,t) and integrated to obtain the spatially varying two-photon signal ITPEF =
∫
dt A(
x,y,z,t)
4.Calculated depth resolutions for the spots of 10, 20 and 30μm in diameter and the dendritic shape all gave a FWHM of 4.5μm. The difference between theory and experiment was expected, as there are sources of broadening in the experiment (including both aberrations of the objective and a spatial shift between the objective focal plane and the temporal focal plane due to the excitation pulse dispersion). Consistently with experimental finding this value is independent of the excitation spot size and shape. For smaller holographic spots, the depth of focus decreases with the spot size (Fig. 2(c) and inset) reaching a value of 3μm for the smallest spot of 1μm.
The values of depth response calculated for holographic beams in the two extreme cases of 1μm spot and a spot larger than 10μm should be compared with that of unfocused Gaussian illumination in the two cases of point scanning (illumination with a line on the grating; Fig. 2(c) solid black curve) and line scanning (illumination with a circular extended spot on the grating; Fig. 2(c) dashed black curve), respectively. In these limits the depth responses follow:
1 2 int 1 − ⎥ ⎥ ⎦ ⎤ ⎢ ⎢ ⎣ ⎡ ⎟⎟⎠ ⎞ ⎜⎜⎝ ⎛Δ + ≈ R po z z I ; 5 . 0 2 1 − ⎥ ⎥ ⎦ ⎤ ⎢ ⎢ ⎣ ⎡ ⎟⎟ ⎠ ⎞ ⎜⎜ ⎝ ⎛Δ + ≈ R line z z I (1)
where in our case zR~0.8µm, corresponding to a FWHM response of 1.7μm and 2.8μm,
respectively. Indeed, the asymptotic behavior for the 1µm diameter spot approaches the one predicted for point illumination, while for spot diameters greater than 5µm it slightly surpasses the limit of line scan illumination. In both cases the FWHM is slightly larger than the value predicted for Gaussian illumination. There are two reasons for the deviation from these limits on the FWHM response. First, due to the finite back aperture of the objective the excitation spectrum is modified, leading to some broadening of the response around z=0. Second, for holographic illumination of larger patterns the illumination phase varies rapidly in some locations on the grating, on the order of the demagnified diffraction limit of the objective lens. This smears the angular distribution of the colors, resulting in degradation of the depth resolution in the temporal focusing process. In Fig. 2(d) the experimental axial intensity profile for a 10µm diameter Gaussian spot at the objective focal plane, with flat phase (obtained by removing lens L2 and with the SLM turned off) (FWHM 3.2±0.4µm), is shown, together with the corresponding theoretical curve (FWHM 2.8µm). The absence of abrupt phase variation indeed improves the axial confinement of the excitation. These results are summarized in Table 1.
The large phase variation of the illumination beam creates also significant intensity speckle at the image plane, since at some points a significant portion of the excitation light is diffracted outside the back aperture of the objective lens. This is clearly observed on the images of Figs. 1(b) and 1(e). This effect has been already observed for single photon
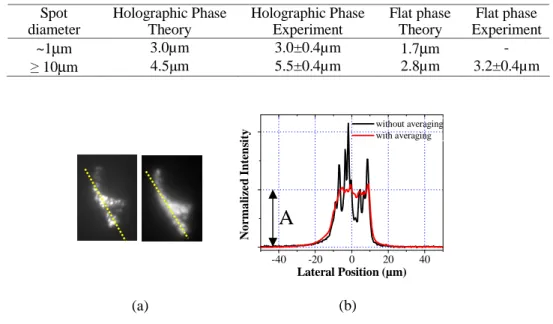
holographic pattern generation [14] and here is reinforced by the quadratic dependence of the fluorescence on the excitation intensity. Although the impact of speckling for many applications is negligible [14], we can reduce this effect by positioning a rotating diffuser after the dispersion grating. By doing so, different realizations of the speckle pattern are averaged and a smoothed excitation spot can be obtained. This is shown in Fig. 3(a) where the images of a spot obtained in a 100ms integration time is compared to the case where a rotating (5 kHz) 0.5º light shaping diffuser (Newport), was positioned ~3cm from the grating, such that the various speckle realizations become uncorrelated. In Fig. 3(b) the corresponding lateral intensity profiles along the yellow lines of Fig. 3(a) are shown. The initial intensity variation around a mean value A of ~50% for the normal spot was reduced to ~10%. Experimental evaluation of the axial intensity distribution of the smoothed excitation shape showed a slight deterioration of axial confinement by about 1µm.
Table 1. Summary of depth resolutions achieved with temporal focusing of the excitation beam
Spot diameter Holographic Phase Theory Holographic Phase Experiment Flat phase Theory Flat phase Experiment ~1μm 3.0µm 3.0±0.4µm 1.7μm - ≥ 10μm 4.5μm 5.5±0.4µm 2.8µm 3.2±0.4µm
Fig. 3. (a) Images (100ms integration time) of a holographic shape visualized by exciting a thin fluorescent layer without (left) and with (right) a rotating diffuser positioned after the dispersion grating. 40 different locations of the diffuser were averaged in the 100 ms of the exposure time. (b) Lateral intensity profile of the excited shape along the yellow lines of Fig. 3(a) right (black line) and left (red line). The intensity variation around a mean value A is ~50% for the black line and is reduced to 10% with the rotating diffuser.
4. Conclusions
In conclusion, we have presented a unique system where the combination of spatial shaping by digital holography with the control of the depth response by temporal focusing allows for generating scanning-less arbitrarily shaped, depth resolved excitation patterns.
To account for the effects on the depth resolution induced by the spatial variations of the holographic-phase, we have presented a theoretical analysis of the holographic beam axial propagation through a dispersive setup for temporal focusing. We show theoretically and experimentally, that despite the rapidly varying spatial phase of an excitation beam generated by digital holography, it is possible to create, in a configuration easily implementable in a biological microscope (i.e. 140fs pulses and high-NA- and long-working distance objective), arbitrary large excitation pattern with a depth resolution of ~5μm, i.e. only slightly larger than that achievable with wide-field temporally focused microscopy with flat phase excitation. This value for pattern dimension exceeding ~10μm is independent on either the size or the
(a) (b) -40 -20 0 20 40 Nor m al iz e d In te n sit y Lateral Position (µm) without averaging with averaging
A
shape of the excitation pattern, as expected for temporally focused illumination. It was verified that rapid phase variations of holographic phase profiles results in spatiotemporal speckle patterns on the excitation spots and also affects their axial confinement, inducing some broadening of the axial intensity distribution. Elimination of speckles is possible with the use of a rotating diffuser placed after the diffraction grating, thus averaging different speckle distributions and getting a smooth intensity profile. This, however, comes at a cost of some further deterioration of depth resolution and exposure time.
The system presented in this work offers the possibility to precisely control the excitation volume in applications concerning two-photon photoactivation, like photolysis of caged compounds and activation of light sensitive ion channels. It is also relevant for other fields where generation of complex depth resolved patterns is required, such as in femtosecond lithography of transparent media and in light microscopy where it is necessary to tailor the excitation patterns, for example to increase imaging rate or to reduce photobleaching. Overall, the combination of digital holography with temporal focusing offers an unprecedented degree of spatial control over multiphoton excitation patterns.
Acknowledgments
The authors would like to thank C. Lutz for helping in the development of the theoretical simulation code, D. DiGregorio and T. Otis for providing the fluorescence picture of the Purkinje cell and for stimulating discussions, N.R. Ben-Haim for his help in fabricating the fluorescent samples and C. Ventalon for critical reading of the paper. This work was supported by the ENI-Net (http://www.eni-net.org/), the ESF and the CNRS through the EURYI program, by the European Commission FP6 Specific Targeted Project "PHOTOLYSIS" LSHM-CT-2007-037765 and by the Israeli Science Foundation (Grant No. 1621/07).