Publisher’s version / Version de l'éditeur:
Vous avez des questions? Nous pouvons vous aider. Pour communiquer directement avec un auteur, consultez la première page de la revue dans laquelle son article a été publié afin de trouver ses coordonnées. Si vous n’arrivez pas à les repérer, communiquez avec nous à [email protected].
Questions? Contact the NRC Publications Archive team at
[email protected]. If you wish to email the authors directly, please see the first page of the publication for their contact information.
https://publications-cnrc.canada.ca/fra/droits
L’accès à ce site Web et l’utilisation de son contenu sont assujettis aux conditions présentées dans le site
LISEZ CES CONDITIONS ATTENTIVEMENT AVANT D’UTILISER CE SITE WEB.
Paper (National Research Council of Canada. Institute for Research in
Construction); no. IRC-P-1823, 1992
READ THESE TERMS AND CONDITIONS CAREFULLY BEFORE USING THIS WEBSITE. https://nrc-publications.canada.ca/eng/copyright
NRC Publications Archive Record / Notice des Archives des publications du CNRC :
https://nrc-publications.canada.ca/eng/view/object/?id=9eeaa689-937a-4e58-995e-2e7288017569 https://publications-cnrc.canada.ca/fra/voir/objet/?id=9eeaa689-937a-4e58-995e-2e7288017569
NRC Publications Archive
Archives des publications du CNRC
This publication could be one of several versions: author’s original, accepted manuscript or the publisher’s version. / La version de cette publication peut être l’une des suivantes : la version prépublication de l’auteur, la version acceptée du manuscrit ou la version de l’éditeur.
Access and use of this website and the material on it are subject to the Terms and Conditions set forth at
The effects of undervoltage on the performance of compact fluorescent
systems
s e r
T H 1 National Research Conseil national
N21
d Council Canada de recherches CanadaB C D G
Institute for lnstitut de
Research in recherche en
Construction construction
The
Effects of Undervoltage on
the Performance of Compact
Fluorescent Systems
by M.J. Ouellette and R. Arseneau
ANALYZED
Reprinted from the Conference Record of the IEEE.lndustr-y Applications Society Annual Meeting Houston TX, October 4-9,1992
VO!. 11. DD. 1872-1879
NRCC 34040
The Effects of Undervoltage on the Performance of Compact Fluorescent Systems
MICHAEL
J. OUELLE'ITE
Member, IEEE
Institute for Research in Construction National Research Council Canada Ottawa, Ontario KIA OR6
Abstract- Compact fluorescent (CF) products are not recommended for undervoltage use. Nevertheless, power demands are increasing and occasional voltage sags and brownouts may become less avoidable. This paper describes the lighting and electrical performance of eleven different types of CF systems operating at 100, 110 and 120 V a c Performance parameters include relative luminous efficacy, active and apparent power consumption, harmonic distortion, power factor and flicker index Economic analysis for the operation of the CF systems at 120 V is also provided.
Electric utilities have generally prided themselves on their ability to deliver dependable, high quality power meeting the performance requirements of their clients [I]. In recent years, the profile of connected equipment to the system has changed. Nonlinear loads proliferate [2.31, and many of them are potentially sensitive to changes in supply voltage [3,4]. Effects of reduced voltage on some nonlinear equipment may include malfunction, inefficient operation, reduced lifetime, and failure to operate. Consequences may range from minor nuisance to great expense [S]. Electrical reserve margins are dropping in some areas
[a,
and brownouts are becoming more common [7,8]. There is an increasing need to understand how all major types of nonlinear loads are affected by reduced supply voltage.Compact fluorescent (CF) systems are increasingly
popular nonlinear loads. They reportedly consume much less
e l e h c i t y and last much longer than incandescent Iamps having cmparabIe luminous output [9]. Many electric utility companies offer rebates on these products as part of their
demand side management
@SM)
programs. Kalinowsky ctal.
[EO]
observed that different fluorescent fighting systems performed differently from each other under reduced supply voltage. Their study did not, however, includeCF
systems.A m h pmgrm [I11 was undertalren by the
National Research Council of Canada
(NRC')
in cooperationwith the Canadian Electrical Association (W) and Energy. Mines and Resources Canada, Centre for Mineral Energy Technology ( E W C M T )
to
study the economic aspects and the lighting and electrical performance ofa
wide range ofdifferent CF systems under a range of operating conditions including reduced supply voltage. The program involves the parlicipation of national lighting research and electrical
metrology laboratories in Canada, the
U.S.,
and abroad. This paper reports some of the results from this program.&JEAN
ARSENEAU
Sr. Member, IEEE
Institute for National Measurement Standards National Research Council Canada
Ottawa, Ontario KIA OR6
IL COMPACT FLUORESCENT SAMPLES
Table 1 describes the
CF
samples studied. They represent a wide range of products currently available. Samples include both T4 and T5 sized lamps (i.e., 10 mm and 15 mm tube diameter). Twin tubes, Quad (Quad.)tubes
and miscellaneous (Misc.) lamp shape configurations were included. Both bare lamps (Exposed) and units with fued or detachable diffusers (Enclosed) were used. The lamps were controlled with either magnetic core (Magnetic) or electronic ballasts. The ballasts were either built into the lamps (Integral), separably wired (Separate), or fued within medium based socket adapters (Adapter).TABLE I
DESCRJPTION OF THIi C F SAMPLES
SAMPLE LAMP RATING BALLAST LAMP BALLAST COST COST 1 Twin, T4.
~ P *
2 Misc., T4. Enclosed 3 Quad. T4. E x P * 4 Misc., T4, Enclosed Quad. T4. k P e d Quad.. T4. Enclosed Quad. T4. Expos=' Twin, T5, Expos=' Quad. T5. Expos=' Quad. T4. Expos* Twin, T4. wo=' Incandescent, T10. Longlife 13W Magnetic. 4.90 15.05 S w t e 16W Magnetic. 21.00 0.00 Integral 20 W Electronic, 26.50 0.00 Integral 18W Integral Elearmic, 26.70 0.00 Magnelic. 9.70 11.00 Adapter Magnetic. 9.70 1850* Adapter Ma- 21.66 34.03 Separate, FIP~ Magnczic, 1833 26.70 Scpara* H P ~ Magnaic. 18.20 8.41 Separate Magnetic. 1200 23.00 Separate Magnetic, 4.90 1268 Adapter 0.88 0.00*includes
cost of detachable globe d t m e r .THD, = x 100%
C -1
where Vh, Ih. and 0 are magnitudes and phase shift of the voltage and current
h
order harmonics. Apparent p e r S and power factor PF were calculated as shown in (6) and (7).It is estimated that the accuracy of the values obtained from (1) through (7) are better than 0.25%.
During the tests, a true RMS multifunction mew with bandwidth of 2Q
IcHt
was used to independently monitor the values of voltage. c m n l and consumed active power of thelamps under tests. Readings from this multimeter are rnt
specifically tepor&d in this paper but agreed with the
computed values from (1) through (7) for
all
test condilions. Illuminance measurements from the three lamps undernests were collected horizontally with an illuminance photometer at n Imtion equidistant from each lamp in
a
planeof
1 m below the lowest point of the lamps. The illuminance phommeter was calibrated against the responses of a portable specmoradiometer for each of the different CF samples [14]. The procedure corrected for inexact matchesbetween photometer relative spectral responsivity and human specval luminous efficiency [15].
Luminous flicker of the CF samples was measured with
a
silicon pin diode of rise time c 80 ns. The diode was sampled at 20 kHz by a 12 bit A/D board under computer control. For one lamp of each sample, the computer stored 1000 values of instantaneous relative luminous intensity throughout 3 complete cycles of supply voltage. A program later calculated flicker index, FI, as follows:where LA is the area above the mean of the relative luminous intensity waveform and LT is the total area under the same waveform [16,17]. FI ranges from 0 to unity with 0 for steady light output
N. RESULTS AND DISCUSSION
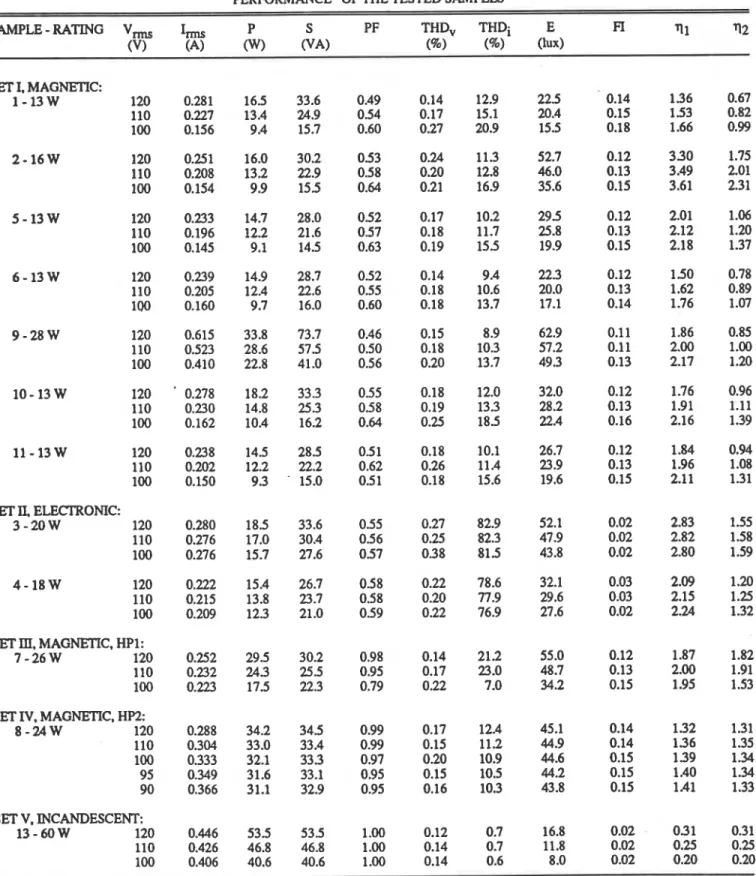
The results of the tests are summarized in Table I1 and Fig 2. The measurements of c w n t , active power, apparent power, and illuminance in Table 11 are one third of the measured quantities. This represents values for one lamp in each 3-lamp sample tested. The samples are grouped in the Table into five sets (Set I to Set V) in accordance with observed similarities in their electrical performance. determined mainly by the ballast characteristics.
All
CF
lamps consumed less paver than he referenceincandescent sample, although not necessarily
as
low as theme.
lamp wattages. Discrepancies between observed system wattages and rated lamp wattages were due, in part, to ballast power consumption-
an important parameter in the economics of compact fluorescent lighting,The
CF
systems all consumed more apparent power Sthan active power
P.
The drfferences were much greater forthe samples with ballasts lacking power factor correction
circuits. TRe dtstinction between S and P is important. Residential energy meters measure only P, a value direcdy related to the costs of producing the energy consumed. Large
utilily cusmmers, however, are billed not only to cover the costs of the energy production but also to recover the high capital costs associated with h e delivery of the highest energy demand. In Canada, it has become common pracdce to use S rather than P for demand billing purposes. Consequently, two indices of relative luminous efficacy are presented in this paper. The frst, q 1, is given in units of lux per watt The second, q2. is in lux per VA.
The flicker index of all magnetically ballasted CF samples was 0.1 1 to 0.14 at 120 V and increased by no more
than 0.03 under reduced voltage. In comparison, warm white, white. cool white, and daylight fluorescent lamps have, respectively, flicker index values of 0.05, 0.06, 0.08, and 0.12, corresponding LO 20%. 25%. 34% and 509'0 peak-to-
pcak modulation [17]. Fhcker from these sources, when operated on 60 Hz supply, is generally not perceptible to the majority of people unde~ static visual conditions [17], However. rapidly moving stimuli may appear slightly blurred or stroboscopic when flicker index approaches the higher magnitudes observed in this study
[lS].
Wilkins and colleagues 1191 suggest lhar a very smdl portion of pcoplemay respond unfavourably to the 40% peak-to-peak modulation of a mixture of cool white and white fluorescent lamps operated on 50 Hz British supply. In a double-blind cross-over experiment involving approximately 150 workers in a govmment office building, twice as many headache and eyestrain compIainb were tallied (191 when the light flickered within the magnitude observed in the prescnt study. The researchers cautioned that only a small number of their subjects reported adverse effects while experiencing the pulsating illumination over a period of 19 weeks.
All the CF samples were designed to operate at 120 Vac
and had power ratings of 13 to 28 W. The retail cost of each lamp and ballast combination ranged from 17 to 55 Canadian dollars. Sample 13, a tube shaped white frosted incandescent lamp, served as a reference sample. It was approximately the same physical size as the Quad-shaped CF samples. The ballasts of samples 7 and 8 included high power factor correction (HP) circuits. In addition, the latter included a constant-illumination circuit. Sample 12, a
DC
unit, was not considered for this paper.Each sample consisted of a group of seven new lamps and ballasts aged and stabilized for approximately 100 h. During the aging period, the seven lamps were mounted base-up and powered together at room temperature at 120 V.
Their relative luminous intensity, voltage, current, wattage, and power factor were monitored until stable. After aging. a
fmal selection of three lamps from each sample were chosen
for evaluation under different sinusoid supply voltages and distorted waveforms [12].
III. PROCEDURES
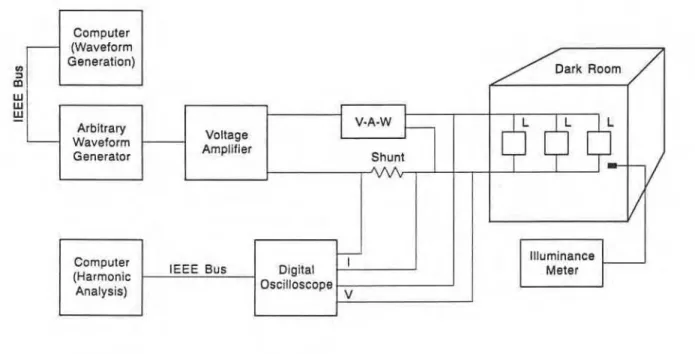
A diagram of the test system is shown in Fig. 1.
Procedures and equipment were identical to those described elsewhere [12] except that the present study employed only sinusoid waveforms of 120. 110, and 100 V rather than waveforms of varying harmonic content. Test voltages were provided by a system consisting of a personal computer, a digital arbitrary waveform generator (ARG) and a voltage amplifier [13]. The required voltage conditions were entered from the computer keyboard. A program loaded the sinusoid waveform into the ARG. The output of the ARG was then amplified and supplied to the three lamps under tests for each sample. Technical characteristics of this low impedance
system are conservatively estimated as follows: harmonic distortion c 0.5%. stability better than 0.002% over 15 min, amplitude resolution 0.1 %.
For the tests, all lamps were mounted base-up in a uniform circular arrangement of radius 60 cm. They were enclosed within a dark room to eliminate stray light. The dark room was ventilated hom above by natural convection. Ambient temperature in the mrn was monitored during the tests. Following stabilization, the lamps were tested at room temperature for a pure sinusoid waveform of I20 V then again under the series of reduced voltages. The lamps were then re-tested at 120 V to ensure reproducibility. Repeated
measures typically agreed to within 1%.
A calibrated 12 bit dual channel digital oscilloscope
@SO) was used to record the voltage and current waveforms of the lamps under tests. The recorded waveforms were later transferred via E E E Bus to a computer for harmonic analysis and calculation of the electrical quantities shown in Table 11. The sampling clock of the
DSO
was synchronized with the test voltage waveform. The harmonic content of the recorded waveforms was limited to 100 harmonics. The sampling frequency was therefore set at 1024 times the fundamental frequency - an order of magnitude greater than the maximum harmonic frequency.The rms values of supply voltage V and current I,, active power P, voltage total harmonic %:tortion THD, and current total harmonic distortion TKD- were calculated direcdy from the harmonic components o&ained with a Fast
Fourier Transform of the recorded waveforms. These quantities are calculated as follows:
I
Computer1
Fig. 1. Diagram of the test system
01 3 m W W W
-
-
(Waveform Generation) Arbitrary Waveform Generator Dtgital Oscilloscope Computer (Harmonic Analysis) Voltage Amplifier IEEE Bus V-A-WTABLE LI
PERFORMANCE* OF THE TESTED SAMPLES
SAMPLE-RATING V,
I,,
P S PF THD, THDi E FI q 1 q2(V) (A) (W) (VA) (%) (lux)
SET I. MAGNETIC: 1-13W 120 0.281 16.5 33.6 0.49 0.14 12.9 22.5 0.14 1.36 0.67 110 0.227 13.4 24.9 0.54 0.17 15.1 20.4 0.15 153 0.82 100 0.156 9.4 15.7 0.60 0.27 20.9 15.5 0.18 1.66 0.99 SET
IL
ELECI'RONIC 3-20W 120 0.280 18.5 33.6 0.55 0.27 82.9 52.1 0.02 2.83 1.55 110 0.276 17.0 30.4 0.56 0.25 82.3 47.9 0.02 2.82 1.58 100 0.276 15.7 27.6 057 0.38 815 43.8 0.02 2.80 1.59SET IV. MAGNETIC, HP2:
8-24W 120 0.288 34.2 345 0.99 0.17 12.4 45.1 0.14 132 1.31 110 0.304 33.0 33.4 0.99 0.15 11.2 44.9 0.14 1.36 1.35 100 0.333 32.1 333 0.97 0.20 10.9 44.6 0.15 139 1.34 95 0.349 31.6 33.1 0.95 0.15 10.5 44.2 0.15 1.40 1.34 90 0.366 31.1 32.9 0.95 0.16 10.3 43.8 0.15 1-41 1.33 SET V, INCANDESCENT: 13
- 60
W 120 0.446 53.5 535 1.00 0.12 0.7 16.8 0.02 031 0.31 110 0.426 46.8 46.8 1.00 0.14 0.7 11.8 0.02 0.25 0.25 100 0.406 40.6 40.6 1.00 0.14 0.6 8 .O 0.02 0.20 0.20*
V-,h,
P, S, PF, THD,, THDi are electrical parameters given by (1) through (7), E is illuminance in lux, FI isflicker index given by (B), and '11 and 512 are relative luminous efficacies in lux per watt and luxper VA, respectively. HP1 and HP2 are high power factor ballasts, the later of a type providing nearly consfant illuminance.Nevertheless, where the needs of this minority group is a concern,
CF
lamps should only be operated with high fkquency ballasts. The electronic ballasts of Set I1 were of this kind. 'Ihey gave flicker index values between 0.02 and 0.03-
approximately the same given by incandescent lamps (Set v).A. Set I (mametic ballasts with no wwer factor correction) These samples delivered decreasing illuminance and consumed decreasing power (P and S) as voltage was reduced below the rated value of 120 V. For example,
a 17%
voltagedrop gave a 29% drop in illuminance and a 388 drop in
active power consumption. Most notably, relative efficacy
(q
,
in lux per wan) ,increased nearly pporlionately with vofrage reductions. Lines of 1 : 1 and -1: 1 proportionality areshown dashed in Fig. 2. When defined in twms of 72 in lux
per VA, relative efficacy incrasd at yet
a p e r
rate. Thismay appear significant from the point of view of utility
DMS
programs, however the gains in relative efficacy occurred at
the expense of increased power factor and harmonic
distomon
(Fig. 3). On average, power factor i n dfromapproximately 0 5 to 0.6 and TEDi inaRased
from
approximately 11% to 17% when supply voltage dropped
from 120 to 100 V. Xn addition, one iamp manufacturer cautions that their products
are optimized in terms
of theopposing paramem of lamp life and efficacy. Where this is
the case, expected lifetime may decrease ander reduced supply voltage.
B,
Set II (electronic ballasts with no Dower factor correction) At 120 V, relative efficacies were generally, but not univedly, higher than those of Set I. C o n w to the samples in Set I, illuminance and power consumption of theSet II samples decreased at approximately the same rate in response to reduced supply voltage. This gave nearly constant efficacy as a function of voltage. Current harmonic
distortion remained at approximately 80% of m s and
d~reased by onIy 1
or
2 percentage points under the reducedvoltage conditionsSower factor was approximately 0.57, and, like THDi
,
remained approximately independent of supplySET l
SET II
SET Ill
SET IV
SET V
(MAGNETIC) (ELECTRONIC) (HIGH PF 1)
(HIGH PF 2) (INCANDESCENT)
%
CHANGE IN SOURCE VOLTAGE, RELATIVE TO 120 V CONDITION
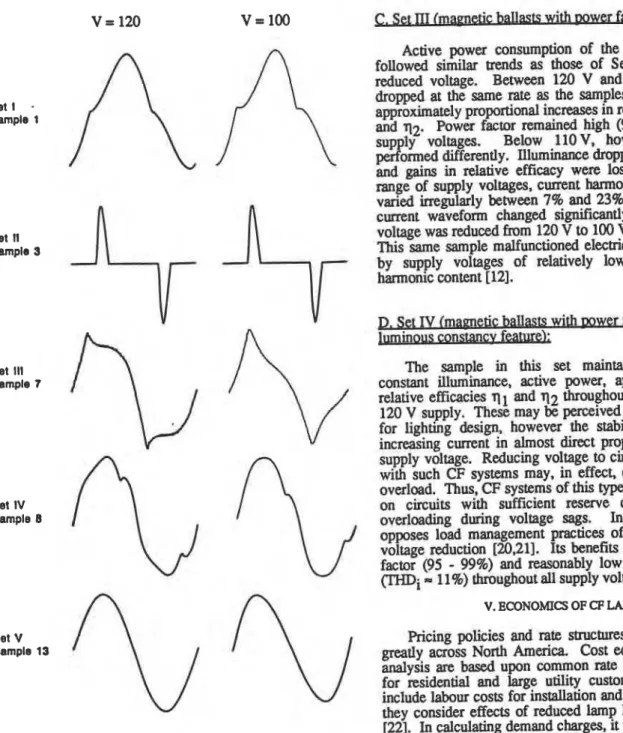
Fig. 3. Current waveforms for a typical sample from each set
voltage. The high
relative
efficacies of these samplesoffer
ahigh potential for energy conservation, whether m e a d in terms of active or apparent power. They
are
"utility friendly"in regards
to
consuming powerin
direct -don to supplyvoltage. On the other hand, the samples tested gave generally low power factor and high harmonic distortion -parameters
of concern to utility companies.
Active power consumption of the sample in this stt
followed similar trends as those of Set I in response to
reduced voltage. Betwcen 120 V and 110V, illuminance
dropped
at
the sameraw
ss
the samplesof
Set I and gaveapproximately proportional increases in relative efficacies 11 1
and ~2 Power factor remained high (95
-
97%) at these supply voltages. Below llOV, however, the sampleperformed differently. Illuminance dropped at
a
greater rate,and gains in relative efficacy were lost. Throughout the range of supply voItages, current harmonic distortion THDi
varied imgularly between 7% and 23%. The shape o f the
current waveform changed simcantly when the supply
voltage was reduced from I20
V
to 100V
as shown in Fig. 3, This same sample malfunctioned elecaically when poweredby supply voltages of relatively low ('EDv = 4.6%)
hmnonic content [ 121.
p.
SetN
m e t i c ballasts with tmwer f - e luminou~nstancv f-The
sample in this setmaintained
approximaElyconstant illuminance, active power, apparent power, and reiative efficacies 91 and q2 thrwghout the range o f 90 to
120 V supply. Thwe may be perceived as desirable features for lighting design. however the stability is achieved by increasing current in almost direct proportion to decreased supply voltage. Reducing voltage lo circuits heavily loaded with such CF systems may, in effect. cause the circuits
m
overload. Thus,
CF
systems of this type should only be used on circuits with sufficient reserve capacity to prevent overloading during voltage sags. In short, this sample opposes load management practices of reducing power by voltage reduction [20211. Its benefits includes high powerfactor (95
-
W%)
and reasonably low harmonic distortionmi
= 11%) throughout all supply voltages.V. ECONOMICS OF CF LAMPS
Pricing policies
and ratt structurts
for electricity vary greatly across North America Cost equations usedin
thisanalysis are hased upon common rate structures in Canada
for residential and large utility customers.
They do
not include labour costs for instahtion and maintenance, nor dothey consider effects of reduced lamp life due to switching
(221. In calculating demand charges, it was assumed that the CF systems were on at the time of
jmk
demand.Table
III
summarizes the results of an economic analysisfor
theoperation of
11CF
sampIesat mom
twnpenuurtunder sinusoid, 120 V supply.
The
analysis introduced cost per 100 lux of illumination. The normakation was necessary since not all retrofit options provided thesame
quantity of iUumination. Representing costs in this mannergave
a
more accurate indication of the relative economic merits of the different systems.Comparable economic analyses for undervoltage
TRes.' xE E [R.C. + (
P
Bv
D )1
(I11 situations are less relevant since such power disturbances areI
usually temporary in nature [23-241. In addition, insufficient T~om.'
-
1 0 0 1 u x [ ~ . ~ .+
( P X ~ O - ~ X B ~ X D ) + information is available on the potentially costly effects ofE
reduced supply voltage on lamp and ballast life. ( S X X Bd X D/d ) ] (12)where TABLE
m
I
TRes. total cost to residential customer for D hours of OPERATINO COST FOR D = 1O.MW) AND 20,004 HOURS1
Tcom, total cost to large customer for D hours of 100 lux 100 lux illumination; D=10,000h D = 20,WO h illumination;D duration of illumination under analysis, in h; SAMPLE nl nb T ~ e s . T~om. "1 "b T ~ e s . T~om. P active power, in watts;
S apparent power, in VA: 1 1 1 134 139 2 1 204 214
E
illuminance, in lux: 2 1 0 61 63 2 0 123 127B billing rate for active power, residential, in $/kwh; 3 1 0 75 77
B
:
Wilingrate
for active power, large clients,
in2 0 150 153
$kwh:
4 1 0 119 121 2 0 238 242demand billing rate, in $/peak kVA; 5 1 1 106 110 2 1 175 181
2
demand billing cycle, in h; 6 1 1 173 177 2 1 263 272R.C. retail cost of lamps and ballasts per socket during 7 1 1 139 138 2 1 216 214
the period of interest, D; where R.C.
=
(C1 x nl)+
8 1 1 153 152 2 1 246 244(Cb X nb);
C1 retail cost of a lamp, in $; 9 1 1 80 85 2 1 147 157
Cb retail cost of a ballast, in $; 10 1 1 159 162 2 1 241 248
n1 number of lamps needed per socket during the 11 1 1 109 113 2 1 168 176
period, D; where nl is the greater of unity or 13 1 0 228 223 2 0 456 446
(OIL1):
nb number of ballasts needed per socket during the A19 4 0 131 128 8 0 262 256 period, D; where nb is the greater of unity or
( D I L
1:
L1
life of tamp, in h; Table IIl applies specifically to the lighting conditionsL
life of ballast, in h; studied: e.g., workplane located near the floor of a black18-3 converu watts and VA to k~ and ~ V A . room. 1 m below the lamps, mounted base up. (11) and (12) do not apply absolutely to other ?ighting E uations
conditions since illumination quantity depends upon such For
m*
= $0.07/kwh; Bcp = $0.06/kWh; Bd = factors as the size and reflectances of walls and other surfaces$6 per peak ~ V A ev%y d = 720 h (i.e., 30 days); C1 and Cb within the room. They may be generalized for other were taken from Table I; P, S, and E were taken from Table applications as follows.
XI.
For comparison purposes, costs of operation for aconventional A19,60 W, 120 V, 2500 h incandescent lamp Substituting E = a 1 x CU/ A into (11) and (12) where were derived from the results observed for sample 13.
Illuminance, E, for the A19 lamp were taken as twice that for total luminous flux emitted by the CF system, in Sample 13 based upon luminous intensity measurements of lumens;
both samples, sequentially, in a 1 diameter integrating CU Coefficient of Utilization, the ratio of luminous sphere. flux received on workplane to the total luminous
flux emitted by the given lamps [17]: The operating costs in Table 111 for residential and large A workplane,
in
m2utility customers do not differ greatly from each other.
Under the residential rate smcture considered. CF Sample 1 and substihlting R.C.= [ ( C1
I
L~ ) + ( Cb Lb )1,
thenwould not quite pay for itself in its fmt 10,000 h of operation rearranging gives when compared to the cost of an A19 lamp. Sample 2, under
the same conditions, would reach its breakeven within the T ~ e s .
=
-
fmt 10,000 h thus resulting in a net savings to the customer.
q
cu/A LCI&+
CdLb+
(P X x B d ] (13) In total, six of tenCF
samples (Samples 2,3,4.5, 9 and 11)would reach their break even int during the fmt 10,000 h
P
%om.--
of operation. Four of them ( ample~ 1,7,8. and 10) would-
loo
[cl&
+
c & ~
+
(P xx
Bcp)+
achieve it during the second 10.000 h of operation. Sample 6q
CU/A ( s x ~ o ~ x B ~ / ~ ) ] (14) would only achieve it within its third 10,000 h of operation.In recent years, the occurance of voltage sags and brownouts in power systems has increased. As a consequence,
CF
lamps are increasingly likely to be installed in locations med by occasional low supply volta e. It is therefore imponant to understand thepe
r! ormance characteristics of operatingCF
systems under these less-than- ideal situations.Four eeneral sets of luminous and electric ~erformance characteriSs'iics were identitied, based upon the Gst results of the CF svstems studied. The behaviour oatterns were detennind mainly by the choice of ballast; whither magnetic or electronic, and whether wwer factor correction clrcuits were employed. The pn'sion of a constant illumination circuit affected performance in a manner counter to load shedding practices of reducing power by mans of voltage reduction. This phenomenon may be directly relevant to electric utility companies when modelling loads.
Economic analysis showed that six of the eleven CF samples would reach their break even point during the first 10,000 h of o tion, i.e., their rated lamp life. Four would achieve it wiK20.000 h of operation. The remaining CF system would achieve it in the t h i i 10,000 h cycle.
ACKNOWLEDGEMENTS
Ms.
Jana
Svec is thanked for technical support. The research was made possible through the fmancial assistance of both the C a n a h Electrical Association (CEA), and Energy Mines and Resources Canada Centre for Mineral and Energy Technology (EWCANMET). The CEA project is entitled "The Evaluation of Compact Fluorescent Lamps for Energy Conservation (CEA 9038 U 828)." Mr. Michael Henville. Mr. Andrk. Lapemh andMr.
Paul Wasneyare
thanked for their involvement in monitoring the CEA project,as
are Mr. Peter Gelineau and Mr. Harvey Douglas for their contributions as CEA Project Engineers.I71 M. Wilson. J.D. As es. R P . Menitt, and B.D. Spell. "Rural facility electric power FZ& enhancwnenI," Alaska DepL Trnnspon and
h b l i c ~di!ies%ch. ~ e p . AK-RD41-I1.1991.
191 J. Qlerfas. "Skeptics md visimaries warnine energy savings,"
S&xs VOL 251, pp. 154-156, Jan. 1991.
[I01 S. Kalinowsky! 1. Manello. M. E m , and A. Yee. "Hmollic mtcnt and illummauon chanctcristics vs. voltage
flumscmt lighring gystems," in cc. 1991
Ill1 MJ. OueUetrq, R e c p e a u , M. Simiuovitch, and SJ. TM&, "New gram for lnvcsugamg thc pedomance of ampa? fluorescmt &ring systems," in
mpp.le9s-1-
R. Anncau and P. Filipski. " umum maning s s l m r for l a d s with high hanonic dirtortim."?i%l;adian Elccvlcal lssoc., Manlrral,
Quc.. Tech. Rep. 043.D.610.1988. MJ. OueUette. "Phaaneuic c m n
CIE Technical Committee TC-1.4. "tight as a m e visual quantity:
M C ~ les of measurement," Cwmirsim intematimalc de 1'6cldrage,
!
a m..%
rance,Tech. Rep. 41,1978.A.A. Easman and J.H. Campbell, "Suobor ic and Ilickcr effecu f m n fluonescent lamps," -, voL x~%,p.27, an. 1952. J.E. Kaufman and J.F. Christensen (cds.).
. .
&,
-Nwe Yo&.NY:IUm. -nE
M.S. Rea, and M.J. Ouellettc. "Table-tmnis under high intensity discharge (HID) lighting," Ll&n. be. Sm.voL17.no.I, pp.29-35. AJ. Wilkins. I. N h o - S m i t h , A.L Slnter,, and L. Bedocs. "Elurnscent lighring, headaches and eycsuain."
~ ~ 0 1 . 2 1 , n o . l . p p . l l - 1 8 . 1 9 8 9 .
REEERENCES 1201 S.V. Vadsri and S.V. V d a t a , "Expert Load shedding: a hybrid load shedding expert s stem in the real-!he EMS e n h c n t , " in Tomto: O ~ L : Ontad0 90 lOth power &atems Comoursums Spnfermy; pp.929-35.
. .
121 M. Samuyj, "Power quality mdr: today's concerns and fumn I211 H. Salehfar and A.D. Pmm. "A pmductim w s h g methodology for
aliw '89 h. 1989 1st evaluation of direct load conuol," Trans
0pportlmUlu." in power Ou
.
Power S v s m , voL 6.w.74-n. no. 2.pp.278-84, Eeb. 1991.
--
1221 L.A. Camhe and M.S. Rea. "Emngniu of switchin fluoresmt
[31 T.S. Key. RJ Emnro, and R.W. Taylor, "Electric power forethe Zlat
anuuy: changing loads -changing needs," in lamps," v0L24~no.3. M a y h 1888. 1 9 8 9 p p . 5 8 - 7 3 .
141 K.B. Bowcs. "The dfgLc pf wer line d i s m h c e d on elearmic products." in Power Ouahtv 8 9 F m . i989 Is1 Intern. cPnf, pp.210-3 . .
I51 L. L a m y . W.M. Smith. M. SamoIyi md H. Mchrs, "Pmblems with powcrqlliluy.