ARTICLE
Longitudinal analysis of impulse control
disorders in Parkinson disease
Jean-Christophe Corvol, MD, Fanny Artaud, PhD, Florence Cormier-Dequaire, MD, Olivier Rascol, MD,
Franck Durif, MD, Pascal Derkinderen, MD, Ana-Raquel Marques, MD, Fr´ed´eric Bourdain, MD,
Jean-Philippe Brandel, MD, Fernando Pico, MD, Lucette Lacomblez, MD, Cecilia Bonnet, MD, Christine Brefel-Courbon, MD, Fabienne Ory-Magne, MD, David Grabli, MD, Stephan Klebe, MD,
Graziella Mangone, MD, Hana You, MD, Val´erie Mesnage, MD, Pei-Chen Lee, PhD, Alexis Brice, MD,
Marie Vidailhet, MD, and Alexis Elbaz, MD, For the DIGPD Study Group Neurology
®
2018;91:e189-e201. doi:10.1212/WNL.0000000000005816Correspondence Dr. Corvol jean-christophe.corvol@ aphp.fr
Abstract
ObjectiveTo investigate the longitudinal dose-effect relationship between dopamine replacement therapy and impulse control disorders (ICDs) in Parkinson disease (PD).
Methods
We used data from a multicenter longitudinal cohort of consecutive patients with PD with≤5 years’ disease duration at baseline followed up annually up to 5 years. ICDs were evaluated during face-to-face semistructured interviews with movement disorder specialists. Generalized estimating equations and Poisson models with robust variance were used to study the association between several time-dependent definitions of dopamine agonist (DA) use, taking dose and duration of treatment into account, and ICDs at each visit. Other antiparkinsonian drugs were also examined.
Results
Among 411 patients (40.6% women, mean age 62.3 years, average follow-up 3.3 years, SD 1.7 years), 356 (86.6%) took a DA at least once since disease onset. In 306 patients without ICDs at baseline, the 5-year cumulative incidence of ICDs was 46.1% (95% confidence interval [CI] 37.4–55.7, DA ever users 51.5% [95% CI 41.8–62.1], DA never users 12.4% [95% CI 4.8–30.0]). ICD prevalence increased from 19.7% at baseline to 32.8% after 5 years. ICDs were associated with ever DA use (prevalence ratio 4.23, 95% CI 1.78–10.09). Lifetime average daily dose and duration of treatment were independently associated with ICDs with significant dose-effect relationships. Similar analyses for levodopa were not in favor of a strong association. ICDs progressively resolved after DA discontinuation.
Conclusion
In this longitudinal study of patients with PD characterized by a high prevalence of DA treatment, the 5-year cumulative incidence of ICDs was≈46%. ICDs were strongly associated with DA use with a dose-effect relationship; both increasing duration and dose were associated with ICDs. ICDs progressively resolved after DA discontinuation.
ClinicalTrials.gov identifier: NCT01564992.
RELATED ARTICLE
Editorial
Don’t ask, don’t tell: Impulse control disorders in PD
Page 107
MORE ONLINE
Podcast
Dr. Jason Crowell interviews Dr. Alexis Elbaz about his paper on impulse control disorders in Parkinson disease.
NPub.org/9mi9i9
From the Assistance Publique Hˆopitaux de Paris (J.-C.C., F.C.-D., L.L., C.B., D.G., S.K., G.M., H.Y., A.B., M.V.); Sorbonne Universit´e (J.-C.C., F.C.-D., L.L., C.B., D.G., S.K., G.M., H.Y., A.B., M.V.); INSERM (J.-C.C., F.C.-D., L.L., C.B., D.G., S.K., G.M., H.Y., A.B., M.V.), Institut du cerveau et de la Moelle, Centre d’Investigation Clinique Neurosciences, NS-PARK/FCRIN Network; CNRS (J.-C.C., F.C.-D., L.L., C.B., D.G., S.K., G.M., H.Y., A.B., M.V.); Departments of Neurology and Genetics (J.-C.C., F.C.-D., L.L., C.B., D.G., S.K., G.M., H.Y., A.B., M.V.), Hˆopital Piti´e-Salpˆetri`ere, Paris; CESP (F.A., A.E.), Faculte de m´edecine, Universit´e Paris-Sud; Faculte de m´edecine (F.A., A.E.), UVSQ, Institut National de la Sant´e et de la Recherche M´edicale, Universit´e Paris-Saclay, Villejuif; University of Toulouse 3 (O.R., C.B.-C., F.O.-M), Centre Hospitalo-Universitaire de Toulouse and INSERM; Centre d’Investigation Clinique CIC1436 (O.R., C.B.-C., F.O.-M), NS-PARK/FCRIN Network, D´epartements de Neurosciences et de Pharmacologie Clinique, NeuroToul COEN Center, Toulouse; Department of Neurology (F.D., A.-R.M.), NS-PARK/FCRIN Network, Centre Hospitalo-Universitaire de Clermont-Ferrand; Department of Neurology (P.D.), NS-PARK/FCRIN Network, Centre Hospitalo-Universitaire de Nantes; Department of Neurology (F.B.), Hˆopital Foch, Suresnes; Department of Neurology (J.-P.B.), Fondation Rothschild, Paris; Department of Neurology (F.P.), Centre Hospitalier de Versailles; Universit´e Versailles Saint Quentin en Yvelines et Paris Saclay (F.P.), Versailles; Department of Neurology (V.M.), Centre Hospitalo-Universitaire Saint-Antoine, Paris, France; and Department of Health Care Management (P.-C.L.), College of Health Technology, National Taipei University of Nursing and Health Sciences, Taiwan.
Go to Neurology.org/N for full disclosures. Funding information and disclosures deemed relevant by the authors, if any, are provided at the end of the article. Coinvestigators are listed at links.lww.com/WNL/A577.
Copyright © 2018 American Academy of Neurology e189
Impulse control disorders (ICDs) are behavioral disorders characterized by the failure to resist an impulse and unsuccessful attempts to control specific behaviors.1
ICDs are common in Parkinson disease (PD),2–4including pathologic gambling and compulsive shopping, eating, and sexual behaviors, but addi-tional related behaviors have been described, e.g., hobbyism and hypercreativity.1,5–7ICDs may lead to seriousfinancial, legal, or psychosocial consequences.
Dopamine agonists (DAs) represent their main risk factor.4–6,8–11 While the frequency of ICDs is similar to that in the general population of patients with untreated de novo PD, their fre-quency increases after DA initiation.3 It is unclear, however, whether a dose-effect relationship exists. While some studies found an association between DA dose and ICDs,2,9,12,13others did not.4,14
The main limitation of previous reports is their retrospective or cross-sectional design. There are few longitudinal studies of ICDs of relatively small sample size and short follow-up (FU).3,9,15–18Larger longitudinal studies are needed to esti-mate the risk of ICDs and to examine dose-effect relations for DAs. As part of a multicenter longitudinal cohort of patients with PD followed up annually up to 5 years, we estimated the cumulative incidence of ICDs and studied their association with dopamine replacement therapy.
Methods
PatientsThe Drug Interaction With Genes in Parkinson’s Disease (DIGPD) study is an ongoing longitudinal cohort study of patients with PD consecutively recruited from May 2009 to July 2013 in 4 French university hospitals and 4 general hospitals. Eligible patients were patients with PD (UK Par-kinson’s Disease Society Brain Bank criteria) with ≤5 years’ disease duration at recruitment. After the baseline visit, annual clinical evaluations were performed over 5 years by movement disorders specialists who checked whether patients fulfilled UK Parkinson’s Disease Society Brain Bank criteria at each visit andfilled out standardized questionnaires.
Standard protocol approvals, registrations, and patient consents
The study was sponsored by Assistance Publique Hˆopitaux de Paris, approved by French regulatory authorities and an ethics committee, and conducted according to good clinical practices.
All patients gave written informed consent (ClinicalTrials.gov NCT01564992).
ICDs and related behaviors
At each visit, symptoms of dopaminergic dysregulation in different activities (eating, buying, hobbies, gambling, sex, creativity) were evaluated by movement disorders specialists during face-to-face semistructured interviews for the diagnosis of compulsive gambling,19buying,20 eating,19sexual behav-ior,6 hobbyism,5 and creativity.7 ICDs are defined by a di-agnosis of compulsive gambling, buying, eating, or sexual behavior; in sensitivity analyses, we included hobbyism and hypercreativity. We did not include compulsive use of dopa-mine drugs and punding because they may have different neural substrates and risk factors from typical ICDs.21 We assessed Movement Disorder Society Unified Parkinson’s Disease Rating Scale (MDS-UPDRS) part I; item 1.6 evaluates dopaminergic dysregulation (data available from Dryad, Meth-ods, doi.org/10.5061/dryad.qv4kq75). In sensitivity analyses, we examined the association of DAs with a 3-level definition of ICDs that takes severity into account (none, slight, mild or greater). MDS-UPDRS was assessed before interviews for the diagnosis of ICDs, and both were evaluated before treatment interviews. We did not use other PD-specific tools (Questionnaire for Impulsive-Compulsive Disorders in Parkinson’s Disease– Rating Scale,22 Ardouin Scale23) that were not available or validated when this project started.
Covariates
Baseline characteristics included age, sex, education, marital status, and weight/height. Patients were interviewed about smoking, alcohol intake, and coffee drinking. At each visit, cognitive function was assessed with the Mini-Mental State Examination. Disease severity was assessed with MDS-UPDRS (parts I–IV) and Hoehn and Yahr scales.
At baseline, the full history of antiparkinsonian drug use since disease onset was obtained from medical records and pre-scriptions, including start/end dates of all drugs and the doses prescribed. At subsequent visits, the history of all prescriptions since the previous visit was obtained. DA and levodopa (LD) doses are expressed in LD equivalent dose.24
Statistical analysis
Individuals whose diagnosis changed over FU and those with missing covariates were excluded. Because we included patients
Glossary
CI= confidence interval; DA = dopamine agonist; DBS = deep brain stimulation; DIGPD = Drug Interaction With Genes in Parkinson’s Disease; ER = extended-release; FU = follow-up; GEE = generalized estimating equation; ICARUS = Impulse Control Disorders and the Association of Neuropsychiatric Symptoms, Cognition and Quality of Life in Parkinson Disease; ICD= impulse control disorder; LD = levodopa; MDS-UPDRS = Movement Disorder Society Unified Parkinson’s Disease Rating Scale; PD = Parkinson disease; PR = prevalence ratio; QIC = quasi-information criterion.
with short disease duration at baseline, none had deep brain stimulation (DBS); 3 patients had DBS over the FU and were censored at the time of DBS.
Patients’ baseline characteristics were described overall and according to DA use in the previous 12 months and baseline ICDs. We used discrete-time survival analysis to estimate the cumulative incidence of ICDs at each visit in patients without ICDs at baseline, overall and according to ever DA use. We used generalized estimating equation (GEE) models to study the association between DA and the prevalence of ICDs at each visit. GEE models take into account the within-individual correlation in exposures and outcome due to repeated measures. We chose this approach to use all available data because ICDs are not permanent and can resolve and reappear. ICDs represent a common outcome, and logistic models yield odds ratios that overestimate prevalence ratios (PRs). We therefore used Poisson regression with robust variance that provides valid estimates of the PR and 95% confidence intervals (CIs).25,26
PRs represent the ratio of the prevalence of ICDs in exposed and nonexposed patients at each visit.
Variables characterizing DA use were included in the models as time-dependent variables updated at each visit. Different models were considered on the basis of different definitions of DA use:
1. DA use in the past 12 months: we compared the prevalence of ICDs in users and nonusers, categorized users according to whether their average daily dose was below or above the median, and included average daily DA dose as a continuous variable.
2. Ever DA use (i.e., since DAs were started until the corresponding visit): we considered the same models as above. Dose-effect analyses are based on average daily dose since DAs were started.
3. Cumulative duration of DA use (3-level or continuous variable).
4. Cumulative DA dose (3-level or continuous variable). 5. Thefinal model includes both average daily DA dose (since
DAs were started) and cumulative duration as continuous variables.
Analyses were performed overall and restricted to DA users. For continuous variables, we examined whether there was departure from linearity by including restricted cubic splines and testing whether they improved modelfit.
For each model, we computed the quasi-information criterion (QIC).27Its minimum value identifies the model that offers an optimal tradeoff between goodness of fit and parsimony; a difference of ≥4 between 2 models is deemed relevant.28
Models were adjusted for sex, baseline age and disease duration, education, marital status, and ever LD use (time-dependent
variable). Time since recruitment into the study was modeled as a linear term (a quadratic term was not significant). Significant 2-way interactions between covariates and time were retained in the models.
We used the same approach to examine associations between other antiparkinsonian drugs and ICDs (adjusted for DAs). To examine the effect of DA discontinuation, we identified patients with ICDs who stopped taking DAs. We built Kaplan-Meier curves for which t = 0 was the date of DA discontin-uation; patients were censored at the date of thefirst visit without ICDs (event of interest) or the last visit if they remained with ICDs.
Sensitivity analyses
We examined whether specific DAs were associated with ICDs and whether there was a difference between standard and extended-release (ER) presentations of DA.
For ICDs defined according to MDS-UPDRS part I-1.6, we used multinomial GEE models to compare patients with slight (item 1.6 = 1) and mild or more severe (item 1.6≥ 2) ICDs to those without (item 1.6 = 0). We used logistic models because Poisson models are not implemented. We also used a logistic GEE model to examine the association between the 2 differ-ent definitions of ICDs at each wave and to compute the area under the curve.
For our main analyses, variables measuring cumulative DA exposure were updated at each visit andfixed at their value at DA discontinuation; patients were therefore considered ex-posed after discontinuation (data available from Dryad,figure 1, doi.org/10.5061/dryad.qv4kq75). In sensitivity analyses, we used an alternative definition according to which patients were considered to be no longer exposed after DA discon-tinuation (data available from Dryad,figure 1).
Analyses were performed with SAS 9.4 (SAS Institute Inc, Cary, NC), Stata14.2 (StataCorp LP, College Station, TX), and R3.3 (R Foundation for Statistical Computing, Vienna, Austria). p Values are 2 sided, and values of p ≤0.05 were considered statistically significant.
Data availability
Anonymized data will be shared on request from any qualified investigator.
Results
Of 426 patients, we excluded 11 who developed atypical par-kinsonism (4 had ICDs) and 4 with missing covariates and retained 411 for the analyses (40.6% women; mean age 62.3 years, SD 9.8 years): 63.8% of the patients attended≥4 assess-ments, 28.7% attended 2 or 3 assessassess-ments, and 7.5% attended the baseline assessment only. The average FU was 3.3 years (SD 1.7 years). Table 1 gives their baseline characteristics. Nearly all
Neurology.org/N Neurology | Volume 91, Number 3 | July 17, 2018 e191
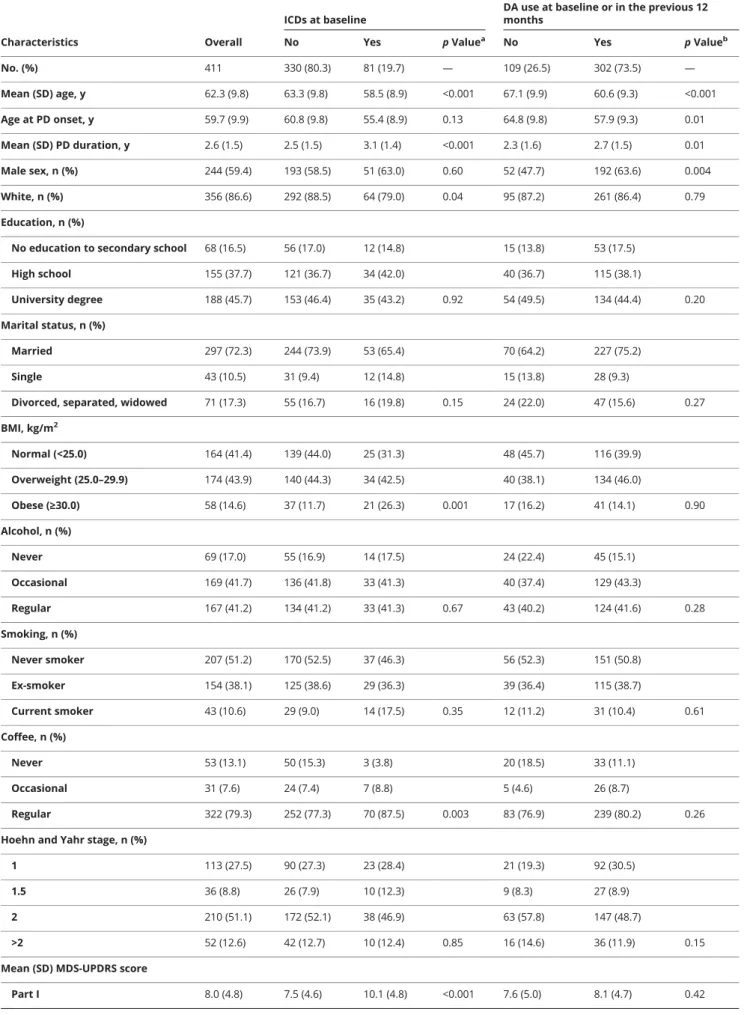
Table 1Baseline characteristics of patients overall and according to presence of ICDs and DA use
Characteristics Overall
ICDs at baseline
DA use at baseline or in the previous 12 months
No Yes p Valuea No Yes p Valueb
No. (%) 411 330 (80.3) 81 (19.7) — 109 (26.5) 302 (73.5) — Mean (SD) age, y 62.3 (9.8) 63.3 (9.8) 58.5 (8.9) <0.001 67.1 (9.9) 60.6 (9.3) <0.001 Age at PD onset, y 59.7 (9.9) 60.8 (9.8) 55.4 (8.9) 0.13 64.8 (9.8) 57.9 (9.3) 0.01 Mean (SD) PD duration, y 2.6 (1.5) 2.5 (1.5) 3.1 (1.4) <0.001 2.3 (1.6) 2.7 (1.5) 0.01 Male sex, n (%) 244 (59.4) 193 (58.5) 51 (63.0) 0.60 52 (47.7) 192 (63.6) 0.004 White, n (%) 356 (86.6) 292 (88.5) 64 (79.0) 0.04 95 (87.2) 261 (86.4) 0.79 Education, n (%)
No education to secondary school 68 (16.5) 56 (17.0) 12 (14.8) 15 (13.8) 53 (17.5)
High school 155 (37.7) 121 (36.7) 34 (42.0) 40 (36.7) 115 (38.1)
University degree 188 (45.7) 153 (46.4) 35 (43.2) 0.92 54 (49.5) 134 (44.4) 0.20 Marital status, n (%)
Married 297 (72.3) 244 (73.9) 53 (65.4) 70 (64.2) 227 (75.2)
Single 43 (10.5) 31 (9.4) 12 (14.8) 15 (13.8) 28 (9.3)
Divorced, separated, widowed 71 (17.3) 55 (16.7) 16 (19.8) 0.15 24 (22.0) 47 (15.6) 0.27 BMI, kg/m2 Normal (<25.0) 164 (41.4) 139 (44.0) 25 (31.3) 48 (45.7) 116 (39.9) Overweight (25.0–29.9) 174 (43.9) 140 (44.3) 34 (42.5) 40 (38.1) 134 (46.0) Obese (≥30.0) 58 (14.6) 37 (11.7) 21 (26.3) 0.001 17 (16.2) 41 (14.1) 0.90 Alcohol, n (%) Never 69 (17.0) 55 (16.9) 14 (17.5) 24 (22.4) 45 (15.1) Occasional 169 (41.7) 136 (41.8) 33 (41.3) 40 (37.4) 129 (43.3) Regular 167 (41.2) 134 (41.2) 33 (41.3) 0.67 43 (40.2) 124 (41.6) 0.28 Smoking, n (%) Never smoker 207 (51.2) 170 (52.5) 37 (46.3) 56 (52.3) 151 (50.8) Ex-smoker 154 (38.1) 125 (38.6) 29 (36.3) 39 (36.4) 115 (38.7) Current smoker 43 (10.6) 29 (9.0) 14 (17.5) 0.35 12 (11.2) 31 (10.4) 0.61 Coffee, n (%) Never 53 (13.1) 50 (15.3) 3 (3.8) 20 (18.5) 33 (11.1) Occasional 31 (7.6) 24 (7.4) 7 (8.8) 5 (4.6) 26 (8.7) Regular 322 (79.3) 252 (77.3) 70 (87.5) 0.003 83 (76.9) 239 (80.2) 0.26
Hoehn and Yahr stage, n (%)
1 113 (27.5) 90 (27.3) 23 (28.4) 21 (19.3) 92 (30.5)
1.5 36 (8.8) 26 (7.9) 10 (12.3) 9 (8.3) 27 (8.9)
2 210 (51.1) 172 (52.1) 38 (46.9) 63 (57.8) 147 (48.7)
>2 52 (12.6) 42 (12.7) 10 (12.4) 0.85 16 (14.6) 36 (11.9) 0.15
Mean (SD) MDS-UPDRS score
Part I 8.0 (4.8) 7.5 (4.6) 10.1 (4.8) <0.001 7.6 (5.0) 8.1 (4.7) 0.42
patients (93.7%) took either LD or DA in the previous 12 months; 20.2% and 29.4% took LD and DA alone, respectively, while 44.0% took both. Compared to patients who had not used a DA in the previous 12 months, those who had (73.5%) were younger, were more often male, and had longer disease dura-tion. After adjustment for age, sex, and disease duration, there were no major differences between the 2 groups for other characteristics.
At baseline, 81 (19.7%) patients had ICDs: pathologic gam-bling (3.9%), compulsive shopping (4.6%), compulsive/binge eating (10.5%), and compulsive sexual behaviors (8.5%). Multiple ICDs were present in 6.3%. Compared to patients without, those with ICDs were younger and had longer dis-ease duration. After adjustment for age and disdis-ease duration, they were more likely to be obese, single, and regular coffee drinkers and to have higher scores for MDS-UPDRS parts I through IV and lower scores for MDS-UPDRS part III. They used DAs more frequently and at higher doses, while fre-quency of use and dose of LD were similar in the 2 groups. Nearly half of the patients (42.6%) had ICDs at≥1 visit. ICD prevalence increased from 19.7% at baseline to 32.8% after 5 years. After the first visit with ICDs, 90 (51.4%) patients remained with ICDs until the end of the FU (average 1.8 years, SD 1.7 years), while 85 (48.6%) did not have ICDs at ≥1 subsequent visits. Of these, 58 remained without ICDs
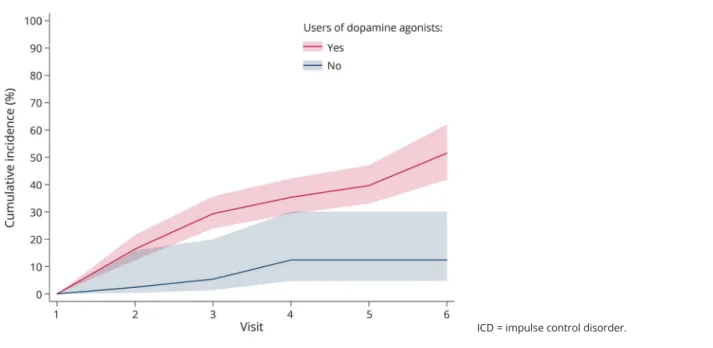
until the end of the FU (average 3.0 years, SD 1.4 years), while 27 reported ICDs again (average 4.0 years, SD 1.1 years). Of 306 (46 never DA users, 260 ever DA users) patients without ICDs at baseline with at least 1 additional visit, 94 (4 never DA users, 90 ever DA users) developed ICDs, corre-sponding to a 5-year cumulative incidence of 46.1% (95% CI 37.4–55.7; never users 12.4%, 95% CI 4.8–30.0; ever users 51.5%, 95% CI 41.8–62.1; figure 1). The average annual in-cidence was of 103.3 per 1,000 person-years (nonusers 26.4 per 1,000, users 118.6 per 1,000).
Among all patients, 356 (86.6%) took DAs at least once since disease onset. While 256 (71.9%) remained on DAs over an average FU of 3.0 years (SD 1.7 years), 100 (28.1%) dis-continued DAs: 74 stayed without DAs until the end of FU (average 2.2 years, SD 2.1 years), and 26 started DAs again (average 2.6 years, SD 1.8 years).
ICD prevalence increased over the FU in incident patients (PR per 1 year 1.10, 95% CI 0.96–1.25). The trend of in-creasing ICD frequency was less pronounced in patients with longer disease duration because there was an interaction be-tween baseline disease duration and time (PRdisease duration × time 0.95, 95% CI 0.92–0.98). Men developed ICDs more
frequently than women over time (PRmale sex × time1.13, 95%
CI 1.02–1.26). Younger patients had a higher prevalence Table 1 Baseline characteristics of patients overall and according to presence of ICDs and DA use(continued)
Characteristics Overall
ICDs at baseline
DA use at baseline or in the previous 12 months
No Yes p Valuea No Yes p Valueb
Part II 7.6 (4.6) 7.3 (4.7) 8.7 (4.1) 0.21 7.0 (4.7) 7.8 (4.6) 0.56
Part III 20.2 (10.3) 20.5 (10.5) 18.8 (9.4) 0.06 20.7 (10.1) 20.0 (10.4) 0.42
Part IV 0.6 (1.7) 0.4 (1.3) 1.2 (2.6) 0.01 0.5 (1.5) 0.6 (1.7) 0.85
Mean (SD) MMSE score 28.2 (1.9) 28.1 (1.9) 28.4 (1.7) 0.20 28.0 (2.1) 28.2 (1.8) 0.18 LD use, n (%)c 264 (64.2) 207 (62.7) 57 (70.4) 0.11 83 (76.1) 181 (59.9) 0.02
Mean (SD) LED levodopa, mgd 241.7 (192.8) 235.7 (181.1) 263.4 (230.7) 0.55 269.8 (180.5) 229.0 (197.3) <0.001
Dopamine agonist use, n (%)c 302 (73.5) 227 (68.8) 75 (92.6) 0.002 — — —
Mean (SD) LED agonists, mgd 161.4 (107.7) 145.0 (99.1) 211.1 (118.0) <0.001 — — — COMT inhibitors use, n (%)c 46 (11.2) 36 (10.9) 10 (12.3) 0.99 16 (14.7) 30 (9.9) 0.03
Selegiline, rasagiline use, n (%)c 166 (40.4) 137 (41.5) 29 (35.8) 0.21 39 (35.8) 127 (42.1) 0.79
Anticholinergics use, n (%)c 16 (3.9) 15 (4.5) 1 (1.2) 0.10 5 (4.6) 11 (3.6) 0.39
Amantadine use, n (%)c 8 (1.9) 5 (1.5) 3 (3.7) 0.62 2 (1.8) 6 (2.0) 0.47
Abbreviations: BMI = body mass index; COMT = catechol-O-methyltransferase; DA = dopamine agonist; LD = levodopa; LED = levodopa equivalent dose; MDS-UPDRS = Movement Disorder Society Unified Parkinson’s Disease Rating Scale; MMSE = Mini-Mental State Examination; PD = Parkinson disease. Values are numbers (percentages) unless stated otherwise.
aAdjusted for age and PD duration. bAdjusted for age, PD duration, and sex. cAt baseline or in the previous 12 months. dIn drug users.
Neurology.org/N Neurology | Volume 91, Number 3 | July 17, 2018 e193
of ICDs at all visits (PR per 1 year of age 0.97, 95% CI 0.96–0.98).
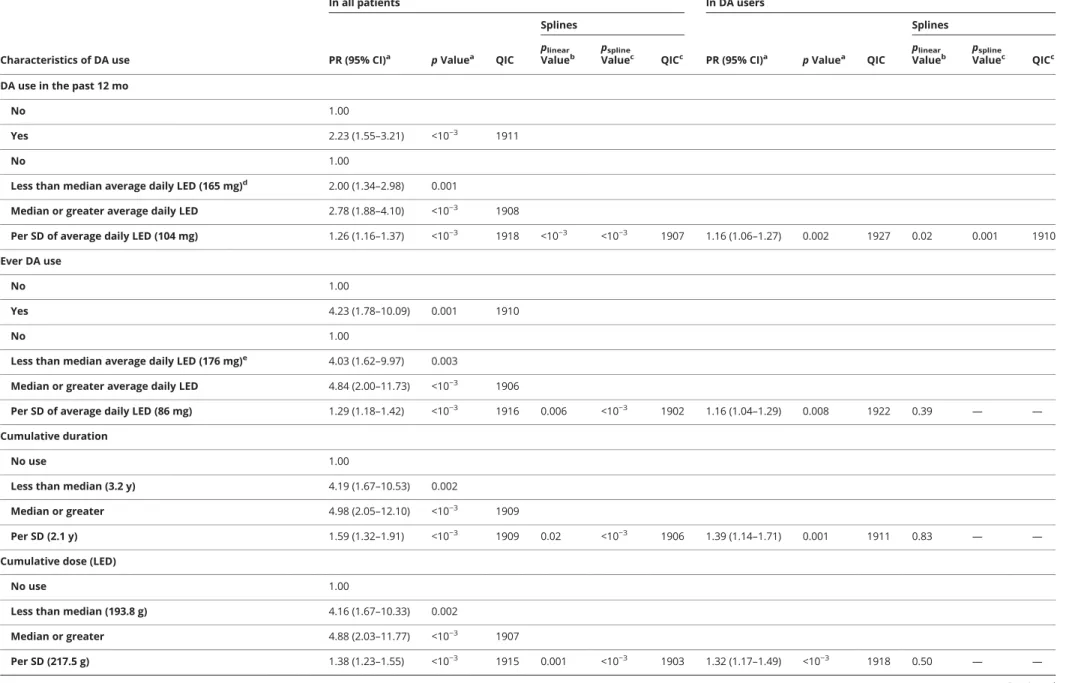
Analyses of the relation between DA and ICDs are summa-rized in table 2. DA use in the past 12 months was associated with a 2.23-fold higher ICD prevalence (p < 0.001). ICD prevalence increased with average daily dose in the past 12 months, but splines showed a departure from linearity (p < 0.001), with a plateau above ≈150 mg/d LD equivalents; a similar pattern was seen in ever users (figure 2). A stronger association was seen for ever DA use (PR 4.23). ICD preva-lence increased with average daily DA dose, but splines showed a departure from linearity (p < 0.001). There was no departure from linearity in ever users, in whom ICD preva-lence increased by 16% (95% CI 4%–29%) per 1-SD increase of dose. Similar patterns were observed for cumulative dura-tion and dose. While splines suggested a departure from lin-earity overall, analyses restricted to ever users suggested linear dose-effect relations, with 39% (95% CI 14%–71%) and 32% (95% CI 17%–49%) higher prevalence per 1-SD increase in cumulative duration and dose, respectively. Thefinal model including cumulative duration and average daily dose showed linear associations with the 2 variables, stronger for duration than dose, both overall and in ever users. There was no in-teraction between dose and duration (overall p = 0.29, users p = 0.20). Overall, this model had a fit (QIC 1,902) similar to those based on splines for ever DA use (QIC 1,902) and cumulative dose (QIC 1,903). In ever users, it provided the bestfit (QIC 1,902).
LD was not strongly associated with ICDs in analyses adjusted for DA (data available from Dryad, table 1, doi.org/10.5061/ dryad.qv4kq75), although in the model including both aver-age daily dose and cumulative duration, increasing dose (but
not duration) displayed a borderline association (PR 1.10, 95% CI 1.01–1.20, p = 0.03) that was not present in analyses restricted to ever users. There was no interaction between DA and LD. There was no association between other anti-parkinsonian drugs and ICDs (data available from Dryad, table 2).
Thirty patients with ICDs who stopped taking DAs were followed up afterward. ICDs resolved progressively, with 50% patients without ICDs 1 year after DA discontinuation (figure 3).
Sensitivity analyses
Analyses according to the main types of DA are shown in table 3. The associations of pramipexole (PR 4.67, 95% CI 2.02–10.79) and ropinirole (PR 4.86, 95% CI 2.03–11.63) with ICDs were of a similar magnitude (p for difference = 0.82). Patients who had used both had the same prevalence of ICDs (PR = 3.57, 95% CI = 1.37–9.26) as patients who had used either of them (pramipexole and ropinirole vs prami-pexole alone p = 0.32, pramiprami-pexole and ropinirole vs ropi-nirole alone p = 0.28). Patients who had ever used other DA (apomorphine, bromocriptine, rotigotine, piribedil) alone had an increased risk of ICDs (PR 2.74, 95% CI 1.07–7.04), but it was less pronounced than for patients who had used only pramipexole (p = 0.01) or ropinirole (p = 0.02). In addition, patients who had ever used other DAs as well as pramipexole and/or ropinirole had a prevalence of ICDs similar to that of patients who had used only pramipexole (p = 0.85) or ropinirole (p = 0.97) but higher than that of those who had used only other DAs (p = 0.01). Patients who ever used other DA but never used pramipexole and ropinirole received a lower average daily dose than all the other groups (p < 10−3).
Figure 1Cumulative incidence (95% confidence interval) of ICDs at each visit according to ever use of dopamine agonists
Table 2 Association of dopamine agonist use with ICDs
Characteristics of DA use
In all patients In DA users
PR (95% CI)a p Valuea QIC
Splines
PR (95% CI)a p Valuea QIC
Splines plinear
Valueb pValuesplinec QICc Valueplinearb pValuesplinec QICc
DA use in the past 12 mo
No 1.00
Yes 2.23 (1.55–3.21) <10−3 1911
No 1.00
Less than median average daily LED (165 mg)d 2.00 (1.34–2.98) 0.001
Median or greater average daily LED 2.78 (1.88–4.10) <10−3 1908
Per SD of average daily LED (104 mg) 1.26 (1.16–1.37) <10−3 1918 <10−3 <10−3 1907 1.16 (1.06–1.27) 0.002 1927 0.02 0.001 1910
Ever DA use
No 1.00
Yes 4.23 (1.78–10.09) 0.001 1910
No 1.00
Less than median average daily LED (176 mg)e 4.03 (1.62–9.97) 0.003
Median or greater average daily LED 4.84 (2.00–11.73) <10−3 1906
Per SD of average daily LED (86 mg) 1.29 (1.18–1.42) <10−3 1916 0.006 <10−3 1902 1.16 (1.04–1.29) 0.008 1922 0.39 — —
Cumulative duration
No use 1.00
Less than median (3.2 y) 4.19 (1.67–10.53) 0.002
Median or greater 4.98 (2.05–12.10) <10−3 1909
Per SD (2.1 y) 1.59 (1.32–1.91) <10−3 1909 0.02 <10−3 1906 1.39 (1.14–1.71) 0.001 1911 0.83 — —
Cumulative dose (LED)
No use 1.00
Less than median (193.8 g) 4.16 (1.67–10.33) 0.002
Median or greater 4.88 (2.03–11.77) <10−3 1907 Per SD (217.5 g) 1.38 (1.23–1.55) <10−3 1915 0.001 <10−3 1903 1.32 (1.17–1.49) <10−3 1918 0.50 — — Continued Neurology. org/N Neurology | Volume 91, Number 3 | July 17, 2018 e195 Copyright ª 2018 American Academy of Neurology. Unauthorized reproduction of this article is prohibited.
We compared ER and standard presentations of DA and ob-served no difference in their association with ICDs. At baseline, 302 patients used Das, 45% a standard presentation and 67% an ER presentation. At baseline or over the FU, 356 patients had used DA at least once, 49% a standard presentation and 88% an ER presentation. The sum of the percentages is >100% because some patients used both standard and ER presentations. In a mutually adjusted model, there was no difference in the association of standard or ER presentations of DAs with ICDs (p > 0.50 for all models).
There was a strong association between ICDs and MDS-UPDRS part I-1.6 (area under the curve 0.89). With the use of this 3-level definition, DA use, average daily dose, and cu-mulative duration and dose were all associated with ICDs independently of severity in all models. Odds ratios tended to be higher for more severe ICDs, but there was no significant difference between the 2 groups (table 4).
We used alternative definitions of DA use (data available from dryad,figure 1, doi.org/10.5061/dryad.qv4kq75) and reached similar conclusions, except that effect sizes were generally smaller (data available from Dryad, table 3).
We used an alternative definition of ICDs that also included 2 related behaviors, hobbyism and hypercreativity. At baseline, the frequency of hobbyism was 4.4% and the frequency of hypercreativity was 7.3%. The frequency of ICDs including these behaviors at baseline was 22.9% (compared to 19.7% for our main definition); it increased to 37.3% after 5 years (compared to 32.8% for our main definition). The association between DAs and this definition of ICDs was very similar compared to our main definition (data available from Dryad, table 4, doi.org/10. 5061/dryad.qv4kq75).
The number of patients with drug-seeking behaviors (n = 6 patients) or punding (n = 18 patients) at baseline or during the FU was small and did not allow us to conduct specific analyses. If we considered patients with these behaviors as having ICDs, our findings were virtually unchanged. The reason is that 15 of the 18 patients with punding and 3 of the 6 patients with drug-seeking behaviors also had ICDs.
Discussion
In this longitudinal study of patients with PD with a high prevalence of DA use, ICD prevalence increased from 19.7% at baseline to 32.8% after 5 years. The 5-year cu-mulative incidence of ICDs was≈45%. DA use was strongly associated with ICDs, with a dose-effect relationship for both increasing duration and dose. There was no strong association between use of LD or other antiparkinsonian drugs and ICDs. After discontinuation of DAs, ICDs pro-gressively resolved. Table 2 Association of dopamine agonist use with ICDs (continued) Characteristics of DA use In all patients In D A u sers PR (95% CI) a p Value a QIC Splines PR (95% CI) a p Value a QIC Splines plinear Value b pspline Value c QIC c plinear Value b pspline Value c QIC c Average lifetime daily DA dose + cumulative duration of DA Per SD of average daily LED 1.20 (1.09 –1.33) <10 − 3 0.08 — 1.12 (0.99 –1.25) 0.06 0.55 — Per SD of cumulative duration 1.46 (1.19 –1.79) <10 − 3 1902 0.41 —— 1.35 (1.09 –1.67) 0.005 1902 0.99 —— Abbreviations: CI = confidence interval; DA = dopamine agonist; ICD = impulse control disorder; LED = levodopa equivalent dose; PR = prevalence ratio ; Q IC = quasi-information criterion. Models are adjusted for age and disease duration at baseline (years), sex, education, marital status, ever levodopa use (time-dependent), time sinc e baseline (years), time × sex, and time × disease duration. aPRs, 95% CIs, and p values were computed with Poisson generalized estimating equation models with robust variance. bTest of linearity: values of plinear ≤ 0.05 indicate a departure from a linear relationship between the exposure and ICDs; in that case, splines provide a better fit than a linear continuous term and are a ssociated with lower QIC. Nonsignificant plinear values indicate that splines do not improve the model fit. cTest of a ssociation between splines and ICDs and corresponding QIC. These v alues are not reported if plinear > 0.05. dAverage daily LED of DA over the past 12 months. eAverage lifetime daily LED o f DA.
ICD prevalence increased over time, in agreement with previous longitudinal studies.3,9,17The 5-year cumulative in-cidence was 46.1% overall (ever DA users 51.5%), with an
annual incidence of 103.3 per 1,000 overall (DA users 118.6 of 1,000). These findings are consistent with a study that reported a 5-year cumulative incidence of 47% and an annual Figure 2Dose-effect relationship between different measures of DA use and prevalence of ICDs (A) overall and (B) in DA
users
Graphs show the prevalence of impulse control disorder (ICDs) after 3 years of follow-up in women with average age (62 years) and disease duration (2.6 years) at baseline who were married, had a low level education level, and never used levodopa. DA = dopamine agonist; LED = levodopa equivalent dose.
Neurology.org/N Neurology | Volume 91, Number 3 | July 17, 2018 e197
incidence of 120 per 1,000 in 46 patients with PD after 21 months of DA therapy.9 In the Parkinson’s Progression Markers Initiative, the 3-year cumulative incidence of ICDs was 25.1%.3 ICDs also increased over time in a post hoc analysis of open-label extension studies of rotigotine.17In the Impulse Control Disorders and the Association of Neuro-psychiatric Symptoms, Cognition and Quality of Life in
Parkinson Disease (ICARUS) study,18 ICD prevalence was stable over a 2-year FU, but mean baseline disease duration was 6.1 years (2.6 years in our study). We found that the increase in ICD prevalence over time was more pronounced in incident patients than in those with longer disease duration; therefore, ICDs tend to occur in thefirst years of the disease, while their frequency is more stable after a few years. Figure 3Probability of staying with ICDs over the follow-up in patients who discontinued DAs
Note that t = 0 corresponds to the date of discontinuation of dopamine agonists (DAs). ICD = impulse control disorder.
Table 3Association of different types of DAs (ever use) with ICDs
Ever use of Das PR (95% CI)a p Valuea,b p Valuea,c
Lifetime average daily
dose (SE) (LED), mgd p Value
1. Never 1.00 (Reference) — — — —
2. Pramipexole alone 4.67 (2.02–10.79) <10−3 — 192 (4) <10−3
3. Ropinirole alone 4.86 (2.03–11.63) <10−3 p3 vs 2= 0.82 176 (6) <10−3
4. Pramipexole and ropinirole but not other DAse 3.57 (1.37–9.26) 0.009
p4 vs 2= 0.32 208 (9) <10−3
p4 vs 3= 0.28
5. Other DAsebut not pramipexole or ropinirole 2.74 (1.07–7.04) 0.036
p5 vs 2= 0.01 138 (5) Reference
p5 vs 3= 0.02
6. Other DAseand pramipexole and/or ropinirole 4.82 (2.00–11.60) <10−3 p
6 vs 2= 0.85 208 (4) <10−3
p6 vs 3= 0.97
p6 vs 5= 0.01
Abbreviations: CI = confidence interval; DA = dopamine agonist; ICD = impulse control disorder; LED = levodopa equivalent dose in milligrams; PR = prevalence ratio.
Models are adjusted for age and disease duration at baseline (years), sex, education, marital status, ever levodopa use (time dependent), time since baseline (years), time × sex, and time × disease duration.
a
PRs, 95% CIs, and p values were computed with Poisson generalized estimating equation models with robust variance.
bEach group compared to the reference group (never use of DAs). cComparisons between different groups.
dComputed over all visits with the use of linear generalized estimating equation models. ePiribedil, apomorphine, bromocriptine, and rotigotine.
Patient characteristics associated with ICDs were consistent with those previously reported, including younger age, being single, and coffee drinking.4,9 We also found that ICDs
in-creased over time in a more pronounced way in men com-pared to women. ICDs were associated with obesity, likely due to compulsive eating.
Ourfindings confirm a strong association of DA with ICDs; they were 2.23 times more frequent in patients who used DAs in the previous 12 months compared to those who did not and 4.23 times more frequent in ever users compared to never users. There were no differences between ER and standard presentations or according to main DA. Although we cannot exclude that patients taking DAs share characteristics that make them more likely to develop ICDs, we adjusted for most po-tential confounders.
One important contribution of this study is the examination of dose-effect relations. Both dose and duration of treatment
played independent roles and contributed to the association of cumulative DA dose with ICDs. This association was present in analyses restricted to DA users and consistent with a linear relation in this group. These analyses are less likely to be confounded by characteristics that may be associated with DA prescription. Previous studies reported associations of ICDs with DA dose,12,29,30while other did not.4,14These discrepancies may be due to the cross-sectional nature of previous reports that did not take into account the full history of DA use. One smaller longitudinal study found an associ-ation with peak DA dose. Cumulative DA dose was higher in patients with ICDs than in those without, but this difference was not statistically significant, possibly because of insufficient statistical power.9
The longitudinal design allowed us to investigate the effect of DA discontinuation. ICDs resolved after 1 year in≈50% of the patients who stopped DAs and continued to improve with longer FU.9,15
Table 4 Association of DA use with ICDs according to MDS-UPDRS part I item 1.6
Characteristics of DA use
MDS-UPDRS part I item 1.6 = 1 MDS-UPDRS part I item 1.6≥2
OR (95% CI)a p Valuea OR (95% CI)a p Valuea p Valueb
DA use in the past 12 mo
Yes vs no 2.53 (1.62–3.95) <10−3 3.28 (1.58–6.83) 0.001 0.48
Per SD of average daily LED (104 mg) 1.49 (1.28–1.73) <10−3 1.36 (1.11–1.68) 0.003 0.40 Per SD of average daily LED in users 1.35 (1.14–1.60) <10−3 1.15 (0.89–1.49) 0.29 0.21 Ever DA use
Yes vs no 3.55 (1.86–6.76) <10−3 3.52 (1.13–11.01) 0.03 0.99
Per SD of average daily LED (86 mg) 1.45 (1.24–1.69) 0.007 1.52 (1.22–1.89) <10−3 0.66 Per SD of average daily LED in users 1.29 (1.08–1.55) 0.006 1.36 (1.05–1.78) 0.02 0.67 Cumulative duration of DA use
Per SD (2.1 y) 1.51 (1.19–1.91) <10−3 1.76 (1.19–2.59) 0.004 0.45
Per SD in users 1.45 (1.08–1.94) 0.01 1.72 (1.05–2.82) 0.03 0.51
Cumulative dose of DA (LED)
Per SD (217.5 g) 1.53 (1.21–1.93) <10−3 1.82 (1.29–2.56) <10−3 0.23
Per SD in users 1.51 (1.17–1.93) 0.001 1.81 (1.25–2.64) 0.002 0.26
Average lifetime daily DA dose + cumulative duration of DA
Per SD of average daily LED 1.34 (1.12–1.60) 0.001 1.38 (1.08–1.77) 0.01 0.79 Per SD of cumulative duration 1.31 (1.00–1.73) 0.05 1.52 (0.98–2.35) 0.06 0.53 Per SD of average daily LED in users 1.22 (1.01–1.48) 0.04 1.28 (0.97–1.68) 0.08 0.73 Per SD of cumulative duration in users 1.36 (1.01–1.85) 0.04 1.61 (0.97–2.69) 0.07 0.53 Abbreviations: CI = confidence interval; DA = dopamine agonist; ICD = impulse control disorder; LED = levodopa equivalent dose; MDS-UPDRS = Movement Disorder Society Unified Parkinson’s Disease Rating Scale; OR = odds ratio.
Models are adjusted for age and disease duration at baseline (years), sex, education, marital status, ever LD use (time dependent), time since baseline (years), time × sex, and time × disease duration.
a
ORs, 95% CIs, and p values were computed with multinomial logistic generalized estimating equation models; patients without ICDs (MDS-UPDRS part I item 1.6 = 0) represent the reference group.
b
p Value for difference between the 2 groups.
Neurology.org/N Neurology | Volume 91, Number 3 | July 17, 2018 e199
Some previous studies reported an association between LD and ICDs; however, an important limitation is that they assessed DA and LD use at the time of the ICD interview4or in the 4 weeks before.18This approach may lead to reverse causation in that we show that ICDs slowly disappear after DAs are stopped. A patient who develops ICDs may stop DAs, start LD, and remain with ICDs 6 months later. In a cross-sectional study, this patient will be classified as not exposed to DA and exposed to LD, although LD was started after ICDs appeared. This emphasizes the importance of longitudinal data to assess the history of drug use before ICDs, and our longitudinal analysis overcomes this limitation. We did notfind a strong association between LD and ICDs, in agreement with a previous longitudinal study,9although there was some evidence that higher LD dose was associated with a small increased risk of ICDs. It is possible that our study had insufficient power to detect a small effect size for LD or that the doses used were too low, and longer FU will allow us to examine this issue. We did notfind any association between other antiparkinsonian drugs and ICDs.
One limitation of our study is the relatively young age of the patients, resulting from their identification in referral centers. Because younger age is associated with ICDs and DAs are more frequently used in younger patients, this may contribute to overestimate their frequency.
The diagnosis of ICDs was based on gold standard criteria for behavioral disorder assessment in the general pop-ulation. There was a strong association between diagnosis of ICDs and the corresponding MDS-UPDRS item; analyses based on this item yielded consistent findings. The main strength of our study is the longitudinal annual assessment of a relatively large cohort of patients with PD that allowed us to take into account the full history of DA use and the time-dependent occurrence of ICDs and to examine dose-effect relations.
Given the high cumulative incidence of ICDs in patients with PD, these adverse effects should be carefully monitored in patients ever treated with DA. There is a need to develop tools for screening these disorders and identifying patients at high risk.31Further studies are needed to understand the mechanisms involved in the relation between DAs and ICDs, in particular the role of apathy, anxiety, and depression.
Author contributions
Jean-Christophe Corvol: study concept and design, acquisition of data, analysis and interpretation of data, study supervision, critical revision of manuscript for intellectual content. Fanny Artaud: analysis and interpretation of data, statistical analysis, critical revision of manuscript for intellectual content. Florence Cormier-Dequaire: acquisition of data, interpretation of data, critical revision of manuscript for intellectual content. Olivier Rascol, Franck Durif, Pascal Derkinderen, Ana-Raquel Marques, Fr´ed´eric Bourdain, Jean-Philippe Brandel, Fernando Pico, and Lucette Lacomblez: interpretation of data, critical
revision of manuscript for intellectual content. Cecilia Bonnet, Christine Brefel-Courbon, and Fabienne Ory-Magne: acquisi-tion of data, interpretaacquisi-tion of data, critical revision of manu-script for intellectual content. David Grabli and Stephan Klebe: interpretation of data, critical revision of manuscript for intellectual content. Graziella Mangone and Hana You: acquisition of data, interpretation of data, critical revision of manuscript for intellectual content. Val´erie Mesnage and Pei-Chen Lee: interpretation of data, critical revision of manuscript for intellectual content. Alexis Brice and Marie Vidailhet: study concept and design, interpretation of data, critical revision of manuscript for intellectual content. Alexis Elbaz, study concept and design, acquisition of data, analysis and interpretation of data, statistical analysis, critical revision of manuscript for in-tellectual content.
Acknowledgment
The authors thank the Assistance Publique Hˆopitaux de Paris and the Unit´e de Recherche Clinique of the Piti´e-Salpˆetri`ere Hospital for their support in sponsoring this cohort: Alain Mallet (head of the Unit´e de Recherche Clinique), Coralie Villeret (project manager), Merry Mazmanian (project manager), Hakima Manseur (clinical research assistant), and Mostafa Hajji (data manager). They thank contributors of the DIGPD Study Group who helped with the recruitment or assessment of patients at the Piti´e-Salpˆetri`ere Hospital: Julia Muellner (coinvestigator), Julia Kraemmer (coinvestigator), Eve Benchetrit (neuropsychologist), Fanny Pineau (neuropsychologist), and Julie Socha (neuropsychologist).
Study funding
This project was funded by grants from the French Ministry of Health (Programme Hospitalier de Recherche Clinique, AOR0810) and from the French Drug Agency (Agence Nationale de S´ecurit´e et des M´edicaments, ANSM-2013). The research leading to these results has received funding from the program“Investissements d’Avenir” ANR-10-IAIHU-06. Disclosure
J. Corvol holds stock options in B&A Therapeutics; is a con-sultant for Theranexus and BrainEver; and received research grants from Actelion, Ipsen, Clevexel, Sanofi-Aventis, Michael J Fox Foundation, France Parkinson, French Ministry of Health (Agence Nationale de la Recherche: MeMoDeep, MoDysk), and French Ministry of Health (Prgramme Hospitalier de Recherche Clinique grants AOM_10-078, AOR-08-10), con-sultant honoraria from Abbvie, Lundbeck, BMS, Pfizer, Zam-bon, Amarantus, and travel grants from MDS, Teva, Novartis, and UCB. F. Artaud and F. Cormier-Dequaire report no dis-closures relevant to the manuscript. O. Rascol reports fees for scientific advising from AbbVie, Adamas, Acorda, Addex, Apo-pharma, Bial, Biogen, Britannia, Clevexel, Cynapsus, INC Rea-search, Lundbeck, Merck, MundiPharma, Neuroderm, Novartis, Oxford Biomedica, Parexel, Pfizer, Prexton Therapeutics, Quintiles, Sanofi, Servier, Teva, UCB, XenoPort, and Zambon. F. Durif, P. Derkinderen, A. Marques, F. Bourdain, J. Brandel, F. Pico, L. Lacomblez, and C. Bonnet report no disclosures
relevant to the manuscript. C. Brefel-Courbon reports consultant fees and nonfinancial support from Teva, Aguettant, UCB, Zambon, Orkyn, and Abbvie. F. Ory-Magne reports consultant fees from UCB, Aguettant, Zambon, and Abbvie. D. Grabli reports consultant fees and nonfinancial support from Abbvie and Zambon. S. Klebe, G. Mangone, H. You, V. Mesnage, P. Lee, and A. Brice report no disclosures relevant to the manuscript. M. Vidailhet reports grants from Merz, travel grants the Move-ment Disorders Society and the European Academy of Neurology, and academic research grants from the ANR, IHU-A-ICM, and the patient organizations APTES, France Parkinson, and PSP France. A. Elbaz reports no disclosures relevant to the manuscript. Go to Neurology.org/N for full disclosures.
Received October 17, 2017. Accepted infinal form April 11, 2018.
References
1. Evans AH, Strafella AP, Weintraub D, Stacy M. Impulsive and compulsive behaviors in Parkinson’s disease. Mov Disord 2009;24:1561–1570.
2. Callesen MB, Weintraub D, Damholdt MF, Moller A. Impulsive and compulsive behaviors among Danish patients with Parkinson’s disease: prevalence, depression, and personality. Parkinsonism Relat Disord 2014;20:22–26.
3. Smith KM, Xie SX, Weintraub D. Incident impulse control disorder symptoms and dopamine transporter imaging in Parkinson disease. J Neurol Neurosurg Psychiatry 2016;87:864–870.
4. Weintraub D, Koester J, Potenza MN, et al. Impulse control disorders in Parkinson disease: a cross-sectional study of 3090 patients. Arch Neurol 2010;67:589–595. 5. Voon V, Fox SH. Medication-related impulse control and repetitive behaviors in
Parkinson disease. Arch Neurol 2007;64:1089–1096.
6. Voon V, Hassan K, Zurowski M, et al. Prevalence of repetitive and reward-seeking behaviors in Parkinson disease. Neurology 2006;67:1254–1257.
7. Lhommee E, Batir A, Quesada JL, et al. Dopamine and the biology of creativity: lessons from Parkinson’s disease. Front Neurol 2014;5:55.
8. Avanzi M, Baratti M, Cabrini S, Uber E, Brighetti G, Bonfa F. Prevalence of patho-logical gambling in patients with Parkinson’s disease. Mov Disord 2006;21: 2068–2072.
9. Bastiaens J, Dorfman BJ, Christos PJ, Nirenberg MJ. Prospective cohort study of impulse control disorders in Parkinson’s disease. Mov Disord 2013;28:327–333. 10. Pontone G, Williams JR, Bassett SS, Marsh L. Clinical features associated with impulse
control disorders in Parkinson disease. Neurology 2006;67:1258–1261.
11. Singh A, Kandimala G, Dewey RB Jr, O’Suilleabhain P. Risk factors for pathologic gambling and other compulsions among Parkinson’s disease patients taking dopamine agonists. J Clin Neurosci 2007;14:1178–1181.
12. Perez-Lloret S, Rey MV, Fabre N, et al. Prevalence and pharmacological factors associated with impulse-control disorder symptoms in patients with Parkinson dis-ease. Clin Neuropharmacol 2012;35:261–265.
13. Rodriguez-Violante M, Gonzalez-Latapi P, Cervantes-Arriaga A, Camacho-Ordonez A, Weintraub D. Impulse control and related disorders in Mexican Parkinson’s disease patients. Parkinsonism Relat Disord 2014;20:907–910.
14. Voon V, Sohr M, Lang AE, et al. Impulse control disorders in Parkinson disease: a multicenter case–control study. Ann Neurol 2011;69:986–996.
15. Mamikonyan E, Siderowf AD, Duda JE, et al. Long-term follow-up of impulse control disorders in Parkinson’s disease. Mov Disord 2008;23:75–80.
16. Joutsa J, Martikainen K, Vahlberg T, Kaasinen V. Effects of dopamine agonist dose and gender on the prognosis of impulse control disorders in Parkinson’s disease. Parkinsonism Relat Disord 2012;18:1079–1083.
17. Antonini A, Chaudhuri KR, Boroojerdi B, et al. Impulse control disorder related behaviours during long-term rotigotine treatment: a post hoc analysis. Eur J Neurol 2016;23:1556–1565.
18. Antonini A, Barone P, Bonuccelli U, Annoni K, Asgharnejad M, Stanzione P. ICARUS study: prevalence and clinical features of impulse control disorders in Parkinson’s disease. J Neurol Neurosurg Psychiatry 2017;88:317–324.
19. American Psychiatric Association.Diagnostic and Statistical Manual of Mental Dis-orders. 4th ed. Washington, DC: American Psychiatric Association; 2000. 20. Lejoyeux M, Tassain V, Solomon J, Ades J. Study of compulsive buying in depressed
patients. J Clin Psychiatry 1997;58:169–173.
21. Weintraub D, David AS, Evans AH, Grant JE, Stacy M. Clinical spectrum of impulse control disorders in Parkinson’s disease. Mov Disord 2015;30:121–127. 22. Weintraub D, Mamikonyan E, Papay K, Shea JA, Xie SX, Siderowf A. Questionnaire
for impulsive-compulsive disorders in Parkinson’s disease-rating scale. Mov Disord 2012;27:242–247.
23. Rieu I, Martinez-Martin P, Pereira B, et al. International validation of a behavioral scale in Parkinson’s disease without dementia. Mov Disord 2015;30:705–713. 24. Tomlinson CL, Stowe R, Patel S, Rick C, Gray R, Clarke CE. Systematic review of
levodopa dose equivalency reporting in Parkinson’s disease. Mov Disord 2010;25: 2649–2653.
25. Knol MJ, Le Cessie S, Algra A, Vandenbroucke JP, Groenwold RH. Overestimation of risk ratios by odds ratios in trials and cohort studies: alternatives to logistic regression. CMAJ 2012;184:895–899.
26. Zou G. A modified Poisson regression approach to prospective studies with binary data. Am J Epidemiol 2004;159:702–706.
27. Pan W. Akaike’s information criterion in generalized estimating equations. Biometrics 2001;57:120–125.
28. Abrahamowicz M, Bartlett G, Tamblyn R, du Berger R. Modeling cumulative dose and exposure duration provided insights regarding the associations between benzodia-zepines and injuries. J Clin Epidemiol 2006;59:393–403.
29. Ondo WG, Lai D. Predictors of impulsivity and reward seeking behavior with do-pamine agonists. Parkinsonism Relat Disord 2008;14:28–32.
30. Weintraub D, Siderowf AD, Potenza MN, et al. Association of dopamine agonist use with impulse control disorders in Parkinson disease. Arch Neurol 2006;63:969–973. 31. Kraemmer J, Smith K, Weintraub D, et al. Clinical-genetic model predicts incident
impulse control disorders in Parkinson’s disease. J Neurol Neurosurg Psychiatry 2016; 87:1106–1111.
Neurology.org/N Neurology | Volume 91, Number 3 | July 17, 2018 e201