Publisher’s version / Version de l'éditeur:
ACS Applied Materials & Interfaces, 5, 17, pp. 8572-8580, 2013-08-06
READ THESE TERMS AND CONDITIONS CAREFULLY BEFORE USING THIS WEBSITE.
https://nrc-publications.canada.ca/eng/copyright
Vous avez des questions? Nous pouvons vous aider. Pour communiquer directement avec un auteur, consultez la
première page de la revue dans laquelle son article a été publié afin de trouver ses coordonnées. Si vous n’arrivez pas à les repérer, communiquez avec nous à PublicationsArchive-ArchivesPublications@nrc-cnrc.gc.ca.
Questions? Contact the NRC Publications Archive team at
PublicationsArchive-ArchivesPublications@nrc-cnrc.gc.ca. If you wish to email the authors directly, please see the first page of the publication for their contact information.
NRC Publications Archive
Archives des publications du CNRC
This publication could be one of several versions: author’s original, accepted manuscript or the publisher’s version. / La version de cette publication peut être l’une des suivantes : la version prépublication de l’auteur, la version acceptée du manuscrit ou la version de l’éditeur.
For the publisher’s version, please access the DOI link below./ Pour consulter la version de l’éditeur, utilisez le lien DOI ci-dessous.
https://doi.org/10.1021/am402030m
Access and use of this website and the material on it are subject to the Terms and Conditions set forth at
Fabrication and characterization of nanotemplated carbon monolithic
material
He, Xiaoyun; Nesterenko, Ekaterina P.; Nesterenko, Pavel N.; Brabazon,
Dermot; Zhou, Lin; Glennon, Jeremy D.; Luong, John H. T.; Paull, Brett
https://publications-cnrc.canada.ca/fra/droits
L’accès à ce site Web et l’utilisation de son contenu sont assujettis aux conditions présentées dans le site LISEZ CES CONDITIONS ATTENTIVEMENT AVANT D’UTILISER CE SITE WEB.
NRC Publications Record / Notice d'Archives des publications de CNRC:
https://nrc-publications.canada.ca/eng/view/object/?id=8de63e78-f661-4fcb-b760-a791fe05d8f2 https://publications-cnrc.canada.ca/fra/voir/objet/?id=8de63e78-f661-4fcb-b760-a791fe05d8f2Fabrication and Characterization of Nanotemplated Carbon
Monolithic Material
Xiaoyun He,
†Ekaterina P. Nesterenko,
†Pavel N. Nesterenko,
‡Dermot Brabazon,
†Lin Zhou,
§Jeremy D. Glennon,
§John H.T. Luong,
§,⊥and Brett Paull*
,‡†
Irish Separation Science Cluster, Dublin City University, Glasnevin, Dublin 9, Ireland
‡
Australian Centre for Research on Separation Science, University of Tasmania, Hobart, Australia
§
Innovative Chromatography Group, Irish Separation Science Cluster, Department of Chemistry and Analytical Biological Chemistry, Research Facility, University College Cork, Ireland
⊥National Research Council, Montreal, Quebec, Canada H4P2R2
ABSTRACT: A novel hierarchical nanotemplated carbon monolithic rod (NTCM) was prepared using a novel facile nanotemplating approach. The NTCM was obtained using C60-fullerene modified silica gels as hard templates, which were embedded in a phenolic resin containing a metal catalyst for localized graphitization, followed by bulk carbonization, and template and catalyst removal. TEM, SEM, and BET measurements revealed that NTCM possessed an integrated open hierarchical porous structure, with a trimodal pore distribution. This porous material also possessed a high mesopore volume and narrow mesopore size distribution.
During the course of carbonization, the C60 conjugated to aminated silica was partly decomposed, leading to the formation of micropores. The Raman signature of NTCM was very similar to that of multiwalled carbon nanotubes as exemplified by three major peaks as commonly observed for other carbon materials, i.e., the sp3and sp2carbon phases coexisted in the sample. Surface area measurements were obtained using both nitrogen adsorption/desorption isotherms (BET) and with a methylene blue binding assay, with BET results showing the NTCM material possessed an average specific surface area of 435 m2g−1, compared to an area of 372 m2g−1obtained using the methylene blue assay. Electrochemical studies using NTCM modified glassy carbon or boron doped diamond (BDD) electrodes displayed quasi-reversible oxidation/reduction with ferricyanide. In addition, the BDD electrode modified with NTCM was able to detect hydrogen peroxide with a detection limit of below 300 nM, whereas the pristine BDD electrode was not responsive to this target compound.
KEYWORDS: nanotemplating, fullerene C60, carbon monolith, electrochemical behavior
■
INTRODUCTIONOver the past decade or so, porous carbon materials have attracted significant attention,1−3 and have been shown to
exhibit significant potential for many cutting edge applications, including for example, catalysis supports, electrochemical double-layer capacitors, gas storage, and sorbents for separation/remediation processes. These diverse applications stem from high specific surface areas and excellent thermal/ chemical stability of such porous carbon materials. It is noticeable that most of these carbon materials are usually prepared in a powder form,4,5thus for tailoring these materials
to match a particular application, it is often necessary to formulate them in a particular macroscopic shape. Carbon monoliths (CM) possess an integrated structure, which is much easier to apply to many of the above applications.6,7 Additionally, CMs often exhibits a controlled pore structure, with interconnected channels within their framework, which additionally provides the benefit of high flow-through permeability. According to International Union of Pure and
Applied Chemistry (IUPAC) definitions, mesoporous carbon materials possess pores within the 2−50 nm range, micro-porous materials have pores of <2 nm, whereas pore size within macroporous carbon are >50 nm. Hierarchical pore structuring is usually achieved by various templating techniques, including the use of hard and soft templates.8,9Therefore, it is crucial to understand the effects of such architectures upon its physicochemical properties, surface area, mechanical strength, and surface chemistry.10
Fabrication of CMs by various fabrication strategies have been reported by a number of authors.11−14Alvarez and Fuertes15 produced a carbon monolith using a “nanocasting”
approach, employing a macro/mesoporous silica monolith as the sacrificial template. The resultant CM exhibited an interconnected replicated structure, with an impressive surface Received: May 27, 2013
Accepted: August 6, 2013
Published: August 6, 2013
area of 1,800 m2g−1. Xu et al.,16
also used a silica monolith as hard template together witha mixture of styrene and divinylbenzene to synthesize a CM with bimodal perfusion pores by nanocasting and phase separation.
Carbon-based monoliths can also be prepared via the pyrolysis of a carbon rod produced from the polymerization of a resorcinol-formaldehyde copolymer on bare silica particle templates, with iron as the catalyst for localized graphitiza-tion.10,17 More recently, macro/mesoporous carbon monoliths with a graphitic framework have also been prepared via copolymerization of resorcinol and formaldehyde, with the inclusion of a polyamine (tetraethylenepentamine).18 The
polymers were also be doped with different metallic salts of Fe, Ni, or Co prior to carbonization, forming encapsulated metallic nanoparticles during the carbonization step. Such nanoparticles effected the conversion of a fraction of amorphous carbon into graphitic domains and were then removed from carbon monoliths by acid etching.
However, despite considerable interest in carbon monoliths over the past decade or more, to-date to the authors’ knowledge, carbon nanoparticles have not been immobilized onto and within the macroporous wall surface of such carbonaceous monolithic materials, producing “carbon in carbon” or “carbon on carbon” monolithic composites. Given the unique selectivity and physical and chemical properties many such carbon nanoparticles are known to possess, it is reasonable to anticipate that the use of such nanoparticles within the formation of carbon monolithic structures may result in transfer of such properties, in full or in part, onto the resultant carbon substrate.
Therefore, the work herein describes a new synthetic procedure for the production of monolithic hierarchically porous carbon, using a facile “nanotemplating” process, based upon the use of C60 fullerene-modified silica gel as the hard agglomerated template material. Carbon rods were formed using a thermally initiated process, based on pyrolyzing a precursor rod made of a mixture of phenol-formaldehyde resin and the modified silica gel. Key physical and chemical features of these hierarchically porous carbon materials were inves-tigated, together with their potential application as new selective electrode materials.
■
EXPERIMENTAL METHODSPreparation of Fullerene Modified Silica Templates (FMS). The chemical modification of the silica surface with C60was carried
out using a standard coupling procedure, as shown in Scheme 1.19,20
First, 1.2g of 5 μm silica gel, with a surface area of ∼95 m2g−1and
pore size of 160 Å, was reacted with 10% v/v 3-aminopropyltriethox-ysilane (APTES) in 100 mL anhydrous toluene under reflux for 5 h (110 °C), followed by filtration and extensive washing with toluene and methanol (30 mL each), respectively. The resulting 1.0 g of aminated silica (APS) was then refluxed with 300 mg of C60(98 wt %,
Sigma-Aldrich, Ireland) in 100 mL of anhydrous toluene under nitrogen for 16 h (110 °C), providing the C60-modified silica (FMS).
FMS was then transferred into a thimble for Soxhlation with 100 mL of toluene until the filtrate was colorless followed by chloroform and
methanol to obtain FMS. These particles were oven-dried at 80 °C for 16 h and kept in a desiccator.
Elemental analysis revealed the concentration of NH2−groups upon
the APS prior to modification was 3.357 × 10⁻⁴ mol/g of the
stationary phase, whereas the amount of C60 on the surface of the
resultant FMS was 1.937 × 10⁻⁴ mol/g of the stationary phase.
Additionally from elemental analysis data, it was confirmed that the attachment of C60 to the APS surface took place only through one
carbon atom of C60. Thus, the amount of primary and secondary
amino groups on the surface was 1.42 × 10⁻⁴mol/g and 1.937 × 10⁻⁴
mol/g, respectively, i.e., the corresponding ratio of primary:secondary amino groups was ∼0.73:1.
Fabrication of Nanotemplated Carbon Monolith Rods (NTCM). A modified procedure similar to that first reported by Liang et al., and later by Eltmimi et al., and He et al.,10,17,21was used
for the preparation of the nanotemplated carbon monolithic (NTCM) rods. Typically, a 1 g of portion of FMS particles was dispersed in ∼1.85 mL of 1-butanol and sonicated for 1 h. Following this, 0.18 g (1.110 mmol) of ferric chloride (FeCl3) was added to the silica
suspension and dissolved by gentle agitation, after which 0.367 g (3.333 mmol) of resorcinol was added. A 0.275 mL (3.109 mmol) volume of ice cooled formaldehyde−water solution (37 wt %) was introduced dropwise into the mixture with gentle agitation. The mixture was then kept in an ice−water bath for 1 h with constant stirring. The mixture was slowly transferred into capped 5 mm I.D. glass tubes and incubated at 90 °C for 16 h. Resulting crack-free phenolic resin/silica rods were removed from the glass tubes and kept in the fume hood for 72 h to allow slow evaporation of the majority of the residual solvent. Rods were dried under vacuum oven at 80 °C overnight and further cured at 135 °C for 4 h to complete polymerization. The polymerized rods were then pyrolyzed under the flow of nitrogen. The temperature was first ramped from room temperature to 800 °C at 2.5 °C min−1, and then held at this
temperature for 2 h to complete carbonization. A second ramp took place from 800 to 1250 °C, at a rate of 10 °C min−1, and this
temperature was kept for another 1 h. The furnace was allowed to cool by natural convection to room temperature. Silica particles and the iron catalyst were removed from the rods by etching in concentrated hydrofluoric acid (HF, 38−40 wt %) for 6 h and subsequently washed with deionized water until neutral pH. The porous carbon rods obtained were then dried under vacuum at 80 °C for 16 h. For comparison, a number of carbon monolith blanks (CM blank) were prepared in the same manner, using the same grade of silica gel as a template, but without the presence of the surface attached C60.
Characterization. High-resolution scanning electron microscopy (SEM) images of the prepared monolithic materials were obtained using a field emission Hitachi S-5500 SEM (FE-SEM) (Dallas, USA) at an accelerating voltage of 10−20 kV. The surface composition of the NTCM was examined using a Hitachi SEM/energy-dispersive X-ray spectrometer (SEM/EDX) model VP-SEM S-3400N (Oxford, UK). High-resolution imaging for carbon monoliths was performed by using a JEOL JEM-2100LaB6 transmission electron microscope (TEM)
(Tokyo, Japan) operated at 200 kV. The samples for TEM measurements were suspended in 2-propanol and dropped onto carbon-coated copper grids. Thermogravimetric analysis (TGA) was conducted on a TA Instruments TGA-Q50 analyzer (Newcastle, USA) from 25 to 800 °C, with the heating rate of 10 °C min−1 under
nitrogen (50 mL min−1) to mimic the carbonization process. A
Micromeritics TriStar II 3020 surface area analyzer, (Georgia, USA) was used to measure the specific surface area and the pore volume using a nitrogen adsorption/desorption technique. Raman spectra were obtained using a HORIBA Jobin Yvon LabRam800HR with a CCD detector (New Jersey, USA). The argon ion laser used was the Innova 70-C-2 made by Coherent (Santa Clara, USA). The laser power was 6 mW with excitation wavelength 514.5 nm. A magnification of ×50 on the objective lens was used to focus the laser beam and collect backscattering radiation. The exposure time of all spectra recorded was 10 s. Each spectrum was the accumulation of three scans.
Scheme 1. Preparation of C60-Modified APS
ACS Applied Materials & Interfaces Research Article
dx.doi.org/10.1021/am402030m | ACS Appl. Mater. Interfaces 2013, 5, 8572−8580
Methylene Blue (MB) Adsorption Procedure. A calibration curve was established for MB absorbance at 660 nm (Abs660 nm) vs MB
concentration [MB], providing a straight line (up to 20 μM) with a slope of 0.062 Abs660 nm/μM [MB]. Ground samples of both NTCM
and CM blank were placed within aqueous solutions containing different concentrations of MB, and rotated overnight. The super-natant (after centrifugation) was tested for the residual concentration of MB left in solution, following any MB binding to the samples, and compared to the starting concentration. From the calibration curve of MB, the amount of MB bound in mg was then calculated and the MB adsorption in g g−1of sample was determined. From this adsorption,
the Langmuir equation was used to estimate the specific surface area (SSA) of the CM blank or NTCM as follows
= +
N N/ m K Cl MB/(1 K Cl MB)
where, N is the number of moles of MB adsorbed per gram of carbon materials at equilibrium, CMB. Nmis the number of moles of MB per
gram of CM or NTCM to form a monolayer, and Klis the Langmuir
constant. This equation can be linearized to facilitate the determination of the Nmvalue as
= +
CMB/N CMB/Nm 1/K Nl m
The plot of CMB/N vs CMBgives a straight t line with a slope = 1/Nm
and an intercept = 1/KlNm. The Nmvalue is used for the estimation of
the specific surface area (SSA) of CM or NTCM as NmαMBNAvo, where
αMBis the occupied surface area of one MB molecule and NAvois the
Avogadro’s constant (6.023 × 10²³mol−1).
Electrochemical Measurements. Electrochemical investigation of the prepared materials was carried out in order to further confirm the presence of C60or monolith entrapped residues. Electrochemical
characterization was performed using a CH Instruments CHI 1040A electrochemical workstation (Austin, USA). A three-electrode system consisted of a working electrode, a BAS Ag/AgCl (3 M NaCl) reference electrode (West layette, USA) and a platinum wire counter electrode. Cyclic voltammetry (CV) measurements were performed using a glassy carbon electrode (GCE) or boron doped diamond electrode (BDD, diameter = 3 mm, Winsor Scientific, UK), which were polished using 0.3 μm and then 0.05 μm alumina powder, rinsed with deionized water, sonication in absolute ethanol, and finally rinsed with deionized water once more. Each electrode was then dried under nitrogen. Finally, the GCE or BDD was cleaned using CV in a 50 mM phosphate buffer solution (PBS), pH 7.0, between −0.5 and +1.5 V for GCE and −1.5 to 2 V for BDD at 0.1 V s−1, until a stable CV profile
was obtained.
A stock suspension of graphite (1 mg mL−1) was prepared by
dissolving in a solution of methanol containing 0.5% Nafion. The suspension (5 μL) was cast onto the surface of a freshly polished GCE (Graphite/Nafion/GCE) and dried at room temperature. The solvent was evaporated slowly in air, resulting in a uniform electrode film.
Carbon monolithic fragments (CM blank or NTCM) were prepared via crushing of the carbon monolith rod with a mortar and pestle. Modified electrodes were then prepared in the same way as for the graphite electrode, but replacing the graphite suspension with either a suspension of C60 fullerene, crushed CM blank, or crushed NTCM,
producing the various composite modified electrodes, denoted as C60/
Nafion/GCE, CM blank/Nafion/GCE and NTCM/Nafion/GCE, respectively. For the fabrication of modified BDD electrodes, carbon monolithic (CM blank or NTCM) powder was dispersed in dimethylformamide (1 mg mL−1) with intensive ultrasonication for
30 min. The suspension (5 μL) was cast onto the surface of a freshly polished working BDD electrode and dried at room temperature.
■
RESULTS AND DISCUSSIONPreparation of the Nanotemplated Carbon Monolith. The fullerene-modified silica (FMS) hard template used for the preparation of the nanotemplated carbon monolith was 5 μm sized aminated porous silica, modified with C60. On the basis of elemental analysis, the loading of C60upon the 5 μm silica was relatively high, up to 1.23 C60 molecules per nm2. This C60 coverage was reproducible from batch to batch, with variation of <4%.
The resorcinol-formaldehyde/Fe(III) system used for the fabrication of the nanotemplated carbon monolith was also noticeably different from that used for the formation of other types of carbon monoliths.22The resorcinol-formaldehyde resin is formed via a polycondensation mechanism, induced by HCl from partially hydrolyzed FeCl3.23 Fe(III) is also needed, as described below, to enhance the graphitization process at later stage of formation. In general, most phenolic resins are resistant to complete graphitization, even at temperatures of up to 2000 °C.3Such a high-temperature treatment will drastically reduce the mesoporosity of the glassy carbon, limiting its surface area for many applications.10 Thus, when the resorcinol-form-aldehyde carbon precursor is pyrolyzed at temperatures up to 1250 °C, it produces a largely amorphous structure, that resembles that of turbostratic carbon. To partially circumvent these issues, in situ catalytic graphitization, which can be obtained at a relatively low temperature, can be applied. In this study, FeCl3 is used to increase the degree of graphitization within the final monolithic carbon.10With such an approach it
was important to understand the precise combustion behavior process taking place, which obviously affects the physical and chemical properties of the resultant carbon monolith. In this regard, a series of thermal gravimetric analysis (TGA) studies
Figure 1.Thermogravimetric curves of CM blank and NTCM precursors and FMS template. (a) Weight remaining and (b) weight loss rate.
were carried out,24 which were used to mimic the
carbon-ization/graphitization process, to determine the composition of materials and evaluate their thermal stability up to 800 °C.
The thermogravimetric (TG) curve obtained for the FMS template material revealed four stages of weight loss. The first one occurred between 25 and 120 °C with a gradual weight loss of 0.3%, mainly attributed to adsorbed moisture vaporization, a loss also seen with samples of CM blank resin, NTCM resin, as well as pure samples of C60(Figure 1a). The next stage between 120 and 600 °C shows a gradual weight loss of ∼0.7% for the FMS, resulting from the deamination of the secondary amino substitute and unreacted primary amine from APS (Figure 1a), which is in agreement with the results of Jaroniec et al.25
This weight loss could also attributed to the partial decomposition of the substituted C60 molecules, as the pure C60 showed signs of decomposition beginning at ∼400 °C (Figure 1a, C60). The weight loss rate for FMS reached a maximum at ∼530 and ∼700 °C, for the third and final stage, respectively, with 5% total weight loss, mainly due to the decomposition of the covalently attached C60. However, these two temperature values were slightly shifted toward higher temperatures, compared to TGA of pure C60, which could be related to their covalent immobilization. Pure C60 under inert conditions showed a total loss of approximately 67% weight at 800 °C, in full agreement with literature data.26 The rapid weight loss of C60at ∼700 °C illustrated that the sublimation/ decomposition temperature was reached.
The TG curve for the NTCM sample (Figure 3a) resembled closely that of the CM blank, however it displayed a lower total weight loss (∼25%) and much lower weight loss rates at ∼450 °C and ∼640 °C. These differences should only arise from the
presence of thermally resistant C60. The NTCM TG curve also shows four stages of weight loss. As mentioned above, the first, between 25 and 140 °C, with a gradual weight loss of 1.7%, was mainly attributed to vaporization of physically adsorbed moisture, solvent residue and unreacted monomers. Following this, a series of three stages of weight loss occurred between 140 and 800 °C, with a total weight loss of 22.3%, dominated by the partial graphitization of the phenolic resin and the generation of water vapor, carbon monoxide, and hydrogen. During this graphitization process, the loss of water vapor, carbon monoxide, and hydrogen should result in sample weight loss as reflected by three substages (the maximum weight loss rate for stage I at ∼240 °C, stage II at ∼450 °C and stage III at ∼680 ± 20 °C). Most water vapor and carbon monoxide are generated from the carbon precursor in stage I, between ∼140 and ∼260 °C, with only ∼4% weight loss. Bulk carbonization occurs within stage II, the maximum weight loss rate being ∼50 °C lower than carbonization of the resin without the presence of the iron catalyst.18This weight loss is mainly related to the decomposition of surface oxides. Notably, the catalyzed graphitization temperature for NTCM in stage III from 600 to 800 °C, was ∼30 °C higher than the CM blank, indicating the C60was comparably more stable than the resin. There was no additional rapid weight loss, similar to that observed for C60, and such behavior implies that the phenolic resin limits the functional groups on the surface of the template from being fully oxidized. However, since only trace amounts of C60 have been introduced to the resultant monolith, the TG curve of NTCM shown in Figure 3a was not expected to show this relatively small loss. During the heat treatment to produce the NTCM, Fe(III) is assumed to be reduced to metallic Fe
Figure 2.FE-SEM image of (a) 5 μm FMS, (b) overall structure of NTCM, (c) macroporous structure, and (d) NTCM wall mesoporous structure.
ACS Applied Materials & Interfaces Research Article
dx.doi.org/10.1021/am402030m | ACS Appl. Mater. Interfaces 2013, 5, 8572−8580
nanoparticles,27,28a process which has been shown, both with
Fe and other transition metals, to induce the subsequent localized graphitization of the monolith.29
Structure and Morphology. FE-SEM of the monolith rods in cross-section revealed that the synthesized NTCM material possessed both abundant macro- and mesopores (Figure 2b−d). The macroporous structure reproduced the closely packed silica gel template (Figure 2a) exhibiting an interconnected open pore network. The macropore generating template particles were randomly oriented and closely packed within the phenolic resin mixture under gravitational force, before the resin was solidified. The diameter of macropores on average shrank by ∼13% (Figure 2c) in relation to the silica gel template particles. The main reason for this was the dehydrogenation and decomposition of oxygen-containing species, leading to the densification of the carbon walls during the thermal treatment and a reduction in the concentration of micropores. The degree of shrinkage seen herein is in good agreement with a previous study,17 and importantly, despite this shrinkage, there were no visible external or internal cracks seen throughout the prepared monoliths.
A high-magnification image (Figure 2d) shows the coarse surface texture and presence of irregular mesoporous structure upon the inner wall of the macropores within the NTCM samples. These features could result from the effect the hydrophobic C60 surface layer of the template particles has upon its inclusion within the resorcinol-formaldehyde resin mixture, as no such structure was seen with the CM blank, which used simply bare silica templates. In this case, the inner pore surfaces appeared considerably smoother in texture, including those materials produced within the previous work of Liang et al. and Eltmimi et al.10,17
TEM analysis of both the NTCM and CM blank samples was also performed. TEM images of NTCM (Figure 3b) appeared to confirm the absence of visible C60aggregates upon the walls of the NTCM material, and supported the process of partial graphitization of NTCM, as there were few obvious graphite strips woven into the carbon mass. However, in contrast, for the CM blank without incorporated C60, the degree of graphitization appeared to be higher, as confirmed by the presence of a high concentration of graphite ribbons (Figure 3a).
The energy-dispersive X-ray spectroscopy analysis (EDX) confirmed that the carbon content was 94 ± 2 wt % for NTCM, compared to 86 ± 3 wt % for the CM blank. The EDX analysis also revealed an oxygen content of 4 ± 1 wt % for the NTCM, which was considerably less than for the CM blank
material, at 10 ± 2 wt %. There were no detectable iron impurities within the samples. This was an important finding because the presence of Fe, even at a trace level is involved in electron transfer occurring at the monolith surface, affecting the response and reproducibility of such carbon monoliths if used as electrodes.21The presence of trace Si (<1%) is a result of incomplete removal of the template during the HF treatment, which can be reduced further through further exposure to HF. The EDX analysis confirmed there were no traces of nitrogen present in either CM blank or NTCM samples, in the latter case indicating the all the primary or secondary amines on the silica template were sacrificed during carbonization.
Surface Area Measurements.As shown in panels a and b in Figure 4, the nitrogen adsorption/desorption isotherm of the
CM blank and NTCM exhibited type IV isotherms, showing polymolecular adsorption in the mesoporous media. The adsorption hysteresis revealed the presence of a capillary condensation process in cylindrical pores with two openings. The geometry of pores can be estimated from the hysteresis loop form. Thus, the hysteresis loop for isotherms for both CM blank and NTCM belong to type B, which is characterized by the steep slope in the adsorption plot in the region close to the saturation pressure, and the steep slope for the desorption plot in the region of midrange pressures. Such forms of hysteresis can be an indication of cylindrical pores with bottle-shape structures (wide openings and narrow “necks”), or slit-type pores.30 Furthermore, the absence of a sharp condensation/
Figure 3.TEM images of (a) CM blank and (b) NTCM.
Figure 4.Nitrogen adsorption/desorption isotherms of (a) CM blank and (b) NTCM.
evaporation step, or a pronounced hysteresis loop for both isotherms implied that there was no ordered structure or narrow pore size distribution within the mesoporous carbon materials. Capillary condensation for both materials started at medium relative pressures, P/P0∼0.45, suggesting the skeleton pores in these carbons were mainly composed of mesopores. Pore diameters for the CM blank and NTCM estimated using the Barrett−Joyner−Halenda method31were 10.7 and 6.1 nm,
respectively.
For both isotherms, the first plateau was observed at relatively low P/P0values (∼0.15) showing that both materials possessed some microporous structure (Figure 4). Subse-quently, the total micropore volume derived from the t-plot was 0.028 and 0.016 cm3 g−1for the NTCM and the CM blank (average, n = 3), respectively. It is also clear from the isotherms seen, that the adsorption uptake at relative pressures below 0.05 P/P0, was higher for the NTCM sample, indicating a higher degree of adsorption within micropores. This finding shows that the introduction of fullerenes appeared to result in the formation of a greater concentration of micropores. Consider-ing the van der Waals diameter of a fullerene molecule (∼1.1 nm),32 the partial decomposition of fullerenes (shown earlier
by TGA) should theoretically result in the formation of pores with an average diameter below 2 nm.
The BET specific surface areas, evaluated at P/P0from 0.05 to 0.25, taking an average of three sample sets each, were calculated as 272 ± 32, and 435 ± 23 m2g−1, for the CM blank and NTCM, respectively (see Table 1). The total pore volume
was significantly higher for NTCM, namely 1.24 cm3 g−1, compared to 0.42 cm3 g−1 for the CM blank. As the only difference between NTCM and the CM blank was the use of the FMS templates, it was likely therefore that if these data are correct, the observed differences in both surface area and pore volumes, should stem first from the impact of the FMS surface upon the close formation of the polymer around the FMS template, and subsequently and perhaps more importantly from its impact upon the generation of a higher concentration of micropores within the macropore walls during carbonization. These data are summarized within Table 1.
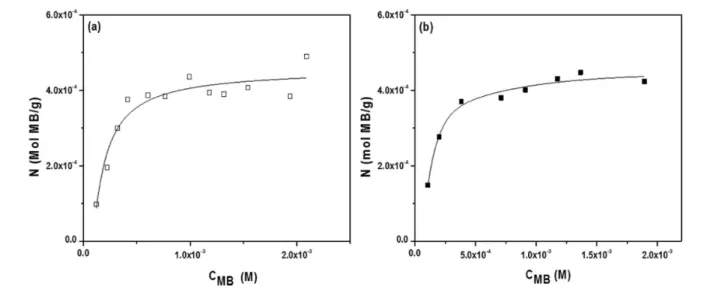
The adsorption behavior of methylene blue (MB) was also attempted as an alternative means to measure the specific area of NTCM and the CM blank. Methylene blue (319.87 g mol−1) has been used to determine the surface area of clays, and more recently for certain nanomaterials. Methylene blue in aqueous solution is a cationic dye, C16H18N3S+, which absorbs to negatively charged surfaces. Hence, the specific surface area of NTCM or the CM blank can be determined by the amount of absorbed MB. As a MB molecule with a rectangular shape (∼17 Å × 7.6 Å × 3.25 Å), MB can attach to target surface in various orientations, thus the area covered by one MB molecule will be different: (i) 130 Å2if the MB molecule lies on its largest face on the surface under study;33(ii) 66 Å2if the molecule is tilted (65−70°) with respect to the surface under study,34and (iii) only 24.7 Å2if the longest axis of MB is oriented perpendicular to the surface.35
Figure 5 shows the MB binding data on the two carbon monoliths (N vs CMB), both of which were reasonably well represented by the Langmuir isotherm. The plot of CMB/N vs CMB was then reconstructed, resulting in a straight line with CMB/N = 0.546 + 2020 CMB(R2= 0.944) for the CM blank and CMB/N = 0.334 + 2104 CMB (R2 = 0.992) for the NTCM sample. Using this approach the specific surface area of the CM blank was found to be very similar to the value obtained for NTCM: 387 and 372 m2 g−1, respectively. The similarity between the two values may be expected, given the inability of MB to penetrate the micropores within the carbon monoliths, and are reasonably comparable to the values obtained by the nitrogen adsorption BET measurements.
Raman Spectroscopy.On the basis of the pioneering work of Tuinstra et al.,36 Raman spectroscopy was applied to the Table 1. Structural Characteristics of NTCM Using CM
Blank As a Reference (n = 3) samples SBET a (m2g−1) Vtotal a (cm3g−1) D mesob(nm) Vmicroc (cm3g−1) CM-blank 272 ± 32 0.42 ± 0.08 6.54 ± 0.68 0.016 ± 0.004 NTCM 435 ± 23 1.24 ± 0.08 11.93 ± 0.38 0.028 ± 0.001 aThe Brunauer−Emmett−Teller (BET) method was used to calculate
the specific surface areas.bThe Barett−Joyner−Halenda method was
used to calculate mesopore diameter from the adsorption branches of the isotherms.cMicropore volumes were calculated by the t-plot.
Figure 5.Langmuir methylene blue adsorption isotherms of (a) CM blank and (b) NTCM.
ACS Applied Materials & Interfaces Research Article
dx.doi.org/10.1021/am402030m | ACS Appl. Mater. Interfaces 2013, 5, 8572−8580
NTCM and CM blank samples, and compared to the Raman spectrum of commercial graphite.
The Raman signature of NTCM exhibited three major peaks, as commonly observed for carbon nanotubes and other carbon materials, i.e., the sp3and sp2carbon phases coexisting in the sample (Figure 6). The positions of these peaks remain almost
constant. The D band, the disorder band, is located around 1350 cm−1, which is active in Raman as the result of the imperfections or loss of hexagonal symmetry in the carbon structure.29Therefore, this band has been used to evaluate the degree of imperfection or crystallinity of graphite.29 The G
band, common to all sp2carbon forms, observed around 1580 cm−1, corresponds to the Raman active 2E
2g mode of a two-dimensional network structure, i.e., the C−C bond stretching, in all carbon and graphitic materials.29 Previous studies have
revealed that intensity ratio of the D to the G band, R, (R = ID/ IG) was inversely proportional to the in-plane crystallite sizes (La).36,37The R value of NTCM was 0.43, which is lower than the value of the CM blank (0.64), but still much higher than the value of commercial graphite (0.14). These results again confirmed that the NTCM was still only partially graphitized, although the degree of graphitization was improved using the FMS template. Graphitization must be carried out at temper-ature 2000 °C or higher to achieve an R value close to commercial graphite, whereas in this work NTCM was only carbonized under 1250 °C to preserve its mesoporous structure.
Electrochemical Measurement. On the basis of the similarity between the Raman signature of NTCM and multiwalled carbon nanotubes (MWCNTs), a series of experiments was conducted to assess the applicability of NTCM as a substrate for electrode modifications. MWCNTs have been used very extensively for numerous important biosensing platforms and carbon monolithic substances has also been proven as useful materials for probing direct bioelec-trochemistry and selective detection of hydrogen peroxide.21
The electrochemical behavior of a glassy carbon electrode (GCE) modified with NTCM or CM was first evaluated by cyclic voltammetry (CV) and compared to that of the GCE modified with pristine C60 or graphite. Studying the electro-chemical performance of such materials is helpful to understand
their chemical composition and morphology.38 With Fe-(CN)63−/4− as a redox probe, the cyclic voltammograms of the modified GCEs exhibited quasi-reversible behavior, as ΔEp (peak separation between the anodic and cathodic peak) was noticeably greater than the theoretical value of 59 mV for a reversible electrochemical process. Considering the ΔEp value obtained for each modified electrode, the NTCM modified GCE (Figure 7f) resembled the C60modified GCE (Figure 7
(b)), whereas the CM modified GCE (Figure 7e) resembled the graphite modified GCE (Figure 7c). Furthermore, the response current to Fe(CN)63−/4− of the NTCM modified GCE (Figure 7f) was higher compared to the CM modified GCE (Figure 7e), implying a higher porosity and surface area of the resulting film.
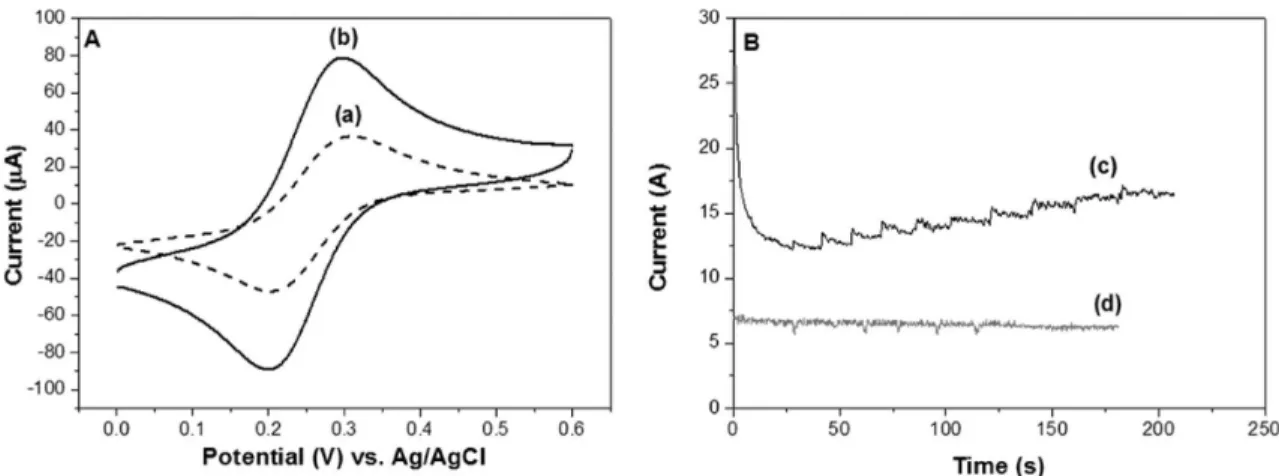
Following the above comparison, the modification of a boron-doped diamond (BDD) electrode with the new NTCM material was investigated. The BDD electrode was selected because it exhibits very high potentials for both oxygen and hydrogen evolution. The BDD film has attracted considerable interest in electrochemistry for use as active electrodes due to its superior chemical, physical, and mechanical inertness. Figure 8A (a) shows a cyclic voltammogram of a bare BDD electrode in 0.1 M KCl solution, once again containing Fe(CN)63−/4−(10 mM) as the probe.
A quasi-reversible process was also observed for the BDD electrode modified with NTCM (Figure 8A). Of interest was its lower ΔEpvalue of 91 mV, compared to 95 mV of the pristine BDD electrode. Such a result illustrated the relatively rapid electron-transfer rate at the NTCM modified diamond-solution interface. Given the above observation and to further demonstrate the potential applicability of NTCM in electro-chemistry fields, the NTCM-modified BDD electrode was then applied to the detection of hydrogen peroxide, a small molecule, which plays an important role in clinical and analytical chemistry. The NTCM modified BDD electrode was able to detect hydrogen peroxide with a detection limit of below 300 nM (Figure 8B, c) whereas the pristine BDD electrode was not responsive to this target compound (Figure 8B, d).
Figure 6.Raman spectrum of (a) commercial graphite, (b) CM blank,
and (c) NTCM. Figure 7.GCE, (C) graphite/Nafion, (d) C60/Nafion/GCE, (e) CM blank/Cyclic voltammograms (CVs) of (a) GCE, (b) Nafion/ Nafion/GCE, and (f) NTCM/Nafion/GCE.
■
CONCLUSIONIn brief, nanotemplated trimodal carbon monolithic materials were successfully synthesized using fullerene-modified silica gel as solid templates and resorcinol/formaldehyde as a carbon precursor, with Fe(III) as a localized graphitization catalyst. The nanotemplated monolith possessed both macropores and narrowly distributed mesopores, and increased micropores with sp3 and sp2 carbon phases coexistent in the samples. Furthermore, their textural properties such as BET specific surface area, pore volume, and pore size were increased for NTCM in comparison with the CM blank. All NTCM had a high specific surface area, high mesopore volume, and narrow size distributed mesopores. These NTCM materials are likely to find their use in a variety of applications including biomolecule adsorption, catalyst supports, drug delivery, or electrode materials.
■
AUTHOR INFORMATIONCorresponding Author
*E-mail: brett.paull@utas.edu.au.
Notes
The authors declare no competing financial interest.
■
ACKNOWLEDGMENTSThe authors thank Science Foundation Ireland (Grant Number 08/SRC/B1412) for research funding under the Strategic Research Cluster program and (Grant 03/IN.3/1361/EC07) for FE-SEM imaging. We thank Dr. Ali H. Eltmimi, Dr. Brendan Twamley and Mr. Maurice Burke, Mrs. Heather Davies, Dr. Satheesh Krishnamurthy and Prof. Peter Myers for their technical support and assistance, and Keith B. Male and Sabahudin Hrapovic of the National Research Council Canada for their help with the methylene blue binding assay and electrochemical measurement.
■
REFERENCES(1) Lee, J.; Kim, J.; Hyeon, T. Adv. Mater. 2006, 18, 2073−2094. (2) Liang, C.; Li, Z.; Dai, S. Angew. Chem., Int. Ed. 2008, 47, 3696− 3717.
(3) Lu, A. H.; Hao, G. P.; Sun, Q.; Zhang, X. Q.; Li, W. C. Macromol. Chem. Phys. 2012, 213, 1107−1131.
(4) Ryoo, R.; Joo, S. H.; Kruk, M.; Jaroniec, M. Adv. Mater. 2001, 13, 677−681.
(5) Meng, Y.; Gu, D.; Zhang, F. Q.; Shi, Y. F.; Yang, H. F.; Li, Z.; Yu, C. Z.; Tu, B.; Zhao, D. Y. Angew. Chem., Int. Ed. 2005, 44, 7053−7059. (6) Taguchi, A.; Smatt, J. H.; Linden, M. Adv. Mater. 2003, 15, 1209−1211.
(7) Shi, Z. G.; Feng, Y. Q.; Xu, L.; Da, S. L.; Zhang, M. Carbon 2003, 41, 2677−2679.
(8) Wang, Y.; Tao, S.; An, Y. Microporous Mesoporous Mater. 2012, 163, 249−258.
(9) Wen, X. R.; Zhang, D. S.; Shi, L. Y.; Yan, T. T.; Wang, H.; Zhang, J. P. J. Mater. Chem. 2012, 22, 23835−23844.
(10) Liang, C.; Dai, S.; Guiochon, G. Anal. Chem. 2003, 75, 4904− 4912.
(11) Shi, Z. G.; Chen, F.; Xing, J.; Feng, Y. Q. J. Chromatogr. A 2009, 1216, 5333−5339.
(12) Hu, Y. S.; Adelhelm, P.; Smarsly, B. M.; Hore, S.; Antonietti, M.; Maier, J. Adv. Funct. Mater. 2007, 17, 1873−1878.
(13) Hao, G. P.; Li, W. C.; Qian, D.; Wang, G. H.; Zhang, W. P.; Zhang, T.; Wang, A. Q.; Schueth, F.; Bongard, H. J.; Lu, A. H. J. Am. Chem. Soc. 2011, 133, 11378−11388.
(14) Lu, A. H.; Smatt, J. H.; Backlund, S.; Linden, M. Microporous Mesoporous Mater. 2004, 72, 59−65.
(15) Álvarez, S.; Fuertes, A. B. Mater. Lett. 2007, 61, 2378−2381. (16) Xu, L. Y.; Shi, Z. G.; Feng, Y. Q. Microporous Mesoporous Mater. 2008, 115, 618−623.
(17) Eltmimi, A. H.; Barron, L.; Rafferty, A.; Hanrahan, J. P.; Fedyanina, O.; Nesterenko, E.; Nesterenko, P. N.; Paull, B. J. Sep. Sci. 2010, 33, 1231−1243.
(18) Sevilla, M.; Fuertes, A. B. Carbon 2013, 56, 155−166. (19) Gumanov, L. L.; Volkov, G. A.; Shastin, A. V.; Korsounskii, B. L. Russ. Chem. B+ 1996, 45, 768−770.
(20) Chang, C. S.; Den, T. G.; Chen, C. C.; Lee, S. L. J. High Res. Chromatogr. 1997, 20, 624−628.
(21) He, X.; Zhou, L.; Nesterenko, E. P.; Nesterenko, P. N.; Paull, B.; Omamogho, J. O.; Glennon, J. D.; Luong, J. H. T. Anal. Chem. 2012, 84, 2351−2357.
(22) Huang, Y.; Cai, H.; Feng, D.; Gu, D.; Deng, Y.; Tu, B.; Wang, H.; Webley, P. A.; Zhao, D. Chem. Commun. 2008, 2641−2643.
(23) Al-Muhtaseb, S.; Ritter, J. A. Adv. Mater. 2003, 15, 101−114. (24) Zhang, S.; Li, L.; Kumar, A. Materials Characterization Techniques; CRC Press Taylor & Francis Group: Boca Raton, FL, 2009; pp 290−291.
(25) Jaroniec, C. P.; Gilpin, R. K.; Jaroniec, M. J. Phys. Chem. B 1997, 101, 6861−6866.
(26) Egashira, M.; Hoshii, K.; Araki, T.; Korai, Y.; Mochida, I. Carbon 1998, 36, 1739−1747.
(27) Leventis, N.; Chandrasekaran, N.; Sadekar, A. G.; Mulik, S.; Sotiriou-Leventis, C. J Mater. Chem. 2010, 20, 7456−7471.
Figure 8. (A) Cyclic voltammograms (CV) of (a) bare BDD electrode and (b) NTCM-modified BDD electrode (scan rate, 0.1 V/s). (B) Amperometric response (I vs t) of (c) the NTCM-modified BDD electrode and the bare BDD electrode (d) to successive addition of 5 μM hydrogen peroxide. The electrodes were poised at +1.4 V vs Ag/AgCl with 20 mM phosphate buffer pH 7 as the supporting electrolyte.
ACS Applied Materials & Interfaces Research Article
dx.doi.org/10.1021/am402030m | ACS Appl. Mater. Interfaces 2013, 5, 8572−8580
(28) Titirici, M.-M.; Antonietti, M.; Thomas, A. Chem. Mater. 2006, 18, 3808−3812.
(29) Maldonado-Hodar, F. J.; Moreno-Castilla, C.; Rivera-Utrilla, J.; Hanzawa, Y.; Yamada, Y. Langmuir 2000, 16, 4367−4373.
(30) Gregg, S. J.; Sing, K. S. W. Adsorption, Surface Area, and Porosity; Academic Press: London, 1967; pp 144−149.
(31) Barrett, E. P.; Joyner, L. G.; Halenda, P. P. J. Am. Chem. Soc. 1951, 73, 373−380.
(32) Qiao, R.; Roberts, A. P.; Mount, A. S.; Klaine, S. J.; Ke, P. C. Nano Lett. 2007, 7, 614−619.
(33) Hang, P. T.; Bradley, G. W. Clay Clay Miner. 1970, 18, 203− 212.
(34) Hähner, G.; Marti, A.; Spencer, N. D.; Caseri, W. R. J. Chem. Phys. 1996, 104, 7749−7757.
(35) Borkovec, M.; Wu, Q.; Degovics, G.; Laggner, P.; Sticher, H. Colloid Surface A 1993, 73, 65−76.
(36) Tuinstra, F.; Koenig, J. L. J. Chem. Phys. 1970, 53, 1126−1130. (37) Dresselhaus, M. S.; Jorio, A.; Hofmann, M.; Dresselhaus, G.; Saito, R. Nano Lett. 2010, 10, 751−758.
(38) Wang, Z.; Lu, Z.; Huang, X.; Xue, R.; Chen, L. Carbon 1998, 36, 51−59.
■
NOTE ADDED AFTER ASAP PUBLICATIONThis paper was published on the Web on August 20, 2013, with minor text errors and a spelling error in the Synopsis/Abstract graphic. The corrected version was reposted on August 22, 2013.