AbstrAct
the local and regional structural pattern of volcanic edifices strongly controls the space distribution of electrical resistivity. Here we report on the structural context of the western part of the Las cañadas caldera of tenerife (Lcc) thought to have initiated the formation of the caldera. Using a new dataset of 11 audiomagnetotelluric tensors we emphasize the resistivity distribution of Ucanca caldera and propose a major revision of its extension. We find that
Ucanca caldera has a limited westwards extent and that El cedro sector is a depression margin of the caldera. According to the extent of hydrothermal-ized rocks at the base of the Lcc wall and the distribution of Pico teide – Pico Viejo vents, we constrain the location and size of Ucanca caldera. the inter-pretation of these results also constrains the extension of the Icod Valley and proposes a headwall located below the Pico teide – Pico Viejo complex.
1. Introduction
Electrical resistivity distribution in volcanic edifices constitutes a crucial knowledge to infer the structural pattern, the presence of geothermal systems or even magma at depth (benderitter 1987; Ogawa et al. 1998; Zlotnicki et al. 2006). both the fault distribution and regional tectonics control fluid migration from deeper parts through preferential paths and new magma as-cents (Galindo et al. 2005). From primary rocks, hydrothermal alteration processes create new minerals extremely sensitive to physical conditions (Mas et al. 2006). the clay minerals gen-erated along fault systems drastically reduce the bulk resistiv-ity of the rocks at small or larger scale (Zlotnicki et al. 2006), with major implications for rock permeability and groundwater flow (courteaud et al. 1997). Outcropping or at depth, these low resistivity bodies are usually interpreted as hydrothermal or geothermal systems, faults, cap rocks or even magma (bend-eritter & Gérard 1984; Ogawa et al. 1998; Zlotnicki et al. 2006). In caldera environments, these resistivity contrasts, highlighted by geophysical techniques, reveal the structure of prior volca-nic edifices and fault patterns related to the caldera formation (coppo et al. 2008). In tenerife, three magnetotelluric (Mt) studies investigated the Lcc to reveal its resistivity structure (Ortiz et al. 1986; Pous et al. 2002; coppo et al. 2008). However, very few Mt and audiomagnetotelluric (AMt) soundings were
carried out in the western, older Ucanca caldera. Our recent work on the eastern Lcc showed the capability of the AMt method to highlight shallow conductive structures related with caldera formation by vertical collapse (Pous et al. 2002; coppo et al. 2008). In order to fill the gap of geophysical data con-straining the western part of the Lcc, eleven AMt soundings distributed along a new profile were carried out. three other sites were added from a previous Mt/AMt profile to confirm the presence of pre-caldera rocks at shallow depth (Ablay & Marti 2000; Pous et al. 2002) (Fig. 1).
2. Geological settings
tenerife, the largest island of the canarian archipelago (Fig. 1), lies a few hundred kilometres off the African coast. It is home to the second largest oceanic island volcanic complex in the world after Mauna Loa and Mauna Kea in Hawaii. sub-aer-ial volcanic activity started at the three corners of the island (12–3.5 Ma), then concentrated in the central part after a long-lasting period, building the Las cañadas Edifice (LcE) (Marti et al. 1994a). Following these authors, the LcE includes a com-plex and poorly studied Lower Group (3.5–2 Ma), and an Up-per Group (1.6–0.17 Ma). the UpUp-per Group consists of three formations: Ucanca (1.54–1.07 Ma), Guajara (0.85–0.57 Ma) and Diego Hernandez (0.38–0.18 Ma), ending each by caldera
structural pattern of the western Las cañadas caldera
(tenerife, canary Islands) revealed by audiomagnetotellurics
N
icolasc
oppo, p
ierre-a
Ndrés
chNegg*, p
ierikF
alco, r
obertoc
osta& M
artiNb
urkhard†Key words: tenerife, caldera, audiomagnetotellurics, hydrothermal alteration, ring fault
1661-8726/08/020409-5
DOI 10.1007/s00015-008-1270-4 birkhäuser Verlag, basel, 2008
swiss J. Geosci. 101 (2008) 409–413
Geomagnetism Group, Institute of Geology and Hydrogeology, University of Neuchâtel, cP 158, 2009 Neuchâtel, switzerland. *corresponding author: Pierre-André schnegg. E-mail: pierre.schnegg@unine.ch,
collapse, forming the current Lcc (Fig. 1) (Marti et al. 1994a). stratigraphical, structural, petrological, volcanological, geo-chronological and geophysical data indicate that the Lcc is an overlapping collapse caldera generated by north-eastwards magma chamber migration, associated with a long history of phonolitic explosive activity in the central part of the island (Marti et al. 1997; Marti & Gudmundsson 2000).
3. The audiomagnetotelluric method
the Mt method is a passive surface geophysical technique that uses the Earth’s natural EM fields to investigate the electri-cal resistivity distribution at depth, from tens of metres to tens of kilometres (Vozoff 1991). the AMt technique uses higher frequencies (above 1 Hz) generated by the permanent thunder-storm activity occurring around the world. AMt was success-fully applied in many volcanic environments (benderitter & Gérard 1984; courteaud et al. 1997; Ogawa et al. 1998; Pous et al. 2002). A description of the method can be found in simpson and bahr (2005). An AMt recording system developed at the
University of Neuchâtel, light enough to be carried by a crew of two, has been used. the four horizontal components were sampled at 2 kHz during 8 minutes in the Ns and EW direc-tions and in the period range 0.001 to 0.3 second. Preliminary screen display of the sounding curves (apparent resistivities and phases) was available in the field. two 50 m-long telluric lines were arranged orthogonally and connected to non-polar-izing electrodes made of acrylic tubes ended by porous ceramic. Inside the tube a non-polarizing Ag–Agcl slat designed for ocean studies (Filloux 1987) was immersed in a saturated Kcl solution leaking through the ceramic. two horizontal magnetic induction coils (EcA cM16) were installed orthogonally to each other along the axes of the telluric lines. AMt PA profile extends from the base of El cedro to 7.5 km north-westwards and comprises 11 soundings (Figs. 1 and 3). three other sites were arranged between previous sites from Pous et al. (2002) (Fig. 1).
4. Results
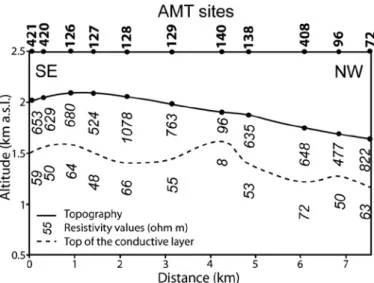
the overall data quality was very good and permitted accurate estimation of the transfer functions. Most of the data show a uniform, close to 1D behaviour and display similar results in the whole area, in good agreement with Pous et al. (2002). the shape of the apparent resistivity and phase curves reveals a re-sistive overlying a conductive layer (Fig. 2). At times a third layer appears at depth, allowing estimation of the thickness of the conductive layer. In this article, however, we only focus on the thickness of the first layer and the resistivity of the two first layers. Only a few sites show curve splitting at higher and lower frequencies due to shallow heterogeneities and signal weakness. to help remove this uncertainty and better con-strain the apparent resistivity of the first layer we used the Very-Low-Frequency-resistivity (VLF-r) technique, in which public broadcasting transmitters provide the magnetic signal. then, invariants of all AMt soundings have been modelled separately using a 1D modelling scheme (Fischer & Le Quang 1981; schnegg 1993) (Fig. 2). Finally, subtracting the thickness of the first resistive layer from the altitude, elevation of the top conductive layer was found. resistivity values are indicated on the profile of figure 3. Using the same dataset, 2D inversion with the rEbOcc code (siripunvaraporn & Egbert 2000) con-firmed the validity of the 1D approach. recently, 3D results indicated that the ocean effects start above 4 s for the phase and 20 s for the apparent resistivity (Pous et al. 2002; Monteiro santos et al. 2006). therefore these effects can be neglected for the investigated period range.
the figure shows 1D modelling results of PA profile. the surface altitude of the conductive layer shows two depressions. they are separated by a conductive body (sounding #140) in the central part of the profile. conductive rocks are overlain by more resistive (450 to 1000 Ωm) material. the first depres-sion extends to km 4 and reaches a depth of 650 m. to the west, the second extends to km 7.5 at shallower depth. the results of the three AMt soundings (Fig. 1) completing the
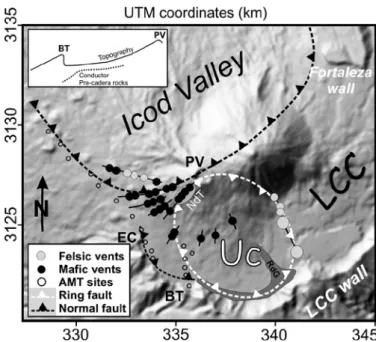
previ-Fig. 1. shaded relief map of the Las cañadas caldera. Inset: Location of te-nerife in the canary Islands with a very simplified geological sketch. Lcc: Las cañadas caldera; LcE: Las cañadas edifice; PtPVc: Pico teide – Pico Viejo complex; Obs: Old basaltic series; PsMVZ: Post-shield mafic volcanic zone. black square: Investigated area. three dashed white circles: Ucanca (Uc), Guajara (Gua) and Diego Hernandez (DH) calderas. small white circles: New AMt soundings. small black circles: Old soundings by Pous et al. (2002). crossed circles: AMt sites presented here. black triangles: three boreholes (Ablay & Marti 2000). PA: Main NW profile. PU: Part of a previous profile in which 3 new AMt sites have been added. bt: boca tauce, Ec: El cedro, rdG: roques de Garcia.
ous Mt/AMt Ucanca profile (Pous et al. 2002) are in perfect agreement with the old data and indicate a conductive layer at ~200 m depth in this area of Ucanca caldera.
5. Interpretation
In Ucanca caldera, geological data collected in three boreholes indicate the presence of pre-caldera rocks at around 125 m depth (Ablay & Marti 2000). close to roques de Garcia and borehole b3 (Fig. 1), the results of 20 AMt soundings (coppo et al. 2008) indicated very good correlation between the top conductive layer and the pre-caldera rocks (borehole b3, Ablay & Marti 2000). AMt results of the Ucanca PU profile (Fig. 1) found the conductive layer at 200 m depth (Pous et al. 2002). this indicates that pre-caldera rocks have a flat topography between boreholes b3 and b4. However, close to El cedro, PA profile found the top at more than 500 m depth. since the con-ductive layer does not extend horizontally to the s-W, we infer a steep deepening of the conductive layer towards El cedro with a slope of 30%. recently, coppo et al. (2008) showed that caldera ring faults could be precisely located from low
resistiv-ity circular bodies. For this reason, we rule out the hypothesis of El cedro wall as included in the western part of Ucanca caldera (Marti et al. 1998). We propose to restrict Ucanca caldera to the east and suggest a new and smaller extent (Fig. 4). Its southern part is bounded between Guajara and boca tauce by the ex-tension of hydrothermalized rocks at the base of the Lcc wall. the historical eruption of Pico Viejo (PV) along the Narices del teide fissure (Ablay & Marti 2000) is interpreted as a likely expression of the western part of the caldera. the northern part is defined by the tectonic direction that controls the Pt-PV complex and the eastern part is thought to be related with the felsic vents of Pico teide (Pt) located in Guajara caldera. then, Ucanca caldera can be seen as an elliptical caldera of size 6.5 × 5.5 km.
We finally interpret the El cedro sector as a depression margin of Ucanca caldera or as a circumferential faulting that developed along the arcuate normal fault initiated by the cal-dera collapse (Fig. 4). Using analogue modelling, two works showed that such fault pattern is common during caldera col-lapse (Marti et al. 1994b; Walter & troll 2001). being of smaller extent and unconnected to the magma chamber system, these peripheral faults prevented fluid migration through preferen-tial paths. this model provides a reliable explanation for the absence of altered rocks at the base of the El cedro wall.
this configuration of the western Lcc may explain the westward opening of the Lcc and the postulated buried exten-sion of its wall. this was considered as morphological arguments for the lateral collapse hypothesis of the Lcc formation (An-cochea et al. 1999). Our geophysical interpretation proposes a new scenario that integrates morphological and volcanologi-cal aspects. these arguments support volcanologivolcanologi-cal evidences indicating that the Ucanca magma system was relatively small and may have comprised several initially independent reser-voirs prior to the final collapse (Marti et al. 1998). In fact,
us-Fig. 2. Invariant (thin black line with error bars) and 1D model (thick black line) of 4 AMt sites (420, 128, 140 and 72, see Fig. 1 for location). curves of apparent resistivity (above) and phase (below).
Fig. 3. 1D resistivity model of PA profile from 1D invariant modelling. Above are the AMt sites. topography, altitude surface of the conductive layer and resistivity.
ing only the morphology of the western part of the Lcc, it is not possible to define a clear elliptical morphology for Ucanca caldera. thus, both geophysical arguments and volcanological data provide an explanation for this western caldera.
A recent work demonstrated that El cedro sector is char-acterized by a low magnetic anomaly thought to be part of a continuous low in the whole Lcc (Araña et al. 2000). this was interpreted as a structure of inverse polarity located beneath the western caldera rim, since its amplitude requires a very strong magnetisation contrast at shallow depth. the authors proposed that such low magnetic anomaly was induced by the presence of intensely hydrothermally altered materials (Araña et al. 2000). However, while a high resistivity contrast does ex-ist between El cedro sector and the centre of Ucanca, the high resistivity body measured close to El cedro suggests that the origin of the magnetic low has a different origin.
PA profile also highlights a long and shallow conductive body extending from 4 to 7.5 km (Fig. 3). It is interpreted as the intersection with the santiago del teide ridge, one of the two main eruptive lineaments (the Dorsal sW-NE ridge and santiago del teide sE-NW ridge) thought to have controlled tenerife evolution (Marti et al. 1998). the presence of the con-ductor at shallow depth is thought to be related with the devel-opment of a hydrothermal system associated with the numer-ous mafic vents of this area (Fig. 4). AMt data obtained in the
Icod Valley also suggest that this conductive zone might be an extension of the body that defines the western limit of the val-ley (coppo et al. 2007).
6. Conclusions
the audiomagnetotelluric method allowed us to highlight the resistive structure of the western part of the Lcc. Our results indicate that Ucanca caldera was probably smaller than previ-ously thought. It is circumscribed by the southern vents of Pico Viejo (Narices del teide), PV itself, the felsic vents of the teide and the sector of the Lcc wall between Guajara and boca tauce. Owing to the absence of altered rocks at the base of the El cedro sector and a thick sequence of resistive rock close to the wall, El cedro sector is attributed to a depression margin or a peripheral fault of Ucanca caldera. Outside the Lcc, a shal-lower and long conductive body is attributed to the intersection with the main eruptive lineament crossing the Lcc or to the margin of the Icod landslide. Finally, these results constrain the location of the headwall of the Icod Valley below the Pico teide – Pico Viejo complex.
Acknowledgements
this project has been financed through grants from the swiss National science Foundation (sNsF), project no. 200020-111758/1. Our acknowledgements go to Dr. Pierre Gex and to a second anonymous reviewer for helpful comments and improvements of the manuscript.
rEFErENcEs
Ablay, G.J. & Marti, J. 2000: stratigraphy, structure, and volcanic evolution of the Pico teide-Pico Viejo formation, tenerife, canary Islands. Journal of Volcanology and Geothermal research 103, 175–208.
Ancochea, E., Huertas, M.J., cantagrel, J.M., coello, J., Fúster, J.M., Arnaud, N. & Ibarrola, E. 1999: Evolution of the cañadas edifice and its implications for the origin of the cañadas caldera (tenerife, canary Islands). Journal of Volcanology and Geothermal research 88, 177–199.
Araña, V., camacho, A.G., Garcia, A., Montesimos, F.G., blanco, I., Viera, r. & Felpeto, A. 2000: Internal structure of tenerife (canary Islands) based on gravity, aeromagnetic and volcanological data. Journal of Volcanology and Geothermal research 103, 43–64.
benderitter, Y. 1987: recherche par géophysique d’indices peu profonds en géothermie haute énergie. Un exemple à proximité de la montagne Pelée (Martinique). bulletin de la société Géologique de France III (6), 1055–1061.
benderitter, Y. & Gérard, A. 1984: Geothermal study of reunion island: au-diomagnetotelluric survey. Journal of Volcanology and Geothermal re-search 20, 311–332.
coppo, N., schnegg, P.-A., Falco, P., Heise, W. & costa, r. 2008: Multiple cal-dera collapses inferred from the shallow electrical resistivity signature of the Las cañadas caldera, tenerife, canary Islands. Journal of Volcanology and Geothermal research, 170, 153–166.
coppo, N., schnegg, P.-A., Falco, P. & costa, r. 2007: tsunamigenic risk to-wards north Atlantic shorelines. submitted to EPsL.
courteaud, M., ritz, M., robineau, b., Join, J.-L. & coudray, J. 1997: New geological and hydrogeological implications of the resistivity distribution inferred from audiomagnetotellurics over La Fournaise young shield vol-cano (reunion Island). Journal of Hydrology 203, 93–100.
Filloux, J. 1987: Instrumentation and experimental methods for oceanic stud-ies. In: Jabobs (Ed.), Geomagnetism. Academic Press, London. Fig. 4. structural sketch of the western part of the Lcc. the white dashed line
shows the proposed extension of Ucanca caldera and its main ring fault. Light grey and dark circles indicate the location of felsic and mafic vents of PtPVc, after Marti et al. (1998). the black dashed lines show the normal fault respon-sible for the Icod landslide and the El cedro sector. the grey ellipse shows the historical eruption of the Narices del teide (Ndt). rdG: roques de Garcia; bt: boca tauce; Ec: El cedro; PV: Pico Viejo. the arcuate middle-grey area shows the extension of hydrothermalized rocks at the foot of the Lcc wall (after the geological map in Hernandez et al. (2003). Inset in the upper left corner: schematic profile between boca tauce and Pico Veijo.
Fischer, G. & Le Quang, b.V. 1981: topography and minimization of standard deviation in one-dimensional magnetotelluric inversion scheme. Geo-physical Journal royal Astronomical society 67, 279–292.
Galindo, I., soriano, c., Martí, J. & Pérez, N. 2005: Graben structure in the Las cañadas edifice (tenerife, canary Islands): Implications for active degas-sing and insights on the caldera formation. Journal of Volcanology and Geothermal research 144 (1–4), 73–87.
Hernández, P., Pérez, N., salazar, J., reimer, M., Notsu, K. & Wakita, H. 2003: ra-don and helium in soil gases at cañadas caldera, tenerife, canary Islands, spain. Journal of Volcanology and Geothermal research 2721, 1–18. Marti, J., Mitjavila, J. & Araña, V. 1994a: stratigraphy, structure and
geochro-nology of the Las cañadas caldera (tenerife, canary Islands). Geological Magazine 131 (6), 715–727.
Marti, J., Ablay, G.J., redshaw, L.t. & sparks, r.s.J. 1994b: Experimental stud-ies of collapse calderas. Journal of the Geological society 151, 919–929. Marti, J. & Gudmundsson, A. 2000: the Las cañadas caldera (tenerife, canary
Islands): An overlapping collapse caldera generated by magma-chamber migration. Journal of Volcanology and Geothermal research 103, 161–173. Marti, J., Hürlimann, M., Ablay, G.J. & Gudmundsson, A. 1997: Vertical and lateral collapses on tenerife (canary Islands) and other volcanic oceanic islands. Geology 25, 879–882.
Marti, J., Mitjavila, J., Zafrilla, s., Folch, A., soriano, c., turon, E., Hürlimann, M., Queralt, I., Neumann, E.r., Ablay, G.J. & Araña, V. 1998: the central volcanic complex of tenerife (canary Islands). 627–639.
Mas, A., Guisseau, D., Patrier Mas, P., beaufort, D., Genter, A., sanjuan, b. & Girard, J.P. 2006: clay minerals related to the hydrothermal activity of the bouillante geothermal field (Guadeloupe). Journal of Volcanology and Geothermal research 158, 380–400.
Monteiro santos, F.A., trota, A., soares, A., Luzio, r., Lourenço, N., Matos, L., Almeida, E., Gaspar, J.L. & Miranda, J.M. 2006: An audiomagnetotelluric investigation in terceira Island (Azores). Journal of Applied Geophysics 59 (4), 314–323.
Ogawa, Y., Matsushima, N., Oshima, H., takakura, s., Utsugi, M., Hirano, K., Igarashi, M. & Doi, t. 1998: A resistivity cross-section of Usu volcano, Hokkaido, Japan, by audiomagnetotelluric soundings. Earth Planets space 50, 339–346.
Ortiz, r., Araña, V., Astiz, M. & García, A. 1986: Magnetotelluric study of the teide (tenerife) and timanfaya (Lanzarote) volcanic areas. Journal of Volcanology and Geothermal research 30 (3–4), 357–377.
Pous, J., Heise, W., schnegg, P.-A., Muñoz, G., Marti, J. & soriano, c. 2002: Mag-netotelluric study of the Las cañadas caldera (tenerife, canary Islands): structural and hydrogeological implications. Earth and Planetary science Letters 204, 249–263.
schnegg, P.-A. 1993: An automatic scheme for 2D magnetotelluric modelling, based on low-order polynomial fitting. Journal of Geomagnetism and Geoelectricity 45, 1039–1043.
simpson, F. & bahr, K. 2005: Practical Magnetotellurics. cambridge Univer-sity Press, cambridge, 254 pp.
siripunvaraporn, W. & Egbert, G. 2000: An efficient data-subspace inversion method for 2D magnetotelluric data. Geophysics 65, 791–803.
Vozoff, K. 1991: the magnetotelluric method. In: M.N. Nabighian (Editor), Electromagnetic Methods in Geophysics. society of Exploration Geo-physicists tulsa, Oklahoma, UsA, 641–711 pp.
Walter, t.r. & troll, V.r. 2001: Formation of caldera periphery faults: An ex-perimental study. bulletin of Volcanology 63, 191–203.
Zlotnicki, J., Vargemezis, G., Mille, A., bruère, F. & Hammouya, G. 2006: state of the hydrothermal activity of soufrière of Guadeloupe volcano inferred by VLF surveys. Journal of Applied Geophysics 58 (4), 265–279.
Manuscript received November 14, 2007 revision accepted March 15, 2008 Published Online first July 28, 2008 Editorial Handling: J. Mosar, s. bucher