ORIGINAL ARTICLE
Effect of emaciation and obesity on small-animal internal
radiation dosimetry for positron-emitting radionuclides
Tianwu Xie&Habib Zaidi
Received: 14 March 2013 / Accepted: 10 June 2013 / Published online: 2 July 2013 # Springer-Verlag Berlin Heidelberg 2013
Abstract
Purpose Rats are widely used in biomedical research involv-ing molecular imaginvolv-ing and therefore the radiation dose to animals has become a concern. The weight of laboratory animals might change through emaciation or obesity as a result of their use in various research experiments including those investigating different diet types. In this work, we eval-uated the effects of changes in body weight induced by emaciation and obesity on the internal radiation dose from common positron-emitting radionuclides.
Methods A systematic literature review was performed to determine normal anatomical parameters for adult rats and evaluate how organs change with variations in total body weight. The ROBY rat anatomical model was then modified to produce a normal adult rat, and mildly, moderately and severely emaciated and obese rats. Monte Carlo simulations were performed using MCNPX to estimate absorbed frac-tions, specific absorbed fractions (SAFs) and S-values for these models using different positron-emitting radionuclides. The results obtained for the different models were compared to corresponding estimates from the normal rat model. Results The SAFs and S-values for most source–target pairs between the various anatomical models were not significantly different, except where the intestine and the total body were considered as source regions. For the intestine, irradiating
other organs in the obese model, the SAFs in organs in the anterior region of the splanchnocoele (e.g. kidney, liver and stomach) increased slightly, whereas the SAFs in organs in the posterior region of the splanchnocoele (e.g. bladder and testes) decreased owing to the increase in the distance separating the intestine and posterior abdominal organs because of the rat epididymal fat pad. For the total body, irradiating other or-gans, the SAFs and S-values were inversely related to body weight.
Conclusion The effect of obesity on internal radiation dose is insignificant in most conditions for common positron-emitting radionuclides. Emaciation increases the cross-absorbed dose to organs from surrounding tissues, which might be a notable issue in laboratory animal internal dosimetry.
Keywords Radiation dosimetry . Small animals . PET . Monte Carlo . Computational models
Introduction
The role of transgenic and knockout mice has become pro-found and widespread in biomedical research. Nowadays, transgenic laboratory animals can be designed and created in a way that offers attractive possibilities for addressing basic research questions concerning the genetic, molecular and cellular basis of biology and disease. Rats are widely used as models of human disease in preclinical trials for the development of new molecular imaging probes, drug discov-ery, gene expression, development of therapeutic targets, targeted therapies and many other research applications [1, 2]. With the ever increasing number and importance of human disease models in rodents, the potential of high-resolution preclinical PET instrumentation to contribute unique information has become evident. In this context, the accurate assessment of radiation dose delivered to laboratory animals in experiments involving the use of multimodality
T. Xie
:
H. Zaidi (*)Division of Nuclear Medicine and Molecular Imaging, Geneva University Hospital, 1211 Geneva 4, Switzerland e-mail: habib.zaidi@hcuge.ch
H. Zaidi
Geneva Neuroscience Center, Geneva University, 1205 Geneva, Switzerland
H. Zaidi
Department of Nuclear Medicine and Molecular Imaging, University Medical Center Groningen, University of Groningen, 9700 RB Groningen, Netherlands
molecular imaging instruments including SPECT, PET and CT is of paramount importance.
For this purpose, various computational rat models have been used extensively as input to Monte Carlo-based radia-tion transport packages to achieve this goal. To this end, three types of computational models have emerged: (1) styl-ized models, (2) voxel-based models, and (3) hybrid equa-tion–voxel-based models [3]. Stylized models use simple equation-based mathematical functions (surface equations) to represent internal organs and external boundaries of the defined model, thus minimizing computational time. Voxel-based models employ voxel matrices derived from segment-ed tomographic images for the best anatomical authenticity. The recently introduced hybrid equation–voxel approach combines the first two approaches by allowing the mathe-matical description of organ boundaries from definitions extracted from voxel data [4].
Hui et al. [5] developed the first stylized mouse model for radiation dose calculation. Further improvements led to finer stylized small-animal models including rat [6,7] and mouse models containing more internal organs and even realistic tumour models [8–10]. Likewise, various voxel-based small-animal models have been developed by different groups for radiation dosimetry research using different specimens [11–19]. More recently, computational models of laboratory animals based on non-uniform rational B-spline surfaces (NURBS) have become available [20]. These models repre-sent surface contours of organs and tissues, and thus retain most anatomical characteristics and offer the flexibility of deforming these structures more realistically. They are be-coming more and more popular and are now considered standard for Monte Carlo-based radiation transport calcula-tions [21,22]. However, there is an intrinsic variability in the total body weight of rats because of differences between specimens. Moreover, in some preclinical research studies, the weight of laboratory animals used in longitudinal studies can be modified by emaciation or obesity because of sec-ondary effects of drugs, radiation therapy or chemotherapy and the use of dietary or fat regimes [23–28]. In adult rats older than 250–300 days, the increase in weight, referred to as adult‘growth’ [29], has been reported to be due mostly to fat deposition. Therefore, the assessment of the impact of changes in body weight due to emaciation and obesity on internal radiation dose from common radionuclides used in molecular imaging is highly desired and has not been report-ed before in the scientific literature.
In this work, the model used for reference dose estimation was based on the growth chart and reported weight and length values of 11-week old normal adult male rats [30]. We constructed a series of models representing mildly, moderately and severely emaciated and obese rats of the same age, and compared the resulting specific absorbed fractions (SAFs) and S-values for common positron-emitting radionuclides with
those in the normal rat model. The assessment of the variabil-ity in absorbed dose estimates with emaciation and obesvariabil-ity is important to understand the uncertainties involved in internal radiation dose calculations for small animals.
Materials and methods
Design of computational rat models
The normal rat model was constructed from the realistic four-dimensional digital rat whole-body (ROBY) model [20] according to the reported weight and length values for 11-week old normal adult male rats (Fig.1d) [30]. The weight/length ratio is used to determine whether a given rat is emaciated or obese [30]. The weight/length ratio of 11-week-old normal adult male rats (NWLR11) was set as the reference in this work. Similar to
the concept of body mass index used in human health-care standards [31,32], we divided rats at the same age (11 weeks) into seven different categories according to the percentage weight/length ratio in relation to the NWLR11 (%NWLR11):
severely emaciated (≤75 %NWLR11), moderately emaciated
(76–85 %NWLR11), mildly emaciated (86–95 %NWLR11),
nor-mal (96–119 %NWLR11), mildly obese (120–129 %NWLR11),
moderately obese (130–149 %NWLR11) and severely obese
(≥150 %NWLR11). The lengths of the rat models were kept at
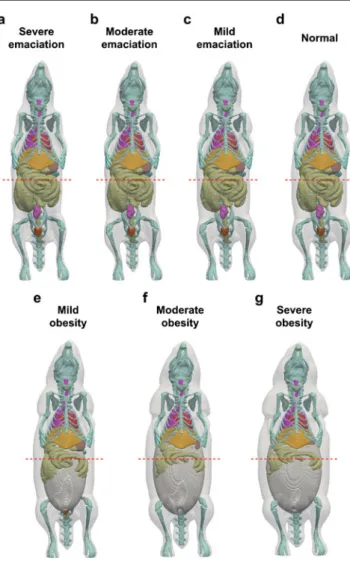
a preset value (23.7 cm) while the body contour of the rat models was adjusted locally and scaled to reflect the different propor-tions of emaciation or obesity. Emaciation of rats is usually observed as extensive fatty tissue wasting, and atrophy of the muscles and some internal organs [24,33,34]. Since different radiotracers result in different biodistributions and as such vari-ous degrees of secondary effects in different internal organs, it is hard to systematically consider the atrophy of all organs in the modelling. Therefore, in the emaciated rat models, we only considered the decrease in subcutaneous fat, loss of adipose tissue in the visceral fat pad, and slight muscle atrophy. The adipose tissue was integrated with muscle and other unlabelled organs into other tissues of normal and emaciated models. In the obese rat models, since the adipose tissue consists mainly of subcutaneous fat and visceral fat (including epi-didymal fat, mesenteric fat, omental fat and perinephric fat) [35,36], the body contour was scaled to mimic the increase in subcutaneous fat and an ellipsoidal visceral adipose tissue area was defined and used to expand the intestines into the ventrodorsal and lateral dimensions from the normal rat mod-el. In the male rat body, a large percentage (>20 %) of adipose tissue is stored in the epididymal fat pad [35] and the intestine folds are pressed in the cephalic direction because of an increase in the volume of epididymal fat pad behind them. Figures 1 and 2 show three-dimensional ventral views and transverse cross sections, respectively, of the normal, emaci-ated and obese rat models.
Monte Carlo simulations
The scaled NURBS-based rat models were voxelized using the ROBY software [20] and used as input to the MCNPX Monte Carlo code [37] to simulate the transport and interaction of photons and electrons in the computational rat models. The number of voxels of each identified region was calculated and multiplied by the voxel volume (0.5×0.5×0.5 mm) and corre-sponding tissue density to yield the region mass. The density and chemical composition of each organ were assumed similar to those in humans [38, 39]. Monoenergetic photons and electrons were generated from most body organs with 20 discrete photon energies ranging from 0.01 to 3.0 MeV and 13 selected electron energies ranging from 0.1 to 3.0 MeV. A total of 6 × 10⁶ primary particle histories were generated resulting in a statistical uncertainty, in terms of coefficient of variation, of less than 2 % in most cases. The absorbed frac-tions, reflecting the proportion of energy released in source organs and deposited in the target organ, were calculated for all organs. These estimates were then compared with similar quantities calculated for the seven developed rat models as well as computational rat models developed by Stabin et al. [11], Peixoto et al. [17] and Xie et al. [7,40]. In addition, the SAFs, reflecting the mean absorbed fraction in a target organ, were also calculated based on the absorbed fractions. Photon and electron SAFs for selected body regions in emaciated, obese and normal rat models were then analysed.
We also simulated uniformly distributed positron-emitting radionuclides in 14 chosen source regions of the generat-ed emaciatgenerat-ed, obese and normal rat models. The select-ed radionuclides includselect-ed11C,13N,15O,18F,64Cu,68Ga,86Y and124I, which are commonly used to label various probes in small-animal PET imaging [41–43]. The Medical Internal
Fig. 1 Three-dimensional ventral views of the mild, moderate and severely emaciated and obese rat models with semitransparent skin in comparison to the normal-weight rat model. The dash lines (red) are the positions of the cross sections shown in Fig.2
Fig. 2 Cross sections of computational rat models demonstrating mild, moderate and severe emaciation and obesity in comparison to the normal-weight rat model
Radionuclide Dose Committee (MIRD) schema [44] was employed to assess S-values of the considered radionuclides obtained by multiplying the energy and average number of particles per nuclear disintegration and the absorbed fraction for a given source–target combination divided by the mass of the target region [44,45]. The decay data of these positron-emitting radionuclides were obtained from the Health Physics Society electronic resource [46]. The percentage differences in S-values of several organ pairs for 18F were estimated for emaciated and obese models with respect to the normal rat model and are expressed as the percentage differences per 10 g difference in the model’s total body mass.
Results
Rat models
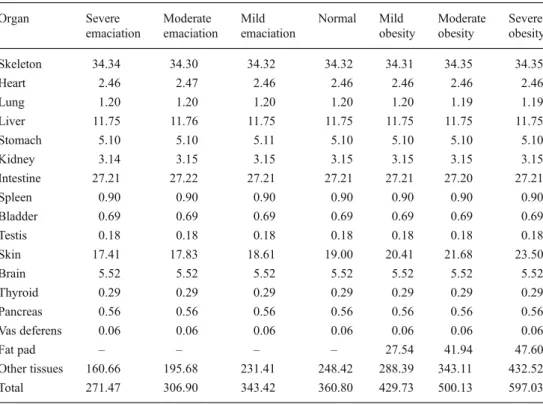
Table1summarizes the masses of organs/tissues of the gen-erated normal, emaciated and obese computational rat models. The %NWLR11of the normal rat model was 100 % while the
%NWLR11for the severely, moderately and mildly emaciated
rat models were 75 %, 85 % and 95 %, respectively. The %NWLR11for the severely, moderately and mildly obese rat
models were 120 %, 140 % and 167 %, respectively. The masses of internal organs in the emaciated and obese rat models were quite similar to those in the normal rat model. In the obese rat models, some organs in the splanchnocoele
were surrounded by layers of fat tissue, whereas other organs, such as the intestine, were slightly deformed and displaced.
Absorbed fractions and specific absorbed fractions
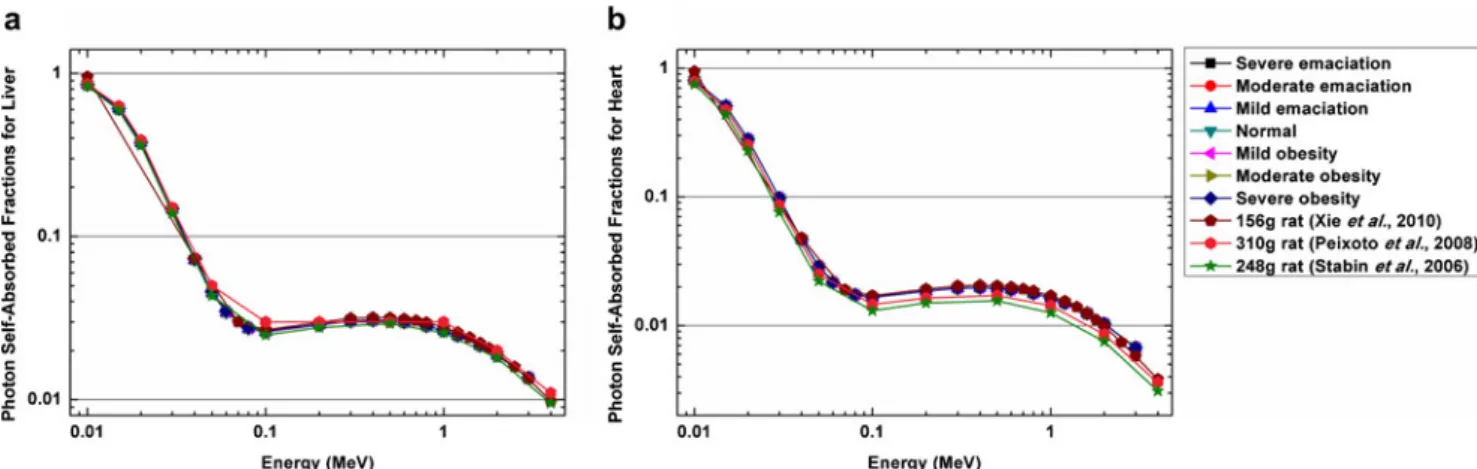
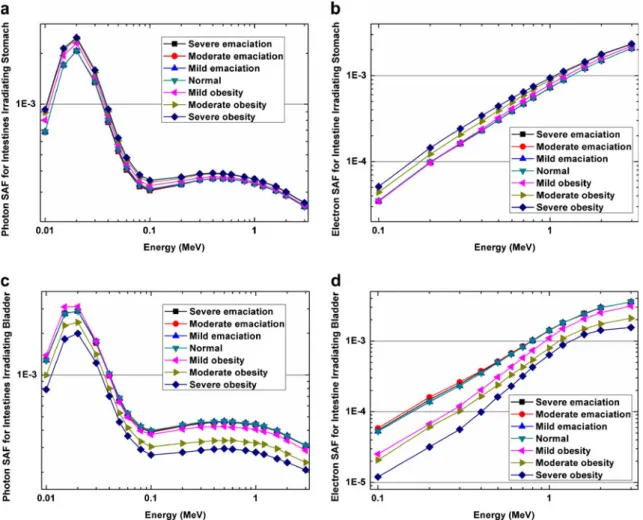
Figure 3 shows photon self-absorbed fractions for the liver and the heart of the seven generated rat models. Comparisons with the results of Stabin et al. [11], Peixoto et al. [17] and Xie et al. [7] are also given. Consistent tendencies of curves are presented and self-absorbed fractions of different rat models are close together. Figures4and5show photon and electron SAFs for the stomach self-irradiation, the stomach and kid-neys, and the intestine irradiating the stomach and the bladder, respectively. The relative SAF differences for most source– target pairs between the emaciated models and the reference model and between the obese models and the reference model were lower than 1 %. However, for obese rats, the SAFs for the intestine irradiating the anterior abdominal organs (e.g. stomach, kidney, spleen) were higher, whereas the SAFs for the intestine irradiating the posterior abdominal organs (e.g. bladder, testis) were lower than those in the normal model. As can be seen in Fig.5a, photon SAFs for the intestines irradi-ating the stomach were about 5 % higher in the mildly obese model, 10 % higher in the moderately obese model and 12 % higher in the severely obese model. On the other hand, the electron SAFs for the intestines irradiating the stomach were about 5 % higher in the mildly obese model, 23 % higher in the moderately obese model and 35 % higher in the severely
Table 1 Organ masses (in grams) in the various computational rat models Organ Severe emaciation Moderate emaciation Mild emaciation Normal Mild obesity Moderate obesity Severe obesity Skeleton 34.34 34.30 34.32 34.32 34.31 34.35 34.35 Heart 2.46 2.47 2.46 2.46 2.46 2.46 2.46 Lung 1.20 1.20 1.20 1.20 1.20 1.19 1.19 Liver 11.75 11.76 11.75 11.75 11.75 11.75 11.75 Stomach 5.10 5.10 5.11 5.10 5.10 5.10 5.10 Kidney 3.14 3.15 3.15 3.15 3.15 3.15 3.15 Intestine 27.21 27.22 27.21 27.21 27.21 27.20 27.21 Spleen 0.90 0.90 0.90 0.90 0.90 0.90 0.90 Bladder 0.69 0.69 0.69 0.69 0.69 0.69 0.69 Testis 0.18 0.18 0.18 0.18 0.18 0.18 0.18 Skin 17.41 17.83 18.61 19.00 20.41 21.68 23.50 Brain 5.52 5.52 5.52 5.52 5.52 5.52 5.52 Thyroid 0.29 0.29 0.29 0.29 0.29 0.29 0.29 Pancreas 0.56 0.56 0.56 0.56 0.56 0.56 0.56 Vas deferens 0.06 0.06 0.06 0.06 0.06 0.06 0.06 Fat pad – – – – 27.54 41.94 47.60 Other tissues 160.66 195.68 231.41 248.42 288.39 343.11 432.52 Total 271.47 306.90 343.42 360.80 429.73 500.13 597.03
obese model in relation to the reference model. For the intes-tine and bladder, the photon SAFs were 4 %, 24 % and 35 % and the electron SAFs were 31 %, 48 % and 63 % lower in the mildly, moderately and severely obese models, respectively, in relation to those in the normal model.
SAFs for cross-irradiation of the total body
In human dose calculations, cross-absorbed SAFs for organs are commonly negligible [45] since the range of low-energy electrons is smaller than the dimensions of most human organs
Fig. 4 Photon SAFs (a, c) and electron SAFs (b, d) for the stomach self-irradiation (a, b) and the stomach irradiating the kidneys (c, d) Fig. 3 Photon self-absorbed fractions for the liver (a) and the heart (b) in the various rat models used in this work. The results of Stabin et al. [11], Peixoto et al. [17] and Xie et al. [7] are also shown
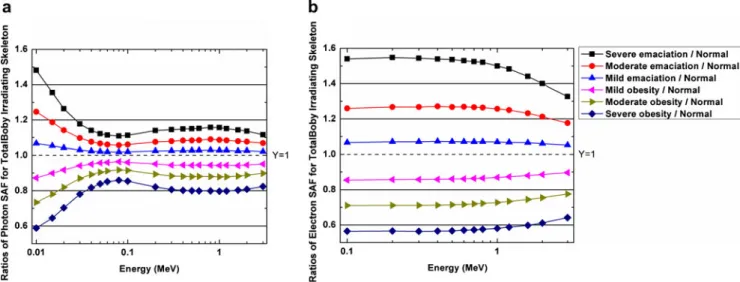
[47]. However, given that the body dimensions of rats are much smaller, it is necessary to evaluate the cross-absorbed SAFs in rat internal radiation dosimetry. Figure 6 shows photon and electron SAFs for the total body, skeleton and heart, with the total body being the source organ. Overall, for the same photon or electron energy, the obese models have higher SAF for the total body irradiating itself and other organs. This indicates that the SAF of the total body is positively correlated with the mass of the rat. Figure7shows photon and electron SAF ratios of the various rat models (from severely emaciated to severely obese) to the normal rat model for the total body irradiating the skeleton. At an emitting photon energy of 10 keV, the maximum percentage differences in photon SAFs for the total body irradiating the skeleton between the mildly, moderately and severely emaci-ated models and the normal model were 7 %, 25 % and 48 %, respectively, while the differences between the mildly, mod-erately and severely obese models and the normal model were−12 %, −27 %, and −41 %, respectively. When photon energy increased, the absolute differences in photon SAFs between the emaciated and obese models and the normal
model initially showed a rapid decrease followed by a slight increase before reaching a plateau in the energy range 0.4– 2.0 MeV. For electron SAFs for the total body irradiating the skeleton, the absolute differences between the emaciated models and the normal model showed a slight decrease with an increase in electron energy.
S-values for positron-emitters
Figure 8 shows S-value ratios for 11C, 124I, 18F and 86Y positron-emitting radionuclides for different source–target or-gan pairs between the six rat models and the normal rat model. Similar to the previous SAF results, the S-values for the total body irradiating other organs decreased with increasing body mass. From the severely emaciated model to the normal model, the self-absorbed S-values were generally constant. From the normal to the severely obese model, S-values for the intestine irradiating the anterior abdominal organs in-creased but dein-creased for the posterior abdominal organs. Figure9shows S-value ratios between the seven rat models and the normal rat model for the total body irradiating the total
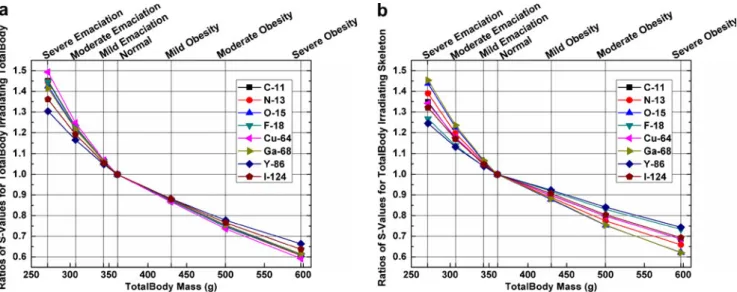
body and skeleton for the eight positron-emitting radionu-clides (11C,13N,15O,18F,64Cu,68Ga,86Y and124I). For all positron-emitting radionuclides, the S-values decreased with increasing body mass. The rate of decrease in S-values was
higher from the severely emaciated model to the normal model than from the normal model to the severely obese model. The percentage differences in S-values per 10 g dif-ference in total body mass (%/10 g) for18F are presented in
Fig. 6 Photon SAFs (a, c, e) and electron SAFs (b, d, f) for the total body irradiating the total body (a, b), the total body irradiating the skeleton (c, d) and the total body irradiating the heart (e, f)
Fig. 7 Photon SAF ratios (a) and electron SAF ratios (b) for the total body irradiating the skeleton
Fig. 8 Ratios of S-values for different source–target organ pairs for11C (a),124I (b),18F (c) and86Y (d). The corresponding values from the normal rat model are taken as the reference values
Table2between the severely emaciated model and the normal model and in Table3between the severely obese model and the normal model.
Discussion
Recent advances in the development of sophisticated deform-able computational anatomical models of laboratory animals have stimulated and further encouraged the use of Monte Carlo
techniques for radiation dosimetry calculations [3]. Current developments are aimed at computational models that are flexible while providing accurate modelling of various animal species. To perform accurate animal-specific radiation dose calculations, an animal-specific anatomical model to be used with animal-specific biokinetic data is necessary. Individual laboratory animals not only have significantly different tracer uptake levels and retention half-lives of activity of the labelled compound, but also have significantly different physical char-acteristics and radiosensitivities. To optimize the design of
Fig. 9 Ratios of S-values for the total body irradiating the total body and the skeleton for11C,13N,15O,18F,64Cu,68Ga,86Y and124I. The
corresponding values from the normal rat model are taken as the reference values
Table 2 Percentage differences in S-values per 10 g difference (%/10 g) in total body mass for18F between the severe emaciated model and the normal model
Organ Skeleton Heart Lung Liver Stomach Kidney Intestine Spleen Bladder Testis Brain Thyroid Pancreas Total body Skeleton −0.01 −0.05 −0.06 −0.09 −0.09 −0.19 −0.13 −0.05 −0.19 0.06 −0.05 −0.03 −0.04 2.99 Heart 0.03 −0.01 0.02 −0.05 0.02 0.02 0.23 0.16 −1.02 −1.58 0.35 0.07 0.45 2.81 Lung −0.03 0.09 0.04 −0.10 −0.21 0.06 −0.13 0.14 1.52 1.70 −0.14 −0.13 0.16 3.32 Liver 0.02 −0.05 0.00 0.00 −0.03 −0.05 −0.05 −0.11 −0.20 0.23 −0.23 −0.25 0.02 1.98 Stomach −0.29 −0.03 −0.07 0.03 −0.01 0.05 −0.11 0.03 −0.31 −0.06 −0.35 −0.26 −0.05 1.55 Kidney −0.18 −0.44 −0.04 −0.06 −0.16 0.00 0.14 −0.16 −0.27 −0.23 −0.89 −0.24 −0.10 2.10 Intestine −0.08 0.08 −0.21 −0.07 −0.03 −0.01 −0.01 −0.07 0.00 −0.39 −0.31 −0.35 0.02 2.03 Spleen 0.01 0.06 −0.11 −0.12 −0.06 0.12 −0.15 0.01 0.18 −0.36 −0.92 0.18 −0.25 1.97 Bladder −0.02 −0.21 −0.80 −0.61 0.47 −0.41 0.09 −1.20 −0.01 −0.06 −0.04 −0.10 −0.37 2.72 Testis 0.86 7.23 −0.95 0.53 −0.86 0.67 0.62 0.27 0.42 0.08 0.19 3.15 −1.06 2.50 Skin 2.23 1.70 2.06 1.60 1.77 2.52 2.18 2.42 3.11 3.34 1.19 1.48 2.02 4.47 Brain −0.04 0.01 −0.11 −0.36 −0.22 −0.45 −0.23 −0.41 −0.33 0.45 0.00 0.07 −0.59 2.40 Thyroid 0.48 −0.20 0.11 −0.29 0.95 −0.89 1.51 −0.05 −2.22 0.86 −0.15 −0.07 −0.74 3.76 Pancreas −0.03 −0.22 −0.08 −0.22 0.17 −0.07 −0.02 −0.04 −0.63 −0.35 −0.88 0.33 0.00 2.83 Total body 3.09 3.18 3.09 3.15 3.09 2.94 3.05 2.96 2.93 2.82 3.36 3.29 3.09 3.13
experiments through accurate monitoring of radiation dose delivered to animals, individual animal-related parameters should be accounted for as much as possible.
The results obtained showed small variations in SAFs for most source–target pairs between the emaciated, obese and normal rat models. The SAFs from the intestine for the ante-rior abdominal organs (e.g. stomach, kidney, spleen) and posterior abdominal organs (e.g. bladder, testis) in the obese model were, respectively, higher and lower than those in the normal model because the increased volume of the epididymal fat pad and visceral adipose tissues increased the separation between the intestinal folds and the posterior abdominal or-gans and reduced the distance from the folds to the anterior abdominal organs. Because of the larger source–target sepa-rations, the SAFs for the total body irradiating other regions decreased with increasing body mass, and more significant changes were more apparent at low photon energies.
Changes in S-values with emaciation and obesity were also evaluated for eight positron-emitting radionuclides relevant for research involving PET molecular imaging. Except for the intestine and the total body, there was little difference between S-values for most source–target pairs in the emaciated, obese and normal rat models. In the obese rat models, the variations in S-values of the intestine irradiating other organs were similar to those for the photon and electron SAFs. S-values for the total body were inversely correlated with body weight. The differ-ences in S-values between the normal and the severely emaci-ated models for the total body irradiating the skeleton varied from 30 % to 50 % for the eight positron-emitting radionu-clides. These results suggest that, in small-animal dosimetry, body weight loss caused by the secondary effects of drugs and other issues related to particular experiments will increase the
absorbed radiation dose to internal organs. In addition, the radiation-induced organ damage may aggravate the emaciation, which would finally result in a vicious circle. The assessment of internal radiation dose delivered to small animals in exper-imental research is important for evaluations of radiotoxicity and therapeutic effect of molecular imaging probes and thera-peutic agents. In this regard, quantification of variations in organ S-values with changes in total body mass caused by emaciation or obesity is an important issue. Considering18F as an example, the absolute difference in S-values for organ self-irradiation was lower than 0.05 % per 10 g of difference in body weight. For organs irradiating other organs, most differ-ences in cross-absorbed S-values were lower than 1 % per 10 g and would not be perceptible within the uncertainties associat-ed with dose calculations. However, S-value changes for the total body were more noticeable, ranging between 1.5 % and 4.5 % per 10 g in emaciated models, and between−1.6 % and −0.7 % per 10 g in obese models. Overall, changes in SAFs and S-values induced by emaciation or obesity for most or-gans may be neglected in small-animal internal dose esti-mates. However, since the cross-absorbed radiation dose plays a more important role in small animals than in humans [5,7], emaciation-induced increase in S-values for the total body irradiating other organs is an important issue to consider in small-animal radiation dosimetry calculations.
Conclusion
This work focused on the evaluation of the impact of ema-ciation and obesity on small-animal internal radiation dosim-etry. We constructed a realistic normal adult male rat model
Table 3 Percentage differences in S-values per 10 g difference (%/10 g) in total body mass for18F between the severe obesity model and the normal model Organ Skeleton Heart Lung Liver Stomach Kidney Intestine Spleen Bladder Testis Brain Thyroid Pancreas Total body
Skeleton 0.00 0.04 −0.01 0.06 0.08 0.10 −0.06 0.13 0.05 0.05 0.02 0.06 0.08 −1.13 Heart 0.07 0.00 0.04 0.04 0.06 0.15 0.37 0.13 0.51 1.22 0.20 0.08 0.12 −0.87 Lung −0.03 0.05 0.03 0.02 −0.01 −0.05 0.41 −0.03 0.64 0.72 0.14 0.05 0.11 −1.07 Liver 0.06 0.03 0.02 0.00 0.02 0.01 0.57 0.04 0.17 0.32 0.20 0.13 0.04 −0.76 Stomach 0.10 0.00 0.04 0.02 0.00 0.01 0.46 0.01 0.21 0.18 0.21 0.23 0.00 −0.95 Kidney 0.12 0.12 0.12 0.01 0.07 0.00 0.30 0.06 0.04 0.18 0.32 0.29 0.04 −1.72 Intestine −0.08 0.46 0.41 0.53 0.52 0.26 −0.01 1.72 −1.62 −0.99 0.68 0.82 0.25 −1.84 Spleen 0.18 0.11 0.07 −0.01 0.00 0.06 1.88 0.00 0.17 0.14 0.46 0.23 0.02 −1.51 Bladder −0.02 0.28 0.40 0.20 0.25 0.07 −1.68 0.00 0.00 0.15 0.73 0.73 0.09 −2.66 Testis −0.09 1.84 −0.44 0.27 −0.38 0.50 −0.73 0.70 0.18 −0.01 1.08 1.65 0.03 −2.84 Skin −1.69 −1.54 −1.41 −1.52 −1.54 −1.30 −1.43 −1.44 −1.16 −1.71 −1.24 −1.52 −1.24 −1.43 Brain 0.01 0.14 0.14 0.37 0.20 0.35 0.24 0.37 0.33 0.54 0.00 0.08 0.03 −0.09 Thyroid 0.13 0.22 0.04 0.34 0.34 0.41 3.40 0.95 0.63 1.32 0.04 0.00 0.67 −0.71 Pancreas 0.03 0.05 −0.10 0.03 0.00 0.02 0.17 0.03 0.38 0.42 0.34 0.22 0.00 −1.85 Total body −1.47 −1.46 −1.45 −1.45 −1.45 −1.46 −1.46 −1.43 −1.51 −1.49 −1.48 −1.44 −1.48 −1.54
along with mildly, moderately and severely emaciated and obese anatomical rat models based on the deformable ROBY model and anatomical parameters reported in the literature. The major organs have almost the same masses and are located in the same positions. There were small differences in photon and electron SAFs and radionuclide-specific S-values for most organs between the emaciated and obese models and the normal model. The variations in SAFs for the intestine irradiating some organs were found to be higher in the obese models as a result of the changes in the position of target regions. The anterior abdominal organs would receive a higher cross-absorbed dose from the intestine whereas the posterior abdominal organs would receive a lower cross-absorbed dose because the increased volume of the epididy-mal fat pad and visceral adipose tissues increases the separa-tion of the intestine and posterior abdominal organs and shifts the intestinal folds in the cephalic direction. The SAFs and radionuclide S-values for the total body irradiating other re-gions increased with decreasing body mass. Overall, the effect of obesity on dose calculations for internal irradiation is insignificant in most conditions while emaciation could in-crease the cross-absorbed dose of organs from surrounding tissues, which might be an issue in small-animal internal radiation dosimetry.
Acknowledgments This work was supported by the Swiss National Science Foundation under grant SNSF 31003A-125246, the Geneva Cancer League and the Indo-Swiss Joint Research Programme ISJRP 138866. The authors thank Dr. W. Paul Segars for providing the ROBY computational rat model.
Conflicts of interest None.
References
1. Jönsson BA, Strand SE, Larsson BS. A quantitative autoradio-graphic study of the heterogeneous activity distribution of different indium-111-labeled radiopharmaceuticals in rat tissues. J Nucl Med. 1992;33(10):1825–33.
2. Pasqualini R, Duatti A, Bellande E, Comazzi V, Brucato V, Hoffschir D, et al. Bis(dithiocarbamato)nitrido technetium-99m radiopharmaceuticals: a class of neutral myocardial imaging agents. J Nucl Med. 1994;35(2):334–41.
3. Zaidi H, Xu XG. Computational anthropomorphic models of the human anatomy: the path to realistic Monte Carlo modeling in medical imaging. Annu Rev Biomed Eng. 2007;9(1):471–500. 4. Lee C, Lodwick D, Hasenauer D, Williams JL, Bolch WE.
Hybrid computational phantoms of the male and female new-born patient: NURBS-based whole-body models. Phys Med Biol. 2007;52(12):3309–33.
5. Hui TE, Fisher DR, Kuhn JA, Williams LE, Nourigat C, Badger CC, et al. A mouse model for calculating cross-organ beta doses from yttrium-90-labeled immunoconjugates. Cancer. 1994;73(3 Suppl):951–7.
6. Konijnenberg MW, Bijster M, Krenning EP, De Jong M. A stylized computational model of the rat for organ dosimetry in support of
preclinical evaluations of peptide receptor radionuclide therapy with 90Y, 111In, or 177Lu. J Nucl Med. 2004;45(7):1260–9. 7. Xie T, Zhang G, Li Y, Liu Q. Comparison of absorbed fractions of
electrons and photons using three kinds of computational phantoms of rat. Appl Phys Lett. 2010;97(3):33702–4.
8. Flynn AA, Green AJ, Pedley RB, Boxer GM, Boden R, Begent RH. A mouse model for calculating the absorbed beta-particle dose from 131I- and 90Y-labeled immunoconjugates, including a method for dealing with heterogeneity in kidney and tumor. Radiat Res. 2001;156(1):28–35.
9. Miller WH, Hartmann-Siantar C, Fisher D, Descalle MA, Daly T, Lehmann J, et al. Evaluation of beta-absorbed fractions in a mouse model for 90Y, 188Re, 166Ho, 149Pm, 64Cu, and 177Lu radionu-clides. Cancer Biother Radiopharm. 2005;20(4):436–49. 10. Hindorf C, Ljungberg M, Strand SE. Evaluation of parameters
influenc-ing S values in mouse dosimetry. J Nucl Med. 2004;45(11):1960–5. 11. Stabin MG, Peterson TE, Holburn GE, Emmons MA. Voxel-based
mouse and rat models for internal dose calculations. J Nucl Med. 2006;47(4):655–9.
12. Kolbert KS, Watson T, Matei C, Xu S, Koutcher JA, Sgouros G. Murine S factors for liver, spleen, and kidney. J Nucl Med. 2003;44(5):784–91.
13. Bitar A, Lisbona A, Thedrez P, Sai Maurel C, Le Forestier D, Barbet J, et al. A voxel-based mouse for internal dose calculations using Monte Carlo simulations (MCNP). Phys Med Biol. 2007;52(4):1013–25.
14. Dogdas B, Stout D, Chatziioannou AF, Leahy RM. Digimouse: a 3D whole body mouse atlas from CT and cryosection data. Phys Med Biol. 2007;52(3):577–87.
15. Mohammadi A, Kinase S. Monte Carlo simulations of photon specific absorbed fractions in a mouse voxel pPhantom. Prog Nucl Sci Technol. 2011;1:126–9.
16. Zhang X, Xie X, Cheng J, Ning J, Yuan Y, Pan J, et al. Organ dose conversion coefficients based on a voxel mouse model and MCNP code for external photon irradiation. Radiat Prot Dosim. 2012;148(1):9–19. 17. Peixoto PH, Vieira JW, Yoriyaz H, Lima FR. Photon and electron
absorbed fractions calculated from a new tomographic rat model. Phys Med Biol. 2008;53(19):5343–55.
18. Wu L, Zhang G, Luo Q, Liu Q. An image-based rat model for Monte Carlo organ dose calculations. Med Phys. 2008;35(8):3759–64. 19. Xie T, Liu Q, Zaidi H. Evaluation of S-values and dose distributions
for 90Y, 131I, 166Ho, and 188Re in seven lobes of the rat liver. Med Phys. 2012;39(3):1462–72.
20. Segars WP, Tsui BM, Frey EC, Johnson GA, Berr SS. Development of a 4-D digital mouse phantom for molecular imaging research. Mol Imaging Biol. 2004;6(3):149–59.
21. Keenan MA, Stabin MG, Segars WP, Fernald MJ. RADAR realistic animal model series for dose assessment. J Nucl Med. 2010;51(3):471–6.
22. Xie T, Zaidi H. Monte Carlo-based evaluation of S-values in mouse models for positron-emitting radionuclides. Phys Med Biol. 2013;58(1):169–82.
23. Coop KL, Sharp JG, Osborne JW, Zimmerman GR. An animal model for the study of small-bowel tumors. Cancer Res. 1974;34(6):1487–94. 24. Nagler R. Extended-term effects of head and neck irradiation in a
rodent. Eur J Cancer. 2001;37(15):1938–45.
25. Thomas R, Thomas RL, Wright S. Retention of cesium-137 and strontium-90 administered in lethal doses to rats. Am Ind Hyg Assoc J. 1968;29(6):593–600.
26. Stone HB, Moulder JE, Coleman CN, Ang KK, Anscher MS, Barcellos-Hoff MH, et al. Models for evaluating agents intended for the prophylaxis, mitigation and treatment of radiation injuries. Report of an NCI workshop, December 3-4, 2003. Radiat Res. 2004;162(6):711–28.
27. Larsson E, Ljungberg M, Mårtensson L, Nilsson R, Tennvall J, Strand SE, et al. Use of Monte Carlo simulations with a realistic rat
phantom for examining the correlation between hematopoietic sys-tem response and red marrow absorbed dose in Brown Norway rats undergoing radionuclide therapy with 177Lu- and 90Y-BR96 mAbs. Med Phys. 2012;39(7):4434–43.
28. Kennedy G. The role of depot fat in the hypothalamic control of food intake in the rat. Proc R Soc Lond B Biol Sci. 1953;140(901):578–92.
29. Pass D, Freeth G. The rat. ANZCCART News. 1993;6(4):1–4. 30. Donaldson HH. The rat: data and reference tables for the albino rat
and the Norway rat. New Delhi: Nabu Press; 1915.
31. Bardia A, Holtan SG, Slezak JM, Thompson WG. Diagnosis of obesity by primary care physicians and impact on obesity manage-ment. Mayo Clin Proc. 2007;82:927–32.
32. Kostanski M, Gullone E. Adolescent body image dissatis-faction: relationships with self-esteem, anxiety, and depres-sion controlling for body mass. J Child Psychol Psychiatry. 1998;39(2):255–62.
33. Hashimoto PH, Goami Y, Yoneda K, Mori K, Shioyama M, Hasegawa E, et al. Fine structure of rat liver, adrenal, testis and seminal vesicle in experimental emaciation. J Electron Microsc. 1998;47(3):251–62.
34. Ochi M, Yoshioka H, Sawada T, Kusunoki T, Hattori T. New adipocyte formation in mice during refeeding after long-term dep-rivation. Am J Physiol. 1991;260(3):R468–74.
35. Reed LL, Anderson WE, Mendel LB. Factors Influencing the distribution and character of adipose tissue in the rat. J Biol Chem. 1932;96(2):313–23.
36. Jeanrenaud B, Renold AE. Studies on rat adipose tissue in vitro. J Biol Chem. 1960;235(8):2217–23.
37. Pelowitz DB. MCNPX user’s manual version 2.5.0. Los Alamos, NM: Los Alamos National Laboratory; 2005. LA-CP-05-0369.
38. Goldstone KE. Tissue substitutes in radiation dosimetry and mea-surement. ICRU Report 44. Vol 41. International Commission on Radiation Units and Measurements; 1990.
39. Valentin J. Basic anatomical and physiological data for use in radiological protection: reference values – ICRP publication 89. Ann ICRP. 2002;32(3-4):5–265.
40. Xie T, Han D, Liu Y, Sun J, Liu Q. Skeletal dosimetry in a voxel-based rat phantom for internal exposures to photons and electrons. Med Phys. 2010;37(5):2167–78.
41. Myers R. The biological application of small animal PET imaging. Nucl Med Biol. 2001;28(5):585–93.
42. Shimoji K, Ravasi L, Schmidt K, Soto-Montenegro ML, Esaki T, Seidel J, et al. Measurement of cerebral glucose metabolic rates in the anesthetized rat by dynamic scanning with 18F-FDG, the ATLAS small animal PET scanner, and arterial blood sampling. J Nucl Med. 2004;45(4):665–72.
43. Herrero P, Kim J, Sharp TL, Engelbach JA, Lewis JS, Gropler RJ, et al. Assessment of myocardial blood flow using 15O-water and 1-11C-acetate in rats with small-animal PET. J Nucl Med. 2006;47(3):477–85. 44. Bolch WE, Eckerman KF, Sgouros G, Thomas SR. MIRD pamphlet no. 21: a generalized schema for radiopharmaceutical dosimetry– standardization of nomenclature. J Nucl Med. 2009;50(3):477–84. 45. Snyder WS, Ford MR, Warner GG, Watson SB. MIRD pamphlet no. 11:
‘S’, absorbed dose per unit cumulated activity for selected radionuclides and organs. New York: The Society of Nuclear Medicine; 1975. 46. Health Physics Society. Radionuclide decay data. McLean, VA:
Health Physics Society. http://hps.org/publicinformation/
radardecaydata.cfm. Accessed 21 Jun 2013.
47. Bardies M, Chatal JF. Absorbed doses for internal radiotherapy from 22 beta-emitting radionuclides: beta dosimetry of small spheres. Phys Med Biol. 1994;39(6):961–81.