Assessment of the Expert Locomotive Engineer’s
Mental Model through Expert-Novice Interactions
by
Rachel Price
Submitted to the Department of Aeronautics and Astronautics
in partial fulfillment of the requirements for the degree of
Master of Science in Aeronautics and Astronautics
at the
MASSACHUSETTS INSTITUTE OF TECHNOLOGY
May 2020
c
○ Massachusetts Institute of Technology 2020. All rights reserved.
Author . . . .
Department of Aeronautics and Astronautics
May 19, 2020
Certified by . . . .
Charles M. Oman
Senior Lecturer and Senior Research Engineer
Thesis Supervisor
Accepted by . . . .
Sertac Karaman
Associate Professor of Aeronautics and Astronautics
Chair, Graduate Program Committee
Assessment of the Expert Locomotive Engineer’s Mental
Model through Expert-Novice Interactions
by
Rachel Price
Submitted to the Department of Aeronautics and Astronautics on May 19, 2020, in partial fulfillment of the
requirements for the degree of
Master of Science in Aeronautics and Astronautics
Abstract
Today, many long-haul freight locomotives around the world are equipped with au-tothrottle systems that follow pre-computed and fuel-efficient speed plans. However, these systems cannot adapt to changes in operational constraints or engineers’ train handling preferences, which results in engineers taking back manual control. To address issues created by this traded approach scheme, a new operational mode is envisioned that allows operators to shape automation behavior. Although high level goals have been enumerated by previous task analyses, there has been little research on how engineers actually drive routes, identify situations, and make train handling decisions. To fill this gap , five subject pairs drove a U.S. DOT/FRA freight locomo-tive research simulator along a 65 mile route, responding to signals, speed restrictions and dispatcher orders. Each subject pair consisted of one expert and one novice subject. One subject was seated at the controls and the other subject was seated in the conductor’s position. The subject at the controls had limited access to informa-tion and relied on verbal communicainforma-tion with the other subject to safely manipulate the train controls. Subjects drove the route twice, once at each position. The re-search team developed a coding scheme based on cognitive linguistics rere-search and prior work on freight driving strategies to categorize each interaction from the study. Analysis of this data suggested that experienced engineers know what decisions and actions should be taken when various situations are encountered along a route, but their train handling (e.g. braking) tactics vary. Next-generation autothrottle sys-tems should leverage the engineer’s ability to assess operational context and initiate actions. Additionally, these systems should allow the operator to make speed plan modifications at both the tactical and strategic level to accommodate the observed variation between engineers’ control strategies.
Thesis Supervisor: Charles M. Oman
Acknowledgments
This thesis came out of a larger work that is funded by the Federal Railroad Ad-ministration and is currently being completed by General Electric and Massachusetts Institute of Technology. The experiment described herein took place at the Cab Technology Integration Lab (CTIL) at the Volpe National Transportation Systems Center.
I would like to thank the members of the GE/MIT project team for their efforts in seeing this experiment through. First, to Dr. Chuck Oman, my advisor, for all of his help in the design and execution of the experiment as well as the analysis and presentation of the results in this thesis. Thanks also to Dr. Andy Liu for his guidance and support throughout this project, be it editing the thesis or coordinat-ing with the Volpe Center to make sure the experiments would run smoothly. I am also very grateful for the contributions of Zach Johnson and Laura Rosado, the un-dergraduate researchers who performed much of the data labelling and assisted with data processing. On the GE side, thanks to Dr. James Brooks, Brad Miller, Neeraja Subrahmaniyan, Kirk Matthews, and Sarah Felix for their assistance and expertise in various subject areas, including the rail industry, cognitive linguistics, and control theory. From the Volpe Center, I would like to acknowledge Matt Isaacs, who was crucial to the successful completion of the experiments.
Finally, I would like to thank George Newman and Alex Goodwin, who helped refine the pilot version of the study, as well as the ten subjects who volunteered for and completed the final study.
Contents
1 Introduction 19
1.1 Manual Train Control . . . 21
2 Motivation 25 2.1 Changes to the Railway Workforce . . . 25
2.1.1 GE Trip Optimizer and Expert De-Skilling Concerns . . . 25
2.1.2 An Aging Workforce . . . 27
2.2 A New Mode Design . . . 27
3 Problem Statement 29 3.1 Methods for Analyzing Mental Models . . . 29
3.1.1 Hierarchical and Cognitive Task Analysis . . . 30
3.1.2 Concept Mapping . . . 31
3.2 Prior Work . . . 31
3.2.1 Branton’s Task Analysis, 1978 . . . 31
3.2.2 Naweed et al’s Hierarchical Task Analysis, 2018 . . . 32
3.2.3 Groshong’s Concept Maps, 2018 . . . 33
3.3 Key Aspects of the Mental Model for Mode Design . . . 34
4 Methods 37 4.1 Overview . . . 37
4.2 Subjects . . . 38
4.4 Test Conditions . . . 40
4.4.1 Overall Study Design . . . 40
4.4.2 Novice-at-the-Controls Scenario . . . 42
4.4.3 Engineer-at-the-Controls Scenario . . . 42
4.4.4 Condition Summary Table . . . 43
4.5 Protocol . . . 43
4.5.1 Informed Consent . . . 43
4.5.2 Training . . . 43
4.5.3 Experiment Session . . . 45
4.6 Data Collection and Processing . . . 46
4.6.1 Data Collection . . . 46
4.6.2 Interaction Coding . . . 47
5 Results 51 5.1 Aggregate Data Analysis . . . 51
5.1.1 Novice-at-the-Controls Scenario . . . 51
5.1.2 Engineer-at-the-Controls Scenario . . . 57
5.2 Train Handling Differences Between Expert Engineers . . . 63
5.2.1 Key Decision Point 4, NAC Scenario . . . 63
5.2.2 Key Decision Point 5, NAC Scenario . . . 69
6 Implications for Mental Models 73 6.1 Decision-Making Inferences and Driving Strategy . . . 74
6.1.1 Required Mental Model Inputs . . . 74
6.1.2 Variation Between Engineers . . . 75
6.2 Implications for Mode Design . . . 77
6.2.1 Automation Teaming . . . 77
6.2.2 Engineer Inputs . . . 78
6.3 Experimental Limitations . . . 79
7 Conclusion 85 8 References 91 A Route Descriptions 95 B Communication Guidelines 99 C Trip Rules 103 D Reference Sheet 105 E Debrief 109 F Coding Handbook 115
List of Figures
3-1 A concept map illustrating the duties of a locomotive engineer. Taken from Groshong 2016. . . 33 4-1 The right side of the Cab Technology Integration Laboratory, where
the engineer typically sits. The control stand can be seen to the left of the seat. . . 39 4-2 The left side of the Cab Technology Integration Laboratory, where the
conductor typically sits. . . 40
5-1 Frequency of all novice-at-the-controls scenario interactions. The top plot shows the Level 1 codes, the bottom plot shows the Level 2 codes. Note that two interaction types, "EXC" or execute and "CKP" or check precondition, dominate the Level 2 interactions. . . 52 5-2 All Level 2 novice-at-the-controls scenario interactions binned
accord-ing to their code and the milepost at which they occurred. The spikes around milepost 95 and again around milepost 120 are stop signals along the track. . . 54 5-3 Frequency of the "check precondition" interaction in the
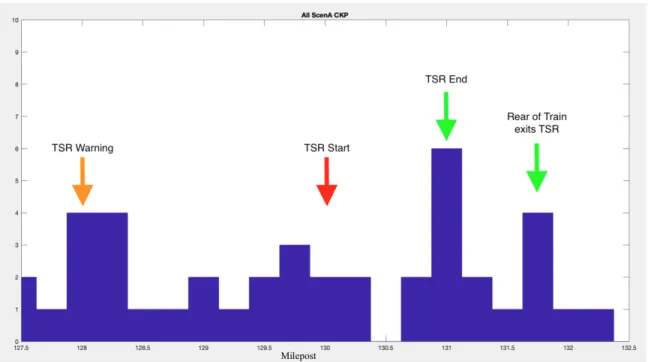
novice-at-the-controls scenario, over a five-mile section of the route around Key Decision Point 5, which was a temporary speed restriction. . . 56 5-4 Frequency of the "execute" interaction in the novice-at-the-controls
scenario, over a five-mile section of the route around Key Decision Point 5, which was a temporary speed restriction. . . 56
5-5 Frequency of all engineer-at-the-controls scenario interactions. The top plot shows the Level 1 codes, the bottom plot shows the Level 2 codes. 57 5-6 All Level 2 engineer-at-the-controls scenario interactions plotted against
the milepost at which they occurred. The spikes around milepost 105 and again around milepost 122 are stop signals along the track. . . . 59 5-7 All Level 1 engineer-at-the-controls scenario interactions plotted against
the milepost at which they occurred. The spikes around milepost 105 and again around milepost 122 are stop signals along the track. . . . 60 5-8 Frequency of all subcodes over all engineer-at-the-controls scenarios
for the query-if interaction code. The -if in query-if denotes that the question could be answered with a yes or no, which distinguishes it from the other query code, query-wh. . . 62 5-9 Frequency of all subcodes over all engineer-at-the-controls scenarios
for the query-wh interaction code. The -wh in query-wh stands for who/what/when/where/why, and this code was used for any question that could not be answered with a yes or no. . . 62 5-10 Subject pair BH train handling data for Key Decision Point 4 (stop
sig-nal). Top plot is actual speed vs speed limit with interactions marked by various symbols, middle plot is notch/dynamic brake, and bottom brake is brake pipe pressure. A decrease in brake pipe pressure denotes that brakes have been applied, larger decreases indicate higher braking force. . . 65 5-11 Subject pair CP train handling data for Key Decision Point 4 (stop
sig-nal). Top plot is actual speed vs speed limit with interactions marked by various symbols, middle plot is notch/dynamic brake, and bottom brake is brake pipe pressure. A decrease in brake pipe pressure denotes that brakes have been applied, larger decreases indicate higher braking force. . . 65
5-12 Subject pair HD train handling data for Key Decision Point 4 (stop sig-nal). Top plot is actual speed vs speed limit with interactions marked by various symbols, middle plot is notch/dynamic brake, and bottom brake is brake pipe pressure. A decrease in brake pipe pressure denotes that brakes have been applied, larger decreases indicate higher braking force. . . 66 5-13 Subject pair NW train handling data for Key Decision Point 4 (stop
sig-nal). Top plot is actual speed vs speed limit with interactions marked by various symbols, middle plot is notch/dynamic brake, and bottom brake is brake pipe pressure. A decrease in brake pipe pressure denotes that brakes have been applied, larger decreases indicate higher braking force. . . 66 5-14 Subject pair WW train handling data for Key Decision Point 4 (stop
signal). Top plot is actual speed vs speed limit with interactions marked by various symbols, middle plot is notch/dynamic brake, and bottom brake is brake pipe pressure. A decrease in brake pipe pressure denotes that brakes have been applied, larger decreases indicate higher braking force. . . 67 5-15 Subject pair BH train handling data for Key Decision Point 5
(tem-porary speed restriction). Top plot is actual speed vs speed limit with interactions marked by various symbols, middle plot is notch/dynamic brake, and bottom brake is brake pipe pressure. A decrease in brake pipe pressure denotes that brakes have been applied, larger decreases indicate higher braking force. . . 70 5-16 Subject pair CP train handling data for Key Decision Point 5
(tempo-rary speed restriction). Top plot is actual speed vs speed limit with interactions marked by various symbols, middle plot is notch/dynamic brake, and bottom brake is brake pipe pressure. A decrease in brake pipe pressure denotes that brakes have been applied, larger decreases indicate higher braking force. . . 71
5-17 Subject pair HD train handling data for Key Decision Point 5 (tem-porary speed restriction). Top plot is actual speed vs speed limit with interactions marked by various symbols, middle plot is notch/dynamic brake, and bottom brake is brake pipe pressure. A decrease in brake pipe pressure denotes that brakes have been applied, larger decreases indicate higher braking force. . . 71 5-18 Subject pair NW train handling data for Key Decision Point 5
(tem-porary speed restriction). Top plot is actual speed vs speed limit with interactions marked by various symbols, middle plot is notch/dynamic brake, and bottom brake is brake pipe pressure. A decrease in brake pipe pressure denotes that brakes have been applied, larger decreases indicate higher braking force. . . 72 5-19 Subject pair WW train handling data for Key Decision Point 5
(tem-porary speed restriction). Top plot is actual speed vs speed limit with interactions marked by various symbols, middle plot is notch/dynamic brake, and bottom brake is brake pipe pressure. A decrease in brake pipe pressure denotes that brakes have been applied, larger decreases indicate higher braking force. . . 72
List of Tables
4.1 Comparison of the engineer-at-the-controls and the novice-at-the-controls scenarios. In the last column, "MP Interactions" refers to meet-and-pass interactions. . . 44 4.2 An explanation of each Level 1 code and Level 2 code used during
the coding process, along with the unique three-letter abbreviation for each code. . . 49 4.3 A table of all subcodes used. The subcodes were sorted into different
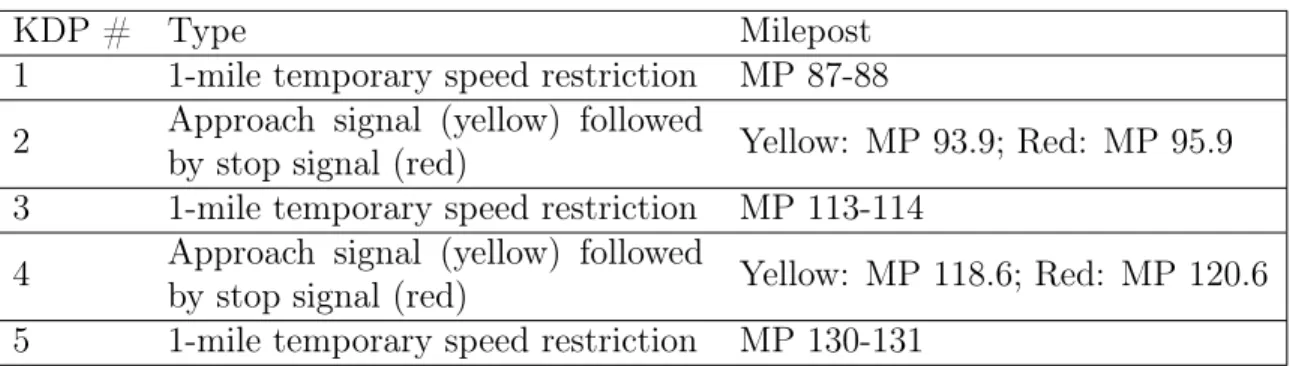
categories for easy reference, but only the subcodes were applied during the coding process (there is no distinction between subcodes of different categories in the encoded transcript). . . 50 5.1 A description of each key decision point for the NAC scenario and
where it occurred along the route. . . 55 5.2 A description of each key decision point for the EAC scenario and
Acronyms
∙ COUHES: Committee on the Use of Humans as Experimental Subjects ∙ CTA: Cognitive Task Analysis
∙ CTIL: Cab Technology Integration Laboratory ∙ EAC: Engineer-at-the-Controls
∙ FRA: Federal Railroad Administration ∙ HTA: Hierarchical Task Analysis ∙ KDP: Key Decision Point
∙ NAC: Novice-at-the-Controls
∙ TO: General Electric Trip Optimizer ∙ TSR: Temporary Speed Restriction
Chapter 1
Introduction
This thesis describes the methods and execution of a study designed to identify the tactics and strategy used by freight rail engineers when driving manually. The goal was to understand the cues, actions, and context that help form the mental model of an expert engineer. This study was motivated by the need for advanced automation design in locomotive cabs that are intuitive to understand and control. In many ways, the rail industry has been slow to adopt modern automation technologies, especially compared to other forms of transit, such as automobiles or airplanes. While some improvements to in-cab technology have been made in recent years, there are still significant gaps that must be overcome. The study described in this work is part of a larger effort to address these gaps. As part of the design process for in-cab automation system enhancements, it was recognized that the expert engineer’s mental model of how to drive the train was not sufficiently well understood. This motivated the present study.
It was not until the mid-to-late 2000s that a commercially successful automatic power management system was introduced for freight locomotives. Touted primar-ily as a way for railroads to further increase fuel efficiency, multiple automated speed control systems are in use across the U.S today, including the Wabtec Leader platform and the GE Trip Optimizer (TO) platform (Eldredge and Houpt 2011). These auto-mated control systems form one of the most substantial changes to freight locomotive cab operations since the transition from steam to diesel locomotives. Recent accidents
have also pushed Congress to mandate Positive Train Control (PTC) on major rail routes, requiring installation of equipment on locomotives and along routes, as well as training rail crew in PTC-enabled operations (American Association of Railroads 2020). Unlike Trip Optimizer, PTC is not designed as a nominal operating mode, but is a safety backup that automatically stops the train in certain hazardous conditions. In addition to improving safety across the national rail system, PTC infrastructure will also enable new cab technologies. For example, the ability to communicate an upcoming signal status to the engineer or in-cab automation means that both the human and the automation can adapt to situations as they evolve, allowing for more flexible control modes. However, with the widespread use of both automated throttle systems and PTC-like safety nets, it is possible that crews will become less skilled as a result of decreased manual operating experience and more complacent due to over-reliance on the safety systems (Roth et al. 2013). These potential changes have spurred interest in further development of new operating modes and automated driver aids that increase both safety and efficiency without diminishing the engineer’s skill and role.
This thesis describes early stages of research for the development of a shared control model for freight rail, sometimes referred to as an “enhanced” or “robust” manual mode (Brooks et al. 2016). The hope for this mode is that the engineer is able to continuously adjust the goals of the automated system to achieve safe and efficient management of the train’s movement. This contrasts with the current interaction model, where the human operator and automation trade total control back and forth between fully manual modes and fully automated modes, so the operator has no influence on train behavior when not in manual control. For a shared control mode to be effective, the engineer would need a functional mental model of the automation - that is, the ability to understand and predict the behavior of the automation (for example, speed of the train) given his or her inputs to the automation. This could be more readily achieved if the enhanced automation was designed to behave in a manner that reflected the intentions and goals of the human engineer. In other words, building expert driving strategy and experts’ mental models into the automation facilitates a
shared understanding of the world between operator and automation.
To better understand expert driving strategy, an experiment was conducted in the Cab Technology Integration Laboratory rail cab simulator at the Department of Transportation’s Volpe Center in Cambridge, MA. This thesis explains the rationale and methods behind the experiment, the experimental results, and the implications of those results for the robust manual mode design, as well as identifying issues requiring further study.
1.1
Manual Train Control
Modern freight rail locomotives primarily have three means of control: the throttle, the dynamic brake, and the air brake (sometimes referred to as the train brake). The throttle has eight discrete power settings, often called notches, where notch one is the lowest power setting and notch eight is the highest. The engineer can directly influence tractive power through notch, however, the resulting overall train speed is a nonlinear function of many factors, including notch, track incline (grade), track condition, and consist (i.e., the composition and cargo of the entire train) -there is no single notch setting that guarantees a certain speed or speed range. For conventional manual control, this means that the engineer must closely monitor and constantly adjust throttle settings to achieve a desired speed profile. The dynamic brake converts the kinetic energy of the locomotive into an electric current that is then dissipated as heat in resistors atop the locomotive body, thereby slowing the locomotive down (McGonigal 2006). In some cab consoles, the dynamic brake uses the same control interface as the notch. In such cases, there is a single lever that controls both throttle and dynamic brake, with the lever’s range divided between a throttle region and a dynamic brake region. The lever is centered in the idle position. Other console designs have separate handles for the dynamic brake and the notch, but with an interlock that prevents both from being used simultaneously. Unlike the dynamic brake, the air brake acts upon the all of the cars in the train.
of the train and holds pressurized air that is partially released when the engineer manipulates the air brake control lever in the locomotive. When the pressure in this pipe is lowered, each freight car’s brakes are applied by a valve in each wheelset. However, it takes some time for the pressure to equalize along the entire train, so the freight cars at the front of the train will deploy brakes before the rear of the train. The engineer can release further brake pipe air pressure if braking is not sufficient; however, due to the design of the wheelset brake valves, the only way to decrease braking is to repressurize the brake line entirely, which requires entirely releasing all the air brakes. This creates some challenging tactical considerations since the engineer must anticipate how much of time will be needed to recharge the brake pipe pressure in order to make them usable again.
When driving a route, there are many factors for an engineer to consider. First, freight trains vary in length but can be over a mile long, weighing thousands of tons (United States Government Accountability Office 2019). Heavier trains respond more slowly to throttle and brake inputs and in some cases can take more than a minute to change speed. Considerable experience is required to properly anticipate the effects of throttle or brake control inputs. Furthermore, the couplings between train freight cars allow each to move independently over a short distance (“slack action”). Since power can only be applied by the locomotive wheels, increasing the throttle will cause the locomotive to pull away from the cars behind it, and the couplings between successive cars can break if both throttle and brake are not carefully managed. Done correctly, the pulling force from the locomotive propagates down the train (“stretching the train”), setting the entire train into motion. During dynamic braking action, “bunching” of the train can occur, where the locomotive slows down relative to the rest of the train, and the couplings between cars transmit the braking force down the entire length of the train. The air brake can also cause bunching and stretching of the train due to unequal brake application while the brake pipe pressure equalizes. The engineer must also consider the loading distribution of the entire consist, since the behavior of the cars will vary based on their weight. All of these factors significantly complicate freight train handling using throttle, dynamic brake and train brakes, and
considerable experience is required to avoid breaking couplers between cars in many common situations.
Engineers must be certified to operate on a particular route, which includes demon-strating that they have memorized the speed limit for each section of track as well as the location of signals along the route. The terrain of the route, specifically the grade, and places where brakes should usually be applied and released must also be memorized. Careful management of the bunching and stretching action is necessary on hills, where the front portion of the train may be accelerating downhill while the back of the train is still working against gravity. This creates high forces on the links of the cars cresting the hill at any given time. Braking strategy is especially difficult given the slow and variable application of the air brake. For reasons discussed above, as the train travels downhill, the engineer must keep the speed below the limiting track speed but at the same time take care not to over-apply the train brake, since it cannot be partially released.
Given these considerations, it clearly requires significant skill and experience to control a freight train safely, and it is even more difficult to perform this task ef-ficiently (e.g., minimizing fuel/energy usage). Any use of either dynamic or train brakes dissipates energy as heat. In theory, there is some minimum braking energy loss associated with driving a given route, defined by grade, speed limits, consist characteristics and track conditions. Additional energy is consumed responding to various signals or other events requiring speed changes. An engineer’s driving strat-egy is defined by the way that he or she chooses to carry out the driving task at both a tactical and strategic level. Tactical decisions affect the execution of a given task, such as how long an engineer remains at a throttle setting before applying more power, bearing in mind that too much power applied too quickly could break the car linkages. In this case, the decision to wait a shorter or longer amount of time is independent of the engineer’s larger immediate goal, which is to bring the train up to speed. A strategic decision will be more goal-based: for instance, a strategic decision might be where an engineer chooses to begin slowing down for a red signal. Both types of decisions depend on the engineer’s “mental model” for the consist – how it
responds to throttle and brake applications, and also the railroad’s operating rules that dictate how to respond to wayside signal changes and track speed limits.
Today, automated energy management systems are available to carry out the complex task of managing a freight train’s movement and are increasingly used in commercial operation. However, as will be discussed in the following sections, there are several operating conditions where the engineer must still operate the train, thus illuminating the need for more sophisticated automated modes and forming the basis for this project.
Chapter 2
Motivation
2.1
Changes to the Railway Workforce
2.1.1
GE Trip Optimizer and Expert De-Skilling Concerns
In 2009, Houpt et al. described a revolutionary “locomotive control system enhance-ment”, termed Trip Optimizer (TO), that promised to deliver efficiency improvements for rail operations (Houpt et al. 2009). TO consists of two parts: a planning system that pre-computes an optimal speed profile for a given route section that minimizes fuel use given the consist and its distribution, number and type of locomotives, and route characteristics; and a “dynamic control system” that executes the generated speed plan, while incorporating train handling rules to prevent coupler damage. The TO speed profile for the next several miles is shown on a moving map cab display, and allowing the engineer to anticipate the future behavior of the automation. Trip Optimizer saves fuel by reducing unnecessary braking and subsequent accelerations, since braking converts kinetic energy into heat that is dissipated as a waste product. For example, TO’s control system might bring the throttle to idle earlier than a hu-man engineer would in order to let air resistance and the track friction slow the train to the appropriate speed. Analysis of TO performance in revenue service showed significant fuel savings (up to 13%) while maintaining train handling comparable to an experienced crew. As of 2020, TO has been widely deployed across the United
States and other countries, with over hundreds of millions of miles driven (Eldredge and Houpt, 2011).
However, this widespread deployment of an automated control mode has raised some concerns that this might lead to a degradation in the manual control skills of the engineers, often referred to as “de-skilling”. Since at least 1983, researchers have noted that higher levels of automation frequently correspond to decay of manual skills in human operators and a lack of appropriate experience. Bainbridge suggested that it is more difficult for humans to effectively supervise and then take over for automation when the human infrequently takes manual control (Bainbrige 1983). In addition to depriving the operator of valuable manual control practice, higher levels of automation can also cause what is dubbed the “out-of-the-loop” problem: an operator supervising an automation system or automated process will be less able to a) identify when system errors occur and b) manually perform tasks after failure occurs. Endsley and Kiris argued that “a loss of situational awareness (SA)” is the primary driver for these phenomena (Endsley and Kiris 1995). The current state of in-cab automation does little to counter either the loss of manual skills or the out-of-the-loop problem, leaving a gap for future automated modes to address.
The problem of de-skilling arises in many different contexts, and a close parallel to the freight rail case can be in found in aircraft cockpit automation. Due to the workload of controlling an aircraft in three dimensions, aircraft cockpits have been automated earlier and more heavily than locomotive cabs. Current cockpit automa-tion is complex and confusing to operate, and its widespread use has been implicated as a factor in multiple recent aviation accidents (Elias 2019). A 2007 study found “considerable knowledge gaps in pilots’ mental models of the automation” when pi-lots were asked to recover from a simulated disturbance in automation performance. While none of the simulated trials ended in a catastrophic event, many pilots were unable to meet performance objectives for the aircraft (Nikolic and Sarter 2007). As more complicated automation modes are introduced into locomotive cabs, automa-tion designers will need to recognize that the skills of the human operators, over time, may deteriorate and affect their ability to take over from the automation.
2.1.2
An Aging Workforce
In addition to the concerns of de-skilling due to increased automation, the rail industry is expected to suffer large knowledge and experience losses as the current workforce begins to retire. A 2011 Federal Railroad Administration (FRA) report projected that nearly half of the railroad employees in the United States would be eligible for retirement in 2019. The replacement engineers may not develop the same level of expertise as their predecessors if they predominantly operate in the automated modes and may have more difficulty taking control from the automation. In addition to gaps left by retiring employees, the FRA projects more jobs becoming available as the rail market continues to grow, meaning that an even larger share of the workforce will be relatively inexperienced in coming years (Federal Railroad Administration 2011).
2.2
A New Mode Design
As described previously, safe manual operation of a freight train is a difficult task. An expert engineer develops intuition for handling a train over time, often starting by riding as a conductor alongside an experienced engineer, then during training when they drive with an instructor, and finally through his or her own experience handling the train manually. These experiences teach expert engineers to better anticipate how track conditions, grade, and the particular arrangement and loading of freight cars determines response to brake and throttle inputs. A trainee or engineer that lacks manual control experience may be unable to anticipate train behavior, and the design of new enhanced automation systems must account for this reality.
The goal of the enhanced manual mode is to expand the use of automated modes while preserving the engineer’s ability to safely manage the train’s movement regard-less of the experience level of the engineer (Brooks et al. 2016). Ideally, the new automation mode would allow the engineer to specify the high-level goals or driving strategies of the automation, thereby defining considerations other than fuel consump-tion that should determine the “ideal” speed profile without requiring the engineer to understand and fine tune various numerical parameters in the speed control system,
alleviating much of the need for extensive operator experience. Additionally, the en-gineer will gain insight into the response of control algorithm since it will create a different optimal profile depending on the particular selection of settings. It is also desirable for the new system to allow the engineer to make changes and compute a new speed profile while the trip is underway in response to unexpected changes, such as a new speed restriction. Such a mode would broadly be defined as a “shared con-trol” model, which generally falls under the category of supervisory control models (Sheridan 2011). For an example of how shared control might work, consider a typical trip along an engineer’s route. Before the train departed, the engineer had set some automation parameters that determine a speed plan in line with the operator’s goals, like a maximum fuel efficiency or alternatively a minimum trip time. After starting the trip, the engineer gets a call from the dispatcher, who tells the engineer that his train must clear an upcoming intersection by a certain time, or else he or she will have to stop and wait until an approaching train clears the intersection. Viewing the current speed plan, the engineer realizes the train will not be able to clear the in-tersection, but the engineer is able to adjust the automation parameters to prioritize speed over efficiency until past the intersection, and finds a new plan that follows the new goal. With current in-cab TO automation, which uses a traded control scheme, an engineer is not be able to adjust the speed profile enroute. If the speed plan is too slow to satisfy a required time of arrival at an intersection the engineer has no choice but to take over control manually.
Chapter 3
Problem Statement
To design the new type of automation mode described earlier, it is necessary to un-derstand the operators’ normal mental process for controlling the movement of the train. The system must capture an engineer’s mental model of train behavior, then understand how this mental model influences behavior through control strategies that the engineer develops. The concept of a mental model is generally defined as a set of internal mental representations of actual systems that are individually constructed based on experience and provide a framework for people to make decisions (Cher-mack 2003)(Proctor and Van Zandt 2008). These characteristics make it difficult to objectively reconstruct another person’s mental model since each engineer will have different experiences and goals during the formation of their models. Nevertheless, it is possible to estimate certain aspects of an expert’s mental model and understand the general trends that occur in the mental models of a specific population. These mental model approximations then can be used in various techniques to better understand engineers’ control strategies.
3.1
Methods for Analyzing Mental Models
This section briefly describes three methodologies for characterizing the operator’s mental model - hierarchical task analysis, cognitive task analysis, and concept map-ping - and examples of their prior use in locomotive control research.
3.1.1
Hierarchical and Cognitive Task Analysis
Task analysis as a method can be traced back to the early 1900s, when researchers broke physical tasks into individual “motion elements” that could then be analyzed individually to find efficiency improvements (Proctor and Van Zandt 2006). Both “hi-erarchical” and “cognitive" task analysis build off of the general idea of defining a top level goal then breaking the tasks necessary to achieve the goal into a hierarchical set of subordinate goals and observable actions that can be separately described in con-siderable detail, along with precedence constraints. Hierarchical Task Analysis (HTA) generally starts by observing the process or system to be modeled and interviewing the person or people whose mental model is being analyzed about the information and actions they perform. The researcher then determines a series of goals and sub-goals that together represent the task, along with the component physical actions and the plan to achieve each goal or sub-goal (Proctor and Van Zandt 2006). For instance, a hierarchical task analysis for baking a batch of cookies might propose the following goals: procure ingredients, measure ingredients, combine ingredients, form the cook-ies, bake the cookies. Each of these goals could be further divided into subgoals, such as measuring each specific required ingredient, and would have associated actions, like retrieving a set of measuring cups or a food scale.
Cognitive Task Analysis (CTA), as the name implies, focuses on thought processes as well as actions (Proctor and Van Zandt 2006). This becomes especially relevant as increasing automation shifts work from physical labor to cognitive processes. The key challenge for cognitive task analysis is that the processes of interest are not phys-ically observable, since most of an expert’s knowledge is held in his or her procedural knowledge (Clark and Estes 1996). They are only discovered by discussion with a domain expert or inference from observed behavior. As an example, during a hierar-chical task analysis, one might observe that a pilot preparing to land an aircraft will adjust the throttle when appropriate, and state that a goal of the pilot is to select the appropriate engine power for landing. A cognitive task analysis would focus on the process by which the pilot decides what engine power to select, including how
the pilot assesses current airspeed, altitude, attitude, position relative to the runway, vertical descent rate, and other traffic as well as the cues that indicate to the pilot that he or she needs to add or subtract power. These HTA and CTA techniques have been applied to describe high level aspects of locomotive driving control, as reviewed in later sections.
3.1.2
Concept Mapping
Concept maps are a quick and flexible way to graphically describe relationships among elements in a complex system. This technique helps to externalize and organize knowledge in a variety of settings. Concept maps generally identify main concepts as “nodes” on a graphical network, with lines depicting which nodes influence each other. There are variations in how links are labeled, if at all, and how nodes are organized (Coffey, Hoffman, and Canas 2006). For a complicated task or system without clear divisions of goals or sub-tasks, concept maps lend structure without assuming a pre-existing hierarchy. While task analysis generally has linear progression of goals and subgoals, concept maps can represent more complex relationships between different system elements. Because concept maps do not attempt to discretize processes into independent functions, they are a good choice for systems with many overlapping and interrelated parts. An example concept map can be found in Figure 3-1.
3.2
Prior Work
3.2.1
Branton’s Task Analysis, 1978
Though rail transportation has been operational for almost two centuries, it is only in the last 50 years that it has received much attention from human factors researchers. Branton was one of the first researchers to study the human aspects of rail (Branton 1978). Based on interviews with hundreds of engineers and rail inspectors, Branton constructed a theoretical task analysis for train control. He defined each route that an engineer drove as a “mission”, and identified three types of task variables, which
were climactic, train specific, and geographical. Additionally, Branton argued that there were four essential internal representations of the world: the goal, the operator’s position in time and space, the task variables, and the success potential. Furthermore, he hypothesized that these representations serve to help the driver anticipate the train’s trajectory and compare it to an “idealized goal”. While a formal hierarchy is not presented, the author goes on to outline four informational requirements: the ability to orient oneself, predictive aids, aids for “motivational effort”, and immediate environment cues (for example, cues provided by the motion of the train). Branton concluded that if these basic skills were accounted for in new locomotive system designs, engineers would be capable of operating in new environments. This set of proposed internal representations and informational needs forms one of the earliest frameworks for evaluating a locomotive engineer’s mental model. However, there is a lack of specific detail on different train handling strategies, only the assertion that such strategies are acquired through experience on the railway.
3.2.2
Naweed et al’s Hierarchical Task Analysis, 2018
Currently, two crew members are required for freight rail operations in many countries, also called “two-up” operations. Due to many factors including increased automation capabilities, predicted driver shortages, and potential cost savings, there is some impetus to transition to single-crew operations. In 2018, Naweed et al. analyzed the division of labor between the two crew members using a hierarchical task analysis (Naweed et al. 2018). The intention was to understand the current requirements of a two-person crew in order to determine the feasibility of a one-person crew. The resulting HTA had eight high-level goals, two of which (Driving on the Mainline and Encountering Temporary Speed Restrictions) provide a baseline hypothesis for important elements of the expert mental model being characterized in this project. For instance, the sub-tasks identified in Encountering Temporary Speed Restrictions were used to identify important locations along the simulated route in the experiment for detailed analysis. As with the work completed by Branton, only the goals and sub-goals are discussed, and little to no attention is given to how an engineer and
Figure 3-1: A concept map illustrating the duties of a locomotive engineer. Taken from Groshong 2016.
conductor meet these goals (their shared driving strategy).
3.2.3
Groshong’s Concept Maps, 2018
In a prior collaboration between GE and MIT, Groshong synthesized conductor and engineer concept maps from three different CTAs previously developed for the FRA (Groshong 2016). One of the final concept maps from this study is shown in Figure 3-1. The intention for this study was to understand the different roles of automation and a human operator at different levels of automation, which then informed paths for further automation in the cab. Like the Naweed HTA, the concept maps also helped identify potential critical areas and cues for engineers that could be analyzed in more detail. Additionally, Groshong identified some key gaps in the existing CTAs from other sources, including specifically a lack of detail regarding braking strategy. The engineer concept map was also used to develop a framework for analyzing verbal interactions during the expert-novice simulations, as is discussed in Chapter 4.
3.3
Key Aspects of the Mental Model for Mode
De-sign
For the purposes of the new automation mode design, these analyses provided helpful background information and informed experiment design, but lacked detailed descrip-tions for some key aspects of expert mental models. Prior research mainly focused on identifying tasks, information needs, or workload, but did not describe the opera-tors’ strategies for accomplishing these tasks or the thought processes of experts. For instance, though the HTA by Naweed breaks the high-level goal of encountering Tem-porary Speed Restrictions (TSRs) down into a series of sub-tasks that would logically be accomplished in order, it does not pinpoint where the expert engineer begins to factor an upcoming TSR into his or her driving strategy, and simply lists the first sub-task as “observe track sign for upcoming TSR" (Naweed, Balakrishnan, and Dorrian 2018). Since the locomotive engineer is given a “bulletin” that describes the TSRs prior to beginning a trip, it is reasonable to hypothesize that an engineer can plan for an upcoming Temporary Speed Restriction before actually seeing the orange warning placard defining its beginning. Because this cognitive phase of dealing with a TSR does not occur at a pre-specified place, it is not easily captured in a traditional HTA or CTA. Similarly, cognitive maps can help specify important cues, aspects of the environment, and relationships among cues but they do not frame these cues within a spatial or temporal context that explains the decision-making process of engineers. Ultimately, it was decided to represent context by considering the following:
∙ What the engineer’s primary focus is at any given time (including but not limited to goal setting, action planning, information gathering, etc)
∙ What information triggers an engineer’s decision-making process ∙ Where cues for decisions are located in time and space
∙ What information is critical to make a decision to act
so that they could be incorporated into the design of new automated modes for an improved version of Trip Optimizer.
Chapter 4
Methods
4.1
Overview
As described in Chapter 3, the overall aim of the experiment was to identify the exter-nal factors that are part of the engineer’s mental model and control strategies when driving a route. Unlike other methods that treat tasks as independent of the overall context, both spatial and temporal positioning are considered to be important for analysis of the engineer’s mental model. The study paired an expert freight engineer with a novice subject with very little knowledge of rail operations as the operating crew of a freight train. The subject pair drove two routes together: one with the novice operator controlling the train (NAC, or “novice-at-the-controls”) and the other with the expert engineer controlling the train (EAC, or “expert-at-the-controls”). The participant operating the train controls was not able to see the external environment, thus the participants had to verbally communicate the necessary information or in-struction to execute an appropriate control action.
From the NAC scenario, it was expected that the expert engineer, through their inquiries and instructions to the novice operator, would reveal the key decisions during driving, what information cued the decision, and how the information was used to arrive at a decision. In the EAC scenario, the expectation was that the content and timing of the information requests from the expert engineer would illuminate both the information engineers rely on for decision-making processes and the frequency
at which they updated their mental models. Five expert/novice pairs drove the route, in addition to an expert/novice pair that participated in a pilot study that allowed the research team to refine the study methods. After each experiment, every interaction between the two subjects was coded by the type of interaction and its context. Interactions were then analyzed, along with train handling data, to discern driving strategies and common elements of the mental model and control strategies.
4.2
Subjects
Expert freight engineers were more mostly from a major US or Canadian railroad company (i.e. “Class I railways”). In total, five engineers from five different railroad companies were selected 1. All had at least six years of freight engineer experience, although some engineers had transitioned to other roles for their railroad and were not driving on a regular schedule. The average age of the engineers was 45.4 years, and the standard deviation was about 10.6 years, with individual subjects ranging between 32 and 61 years old. They had varying levels of familiarity with Trip Optimizer and the rolling map, ranging from one engineer who was qualified as a TO instructor to another engineer who had never used it professionally. None of the engineers were familiar with the route being simulated in the CTIL. Novice subjects were local university students or recent graduates (age 18+) who had no experience with rail operations. Four of the novice subjects were female and remaining subject was male. Both expert and novice subjects were proficient in English.
4.3
Cab Technology Integration Laboratory
The Cab Technology Integration Laboratory, or CTIL, is a full-size, stationary lo-comotive cab simulator located at the Department of Transportation’s Volpe Center in Cambridge, Massachusetts. It is a fixed base training simulator with a full sized freight locomotive replica cab, designed, built and modified for DOT/FRA research 1The total number of subjects was limited by available experiment time in the simulator, federal
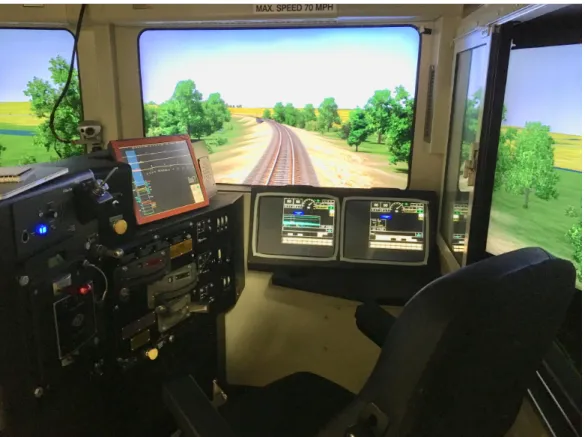
use by Alion Science Inc. (McLean, VA) and Corys, Inc. (Corys, Inc., Jacksonville, FL). For this study, it was equipped with standard train handling information dis-plays as well as a Trip Optimizer moving map disdis-plays on the conductor’s side. The engineer’s station was equipped with a 105 side stand for locomotive controls, as seen in Figure 4-1. During all phases of the experiment (excluding training periods), a curtain was put up in the center of the cab, between the engineer’s seat on the right and the conductor’s seat on the left, and the engineer’s forward out-the-window dis-play was blacked out. This allowed the subject seated on the conductor’s side to see out of the cab as normal, while the subject seated at the engineer’s control position could not see the outside environment ahead, nor the moving map on the conductor’s side.
Figure 4-1: The right side of the Cab Technology Integration Laboratory, where the engineer typically sits. The control stand can be seen to the left of the seat.
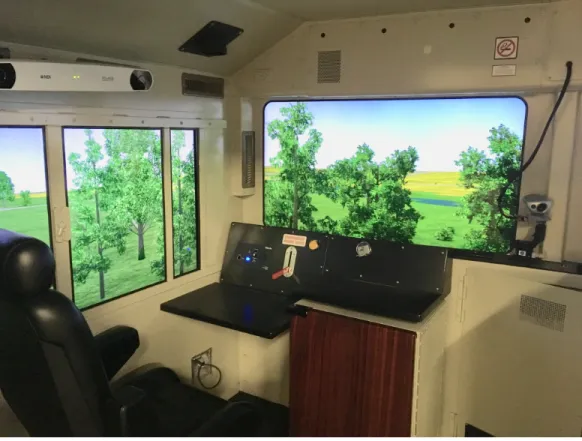
Figure 4-2: The left side of the Cab Technology Integration Laboratory, where the conductor typically sits.
4.4
Test Conditions
4.4.1
Overall Study Design
In order to understand different facets of expert mental models, two test conditions, referred to as “scenarios”, were designed. Both scenarios shared the same route, which was a 65-mile segment of the BNSF Railway’s Aurora subdivision in Illinois that was generally flat with some rolling hills outside urban areas. The scenarios differed in the roles of each of the test subjects, as well as the placement of different features along the route, such as speed restrictions and yellow or red signals. The scenarios were designed to require the expert subjects to make explicit train control decisions that would be verbally communicated and explained, thus providing some insight to the underlying mental model. Some scenario events were known well before being encountered, such as a temporary speed restriction, since they were outlined in the
simulated track bulletins or in incoming dispatcher messages. Other events such as signal states were manipulated along the route (e.g., changed from green to yellow) and could only be acted upon when observed. Still other events dealt with timing and issues relating to system-wide traffic flow. Staying on schedule is important as any delays in the scheduled arrival may complicate the schedule of the train across the network. It was assumed that additional time pressure might alter the engineer’s driving strategy and would reveal how their decision-making process would alter the content or timing of information when controlling the train.
The scenarios were named according to the subject in charge of manipulating the train controls. Both the novice-at-the-controls (NAC) and the engineer-at-the-controls (EAC) scenarios were designed with five common Key Decision Points (“KDP”s) at which behavior could be compared. The KDPs included three temporary speed restrictions and two red signal encounters requiring a full stop. The KDPs were the primary points around which it was hypothesized that the expert subject would need to make explicit control decisions. The locations of these KDPs varied between the two scenarios to avoid any effect of participants learning and anticipating the events, but all of the subject pairs drove the same NAC and EAC scenarios.
In addition to the five KDPs, one timing-related even was included. During the experiment, the dispatcher (an experimenter) notified the train crew of a new “Meet-and-Pass” about 10 miles before a selected siding. The dispatcher informed the expert that another train was waiting in a siding ahead, and that the crew of the stopped train was about to reach the end of their duty day (at which point the crew would legally be required to stop operating the train). The dispatcher also asked for the expert subject’s estimated time to the siding. The scenario was designed to create a sense of urgency in train operations and to determine if time pressures help inform decision making en route. A full description of each route with locations of each event is in Appendix A.
4.4.2
Novice-at-the-Controls Scenario
In the NAC scenario, the expert instructed the novice as they drove the route together, explaining how to manipulate the controls and what factors had led to a specific de-cision. Presumably, the novice possessed only a rudimentary mental model of train operations and basic control strategies based on their brief pre-experiment training, so the expert subject would need to explicitly communicate all of the different as-pects of their mental model to the novice to drive the trip safely. The communication guidelines for the NAC scenario instructed the expert subject to give directions and a brief explanation for those directions, while the novice subject was to ask questions whenever directions were unclear. The expert was also responsible for the safe opera-tion of the train, and to issue instrucopera-tions to the novice that mimicked how the expert would drive if at the controls. The expert could consult a paper track chart and any speed bulletins throughout the scenario. The expert subject, who was seated at the conductor’s console, also had access to basic train handling data, including speed, acceleration, notch position, and brake pipe pressure, as well as the Trip Optimizer moving map, which showed location, track speed (not including temporary speed re-strictions), and grade. The novice subject had no view of the external environment and only access to the standard instrument displays in the locomotive cab such as train speed, air brake pressures, and acceleration, but not the Trip Optimizer moving map.
4.4.3
Engineer-at-the-Controls Scenario
In the EAC scenario, the expert controlled the locomotive, but could not see out of the simulated cab and could not see the TO moving map display on the conductor’s side. Experts were given a paper track chart with grade information removed and were able to view basic train handling data. For the purposes of this experiment, ba-sic train handling data included speed, acceleration, brake pipe and reservoir pressure information, throttle and brake lever positions, and distance measuring device read-ings. The novice subject sat in the conductor’s seat on the left side of the cab and was
able to see out the external environment. In addition to standard train displays, the novice subject could see the TO moving map. This objective of this scenario design was to study what external information was essential to constructing and updating the expert’s mental model. The expert would presumably need to constantly request location and train state information from the novice, and the content and frequency of these requests would reveal the information the expert needed but lacked. In order to prevent the interactions being dominated by certain requests for information that would certainly be needed for safe locomotive operations, the novice was permitted to proactively report seeing a milepost, rail sign, or rail signal. Additionally, ex-pert subjects could give novices standing orders to report specific conditions, such as reporting when the end of the train crested the top of a hill.
4.4.4
Condition Summary Table
Table 4.1 summarizes the different test conditions. The subject seated on the right, which is the engineer’s seat in normal operations, was able to manipulate the train controls from their position. The “signal reference guide” was a paper chart describing types and meanings of signals that could be encountered along the route. It was given to both expert and novice subjects.
4.5
Protocol
4.5.1
Informed Consent
The experimental protocol was approved by the MIT Committee on the Use of Hu-mans as Experimental Subjects (COUHES). Informed consent was obtained from both novice and expert subjects before beginning any portion of the experiment.
4.5.2
Training
No more than seven days before the experiment, the novice signed the informed con-sent form, and then completed a short training session at the CTIL facility. The
Scenario Type Conductor’s seat (left) Engineer’s seat (right) Expert Subject Resources Novice Subject Resources No. of Speed Restric-tions No. of Red Signals No. of MP Interac-tions
NAC Expert Novice
∙ Basic train handling in-formation ∙ TO moving map ∙ Track chart, with grade ∙ Signal ref. guide ∙ Track bul-letins ∙ Trip rules ∙ Communica-tion guidelines ∙ Basic train handling in-formation ∙ Signal ref. guide ∙ Communica-tion guidelines 3 2 1
EAC Novice Expert
∙ Basic train handling in-formation ∙ Track chart w/o grade ∙ Signal ref. guide ∙ Track bul-letins ∙ Track bul-letins ∙ Trip rules ∙ Communica-tion guidelines ∙ Basic train handling in-formation ∙ TO moving map ∙ Signal ref. guide ∙ Communica-tion guidelines 3 2 1
Table 4.1: Comparison of the engineer-at-the-controls and the novice-at-the-controls scenarios. In the last column, "MP Interactions" refers to meet-and-pass interactions.
novices watched a brief slideshow overview describing the CTIL simulator, the pri-mary cab controls that would be used (notch, dynamic brake, and air brake), and the basics of rail signaling and signage. Then they moved into the CTIL cab for a ten minute trial drive, during which operation of throttle, dynamic brake, and air brake, alerter, and TO moving map were explained. The novice drove along the route for a short distance, maintaining the maximum track speed. Signals and signage along the track were pointed out to the novice when appropriate. The novice completed the training session by bringing the train to a full stop at a red signal set by the experimenter.
On the day of the experiment, the expert subject arrived before the novice subject to complete the expert training session. After providing informed consent, the expert viewed a brief slideshow detailing the train and its properties (weight, length, load distribution) as well as the details of the route, including its length, track speed, and standard signals. The expert subject was then given generic “trip rules” (Appendix C) and a track chart, and allowed as much time as needed (typically five to ten minutes) to familiarize himself with the track chart for the route. When the expert subject felt prepared, they moved to the CTIL cab where they were given a brief overview of the CTIL, and then drove a training route. The training route was over the same route that the actual experiment took place over. The main difference between the training scenario and experimental scenarios was the lack of Key Decision Points – there were no temporary speed restrictions and no interactions with the dispatcher.
4.5.3
Experiment Session
After successful completion of the training route, the expert was introduced to the novice and both subjects were briefed on the two experimental scenarios, EAC and NAC. One scenario was performed before lunch, and the other after lunch. Three of the subject pairs performed the NAC scenario first and the other two subject pairs started the EAC scenario first. Subjects were briefed on applicable track bulletins and communication guidelines for the scenario. The track bulletins could be used during the trial, as was a reference sheet for the signals for both novice and expert.
Since wayside signalling indication schemes are not standardized across all railroads, some expert subjects felt more comfortable with a reference sheet showing what the wayside signals meant. A track chart that had been stripped of grade information was provided to the expert for the EAC scenario; for the NAC scenario the expert sitting in the conductor’s sea was allowed to reference the regular track chart that included grade data. Each scenario took about 75 minutes to complete. After completing the first route, debrief questionnaires were given to both expert and novice subjects asking both subjects for their general impressions of how the scenario went, both in terms of the train handling and in terms of interactions. This was primarily to highlight any instances from the trial that would merit closer scrutiny from the research team, for instance, if expert subject had felt, at any point, that the train was not being controlled in a safe manner. A researcher also led a short verbal debrief to follow up on any points of interest from the trial. For example, one expert subject asked very few questions of the novice during the EAC scenario, and the researcher followed up by asking if the expert subject was aware that they could ask for more information throughout the scenario. Lunch followed the first scenario. Briefings for the second scenario followed the same pattern as the first trial. As before, subjects completed a questionnaire when the route was finished and were again verbally debriefed. Subjects were given an opportunity to ask any remaining questions and were given contact information for the research team in case they required any follow-up.
4.6
Data Collection and Processing
4.6.1
Data Collection
There were two primary sources of data: an audio/video recording of the interior of the cab, and the extensive train handling data recorded by the simulator. The audio/video recording also captured the engineer’s (right seat) primary internal dis-play with the basic train handling data as well as the simulated view outside of the cab. The dialogue of the interactions between expert and novice were captured in
the audio stream and subsequently analyzed as described below. The digital train handling data recorded 34 specific fields. For the purposes of this experiment, the most important data fields were: time, distance, grade, speed, acceleration, brake pipe pressure, and notch (throttle setting).
4.6.2
Interaction Coding
To anonymize the data, subject pairs were assigned eight-character pseudorandom codes. These codes were then truncated to the first two letters for ease of use. The following subject codes appear throughout the Results and Discussion sections: BH, CP, HD, NW, and WW.
After obtaining the interactions between the novice and the expert subjects, a special purpose ad-hoc coding scheme was developed and used to categorize the in-teractions between the expert and novice by content, location and timing, with the intent of capturing the underlying mental model and decision-making process of an engineer. The coding framework was largely based on the techniques used in compu-tational linguistics, with domain-specific knowledge from concept maps developed in previous locomotive studies (Groshong 2016). Interactions were first given a surface-level (Level 1) code, which expressed the type of interaction (question, response, acknowledgement, confirmation, etc). Level 1 codes encompass Forward and Back-ward Communicative Functions as outlined by Core and Allen (Core and Allen 1997). The interactions were given a second code related to the semantic meaning of the in-teraction (Level 2) code. The categories for Level 2 were largely influenced by what interactions were anticipated based on previous work. A more complete description of how to use each Level 1 and Level 2 code is also available in Appendix F. Table 4.2 summarizes the applications of each of these codes, along with the 3-letter reference label that was used during the coding process.
Additionally several subcodes, listed in Table 4.3, were used to provide additional detailed information on the content of the interaction, not just the semantic purpose. For example, an interaction where the expert subject asks about upcoming grade would have a query-wh Level 1 code (QWH), a check precondition Level 2 code
(CHK), and a “grade” subcode. Two coders, both MIT undergraduate students with no prior knowledge of freight operations, were first trained on the basics of railway operations, including driving the simulator, then trained on how to apply the coding scheme as they watched the video and audio recordings. During the training process, the coders’ results were checked against an example training set of interactions from the test run of the study to ensure that the coding would be applied as intended.
Complete transcripts of the video recordings for each trial were created with each verbalization recorded with a timestamp. Important events, such as a passing a milepost, were also recorded. The transcription process was spread out over multiple members of the research team. These transcriptions were then given to the two coders who analyzed each trial individually, producing two different encodings for the same set of interactions. After all trials were coded, a single “reconciled” encoding was produced for each trial by merging the two encodings, which was then used for the analysis. Conflicts between the individual encodings were resolved through discussion on the part of the coders, with each coder explaining his or her reasoning for a code, and then the two coders agreed on the most reasonable explanation. Sections of each trial were also selected for quality assurance tests, where a member of the research team would code that portion of interactions and compare their conclusions with the reconciled encoding for consistency.
Level 1 Codes
Acknowledge ACK A verbalization indicating acknowledgement of the previ-ous statement or request
Confirm CON A verbalization indicating the person agrees with the pre-vious statement or request
Dispatcher DIS
A code used to indicate interaction with the dispatcher, which could be either the dispatcher’s verbalizations or responses from the subjects to the dispatcher
Inform INF Any verbalization that communicates information, while not being an inquiry
Propose PRO A verbalization that suggests a choice to either follow or not follow a request
Query-if QIF A conditional question, typically can be answered with a yes or no
Query-wh QWH A question concerning who, what, when, where, why, how Request REQ A statement that indicates the action to be taken by the
addressee Reject - explicit REX
A verbalization indicating the person disagrees with the previous statement or request, and refutes the previous statement or request directly
Reject - implicit RIM
A verbalization indicating the person disagrees with the previous statement or request, and indirectly refutes the previous statement or request
Level 2 Codes
Check precondition CKP
Collection of information on preconditions (environmen-tal cues, information from paperwork) to prepare for an upcoming scenario
Remind plan RMD Any reminders of pre-trip planned events
Confirm plan CNF A verbalization that confirms the upcoming scenario in response to a reminder or discussion of preconditions Evaluate plan EVL A verbalization that reconfirms what should be done
within the specific context of the scenario
Critique plan CTQ A verbalization that critiques or questions the rationale or execution of a plan
Refine plan REF Expanding on a previous plan to add new details or make changes based on new information or circumstances Clarify plan CLF A question or clarification to ensure plan execution
con-forms to expectations
Explain plan EXP The rationale and reason for executing a plan a certain way
Execute plan EXC The action or set of actions that should be employed to execute a plan
Table 4.2: An explanation of each Level 1 code and Level 2 code used during the coding process, along with the unique three-letter abbreviation for each code.
Controls Displays Train Train ∙ Air brake ∙ Dynamic brake ∙ Throttle ∙ Notch ∙ TO display ∙ Accelerometer ∙ Counter/Distance Measuring Device (DMD) ∙ Turn out ∙ Curve ∙ Grades ∙ Switch ∙ MP Y ∙ Speed flags ∙ Speed restrictions ∙ X MPH (track speed limit) ∙ Train type ∙ Slack action ∙ Track forces ∙ Train break-age ∙ Front, mid-dle, or end of train ∙ Train speed change
Table 4.3: A table of all subcodes used. The subcodes were sorted into different categories for easy reference, but only the subcodes were applied during the coding process (there is no distinction between subcodes of different categories in the encoded transcript).
Chapter 5
Results
5.1
Aggregate Data Analysis
5.1.1
Novice-at-the-Controls Scenario
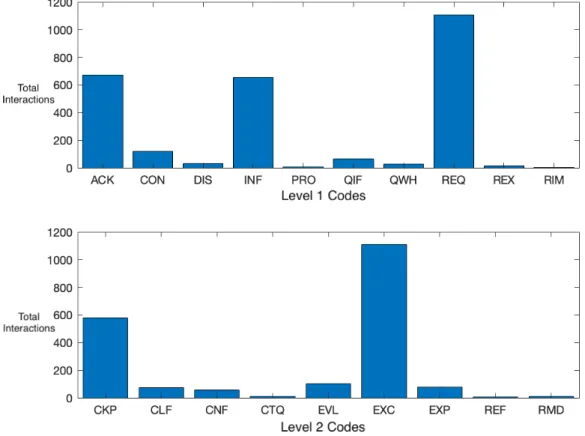
The novice-at-the-controls scenario was designed to reveal the context of the engi-neer’s decisions made along the route. This was accomplished by asking the expert engineer to verbally communicate their higher-order thinking processes to the novice subject through their instructions and the reasoning behind those instructions. As a result, the analysis for the NAC scenario focused on the Level 2 interaction types which identified the different types of higher-level processes, rather than the form of the interaction, which was represented by Level 1 interactions. Figure 5-1 shows the frequency of both the Level 1 (top) and Level 2 (bottom) interactions.
For Level 1 codes, 90% of the total interaction types were “request” (REQ), “ac-knowledge” (ACK), and “inform” (INF), which made up 41%, 25%, and 24% of all interactions, respectively. This is not particularly surprising since the NAC scenario primarily consists of the expert subject instructing and giving background informa-tion, which are “request” and “inform” interactions, and the novice subject complying with the request, which was verbalized with an “acknowledge” interaction. The least common interactions were the rejection codes (REX and RIM) and “propose” (PRO), each of which made up less than 1% of all interactions. Again, this is an
understand-Figure 5-1: Frequency of all novice-at-the-controls scenario interactions. The top plot shows the Level 1 codes, the bottom plot shows the Level 2 codes. Note that two interaction types, "EXC" or execute and "CKP" or check precondition, dominate the Level 2 interactions.