This is a repository copy of Gradual caldera collapse at Bárdarbunga volcano, Iceland,
regulated by lateral magma outflow.
White Rose Research Online URL for this paper:
http://eprints.whiterose.ac.uk/103058/
Version: Accepted Version
Article:
Gudmundsson, MT, Jónsdóttir, K, Hooper, A orcid.org/0000-0003-4244-6652 et al. (45
more authors) (2016) Gradual caldera collapse at Bárdarbunga volcano, Iceland, regulated
by lateral magma outflow. Science, 353 (6296). aaf8988. ISSN 0036-8075
https://doi.org/10.1126/science.aaf8988
eprints@whiterose.ac.uk https://eprints.whiterose.ac.uk/ Reuse
Items deposited in White Rose Research Online are protected by copyright, with all rights reserved unless indicated otherwise. They may be downloaded and/or printed for private study, or other acts as permitted by national copyright laws. The publisher or other rights holders may allow further reproduction and re-use of the full text version. This is indicated by the licence information on the White Rose Research Online record for the item.
Takedown
If you consider content in White Rose Research Online to be in breach of UK law, please notify us by
Gradual caldera collapse at Bárdarbunga volcano, Iceland,
1regulated by lateral magma outflow
2Magnús T. Gudmundsson
1, Kristín Jónsdóttir
2, Andrew Hooper
3, Eoghan P. Holohan
4,5, Saemundur
3A. Halldórsson
1, Benedikt G. Ófeigsson
2, Simone Cesca
4, Kristín S. Vogfjörd
2, Freysteinn
4Sigmundsson
1, Thórdís Högnadóttir
1, Páll Einarsson
1, Olgeir Sigmarsson
1,6, Alexander H. Jarosch
1,
5Kristján Jónasson
7, Eyjólfur Magnússon
1, Sigrún Hreinsdóttir
8, Marco Bagnardi
3, Michelle M.
6Parks
1, Vala Hjörleifsdóttir
9, Finnur Pálsson
1, Thomas R. Walter
4, Martin P.J. Schöpfer
10, Sebastian
7Heimann
4, Hannah I. Reynolds
1, Stéphanie Dumont
1, Eniko Bali
1, Gudmundur H. Gudfinnsson
1,
8Torsten Dahm
4, Matthew Roberts
2, Martin Hensch
2, Joaquín, M.C. Belart
1, Karsten Spaans
3,
9Sigurdur Jakobsson
1, Gunnar B. Gudmundsson
2, Hildur M. Fridriksdóttir
1,2, Vincent Drouin
1,
10Tobias Dürig
1, Gudfinna Adalgeirsdóttir
1, Morten S. Riishuus
1, Gro B.M. Pedersen
1, Tayo van
11Boeckel
1, Björn Oddsson
11, Melissa A. Pfeffer
2, Sara Barsotti
2, Baldur Bergsson
2, Amy Donovan
12,
12Mike R. Burton
13, Alessandro Aiuppa
14 1314
Revised manuscript for Science
– 14 June 2016
1516
1: Nordvulk, Institute of Earth Sciences, University of Iceland, Sturlugata 7, 101 Reykjavík
172: Icelandic Meteorological Office, IS-150 Reykjavík, Iceland
183: Centre for the Observation and Modelling of Earthquakes, Volcanoes and Tectonics (COMET),
19School of Earth and Environment, University of Leeds, Leeds LS2 9JT, UK
204: GFZ German Research Centre for Geosciences, Telegrafenberg, 14473 Potsdam, Germany
215: UCD School of Earth Sciences, University College Dublin, Ireland
23
6: Laboratoire Magmas et Volcans, CNRS-Université Blaise Pascal-IRD, 63038
Clermont-24Ferrand, France
257: Faculty of Industrial and Mechanical Engineering and Computer Science, University of
26Iceland, Hjarðarhagi 2-6, 107 Reykjavík, Iceland
278: GNS Science, PO Box 30368, Lower Hutt 5040, New Zealand
289: Departamento de Sismología, Instituto de Geofísica, Universidad Nacional Autónoma de
29Mexico, 04510 Ciudad de México, Mexico
3010: Department for Geodynamics and Sedimentology, University of Vienna, Althanstrasse 14,
A-311090 Vienna, Austria.
3211:
National Commissioner of the Icelandic Police, Department of Civil Protection and Emergency
33
Management, Skúlagata 21, 101 Reykjavík, Iceland
34
12:
King’s College London, King's Building, Strand Campus, London WC2R 2LS, England, United
35Kingdom
3613: University of Manchester, Williamson Building, Oxford Road, Manchester, M13 9PL, UK
3714: University of Palermo
– Piazza Marina, 61 90133, Palermo, Italy
38Abstract
40
Large volcanic eruptions on Earth commonly occur with collapse of the roof of a crustal magma
41reservoir, forming a caldera. Only a few such collapses occur per century and lack of detailed
42observations has obscured insight on mechanical interplay between collapse and eruption. We use
43multi-parameter geophysical and geochemical data to show that the 110 km
2and 65 m deep
44
collapse of Bárdarbunga caldera in 2014-15 initiated through withdrawal of magma, and lateral
45migration through a 47 km long dyke, from a 12 km deep reservoir. Interaction between the
46pressure exerted by the subsiding reservoir roof and the physical properties of the subsurface flow
47path explain the gradual, near exponential decline of both collapse rate and the intensity of the
181-48day long eruption.
49________________
5051
Calderas are 1 - 100 km diameter depressions found in volcanic regions of Earth and other planets.
52They mainly form by collapse of overburden into a subterranean magma reservoir during large
53volcanic eruptions, including the largest known super-eruptions (1-8). From 1900 AD to 2014, only
54six cases have been documented and with varying degrees of detail. The collapses of Katmai in
551912 and Pinatubo in 1991 occurred during explosive silicic (andesite-rhyolite) eruptions, the
56largest of the 20
thcentury. The collapses of Fernandina in 1968, Tolbachik in 1975-76, Miyakejima
57
in 2000 and Piton de la Fournaise in 2007 were associated with mainly effusive mafic (basalt
–
58basaltic andesite) intrusive activity and eruptions (2, 9-12).
59The consensus from field and modelling studies is that caldera collapse progresses from initial
60surface downsag to fault-controlled subsidence (1, 8, 13, 14). The limited number of modern
61examples and the scarcity of geophysical data leaves open the question of whether collapse occurs
62suddenly or gradually during the course of an eruption. The issue of whether collapse drives magma
63movement and eruption or eruption drives collapse also remains unresolved. Previous geological,
64geophysical, and modeling studies have produced a diverse and inconsistent set of answers to such
65questions (2, 4, 15, 16). The caldera collapse at Bárdarbunga in central Iceland from August 2014 to
66February 2015 offers a unique opportunity to address them directly.
6768
Figure 1. Bárdarbunga and geometry of collapse. A) Map showing the total caldera subsidence
69
(in meters) at the end of collapse in February 2015þ Minor sustained geothermal activity, monitored
70from aircraft, increased during the collapse with pre-existing ice cauldrons deepening by up to 50 m
71and new ones forming at the southern margin and to the southeast of the caldera (24). (B)
Radio-72echo sounding profile from 3 February, 2015, and a cross-section of the caldera with the collapse.
73The pre-collapse topography is obtained by subtracting the subsidence observed at the surface. (C)
74Modelled changes in ice thickness at the end of February 2015 resulting from ice flow in response
75to caldera collapse (24). D) NNW-SSE and E) WSW-ESE cross-sections as measured in June
762015, corrected for winter snow accumulation in 2014-15, measured in June 2015, and modeled
77vertical ice flow. Subsidence extends 2-3 km beyond the pre-existing caldera rims (dotted lines)
78where it amounts to 3-11 m.
79The Bárdarbunga volcano and the Holuhraun eruption of 2014-15
80
Bárdarbunga volcano (Fig. 1) and its related fissure swarms form a 150 km long volcanic system on
81the boundary between the North-American and Eurasian tectonic plates. The volcano resides
82beneath the Vatnajökull ice cap and has a broadly elliptic 13 by 8 km wide and 500-700 m deep
83caldera with a long axis trending ENE. About 700-800 m of ice fills the caldera (17, 18). Over 20
84eruptions have occurred on the fissure swarms outside the caldera in the last 12 centuries, including
85three that produced 1-4 km
3of magma, but no eruptions are known within the caldera in this period.
86(19).
87At 4 UTC on 16 August 2014, the onset of intense seismicity beneath the caldera marked the
88beginning of a major rifting event (20). The seismic activity was mostly located in the SE-corner of
89the caldera in the first few hours, but it soon began to propagate out of the caldera towards the SE
90(Fig. 2). After propagating to about 7 km from the caldera rim, fifteen hours after the onset of
91seismicity (~19 UTC), the moving earthquake cluster took a 90° turn and started migrating towards
92the NE. In the two weeks that followed, surface deformation and migration of seismicity indicated
93that a magmatic dike propagated laterally northeastward for 47 km in the uppermost 6-10 km of the
94Earth’s crust (20, 21). On 31 August, a major effusive eruption began above the far end of the dike;
95this lasted six months and produced 1.5±0.2 km
3of lava (~1.4±0.2 km
3of bubble-free magma)
96(22),
making it the largest in Iceland (or Europe) since the 1783-84 Laki eruption. Combined with
97the 0.5±0.1 km
3dyke (20), the total volume of identified intruded and erupted magma was 1.9±0.3
98km
3.
99The Onset of Collapse
100After the initial seismic activity in the caldera receded late on 16 August, seismicity was relatively
101minor there until 20 August. At the same time our GPS time-series from stations close to the
102caldera, suggest that deflation of the magma reservoir started on 16 August (20). On 20 August,
103caldera seismicity increased progressively with a series of earthquakes of magnitude M4-M5.8
104occurring in the following days (Fig. 2). The first two events occurred on the southern caldera rim
105(M4.7 on 20 August and M5.1 on 21 August). Following these earthquakes, three similar magnitude
106events occurred on the northern rim on 23 August, followed by four events on the southern rim on
10724-25 August. On 26 August activity shifted again to the northern rim with a M5.8 earthquake, the
108largest in the whole series. These data indicate that significant movement on ring faults started on
109the south side with the 20-21 August earthquakes, then began on the north side on 23 August, and
110by 24 August the ring faults on both sides where slipping, a process that did not terminate until at
111the end of February. Onset of collapse therefore likely occurred on 20 August with the ring fault
112fully activated on 24 August. If we compare the evolution of the dike together with the seismic
113moment release of the caldera collapse earthquakes, we can clearly see that the dike migration leads
114the moment release curve (Fig. 2A). We therefore conclude that onset of collapse resulted from a
115pressure drop in the reservoir as magma was laterally withdrawn into the propagating dike, with the
116latter possibly primarily driven by regional tectonic tensional stresses (20).
117The volume of the expanding dike on 20 August had reached approximately 0.25 km
3, increasing to
1180.35 km
3on 24 August (20) with the source of this magma being the reservoir beneath the caldera.
119The relatively minor caldera seismicity on 17-19 August indicates the material overlying the
120magma reservoir deformed mostly elastically until it reached a critical failure point of caldera
121collapse on 20-24 August. If we assume that the entire volume of eruptible magma within the
122reservoir was
1.9±0.2 km
3, then the critical volume fraction required to reach the failure point and
123trigger the collapse (23) was 0.12-0.21.
124125
126
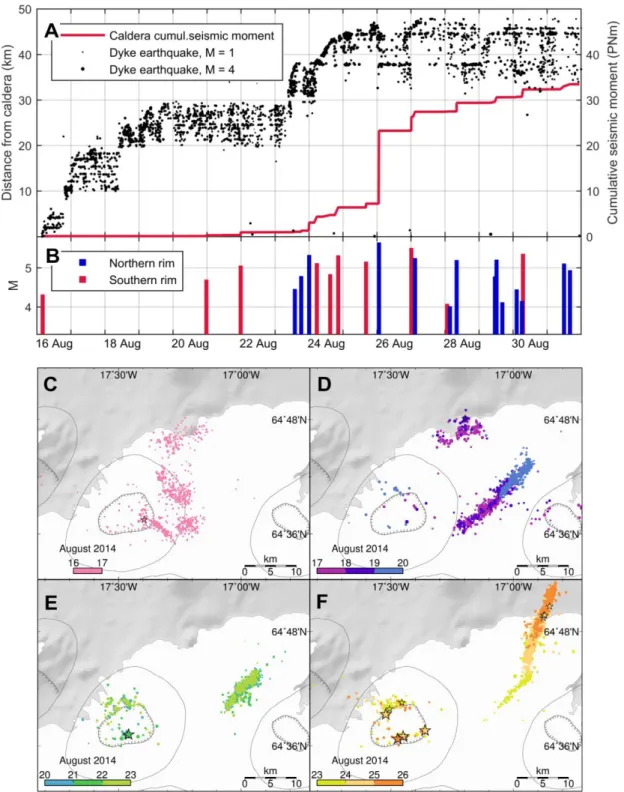
Figure 2. Onset of caldera collapse.
A) Cumulative seismic moment release from caldera
127earthquakes plotted together with distribution of seismicity along the dike length, using high quality
128relative locations of earthquakes (20), for the time period when the dike progressed away from the
129caldera. B) Significant caldera earthquakes with magnitudes above M4 plotted as impulses, where
130the height represents magnitude and color represents location on southern or northern rim. C) Map
131of NW Vatnajökull showing earthquake epicenters on 16 August, D) 17-19 August, E) 20-22
132August and F) 23-15 August.
133Ice Flow, Subsidence Magnitude and Volume
134
As we recorded the caldera subsidence mainly on the ice (Fig. 1, Fig. S1), we made corrections and
135additional measurements to derive the underlying bedrock displacement. Our main data on ice
136surface changes and ice movements are repeated C-band radar altimeter surveys from aircraft, maps
137made from optical satellite images and the continuously recording GPS station BARC we set up in
138the center of the caldera on 13 September. The observed velocities and displacements of the ice
139surface are displayed on Figs. 3A and 3B. We use these observations to constrain
three-140dimensional Full-Stokes finite element modelling of ice-flow in response to the collapse (24). The
141results show concentric flow, towards the point of maximum collapse within the caldera, with
142maximum ice thickening at the center of ~3 m by February 2015 (Fig. 1C, Fig. S2). The maximum
143ice surface lowering of 62±2 m, determined by aerial altimeter surveys, gives a maximum bedrock
144subsidence of 65±3 m. Our data and models show that apart from the concentric flow towards the
145deepest part of the subsidence (about 1 km east of BARC) horizontal flow was not much affected
146(Fig. 3A). We therefore conclude that suggestions of a large increase in ice flow out of the caldera
147during these events (25) cannot be fitted with our data.
148Bedrock subsidence exceeding 1 m occurred within an area of 110 km
2that extended beyond the
149existing caldera (Fig. 1, Fig. S1). After termination of collapse the total subsidence at the
pre-150existing caldera rims amounted to 3 to 11 meters (Fig. 1D and 1E). Using subglacial radio-echo
151soundings we observed a down-sagged bedrock surface without any clear signs of fault offset (Fig
1521B) or indications of water bodies at the ice bedrock interface. The limited resolution resulting
153from the 600-800 m ice thickness means that we cannot on the basis of the radio-echo results
154exclude the possibility of steep fault escarpments. However, substantial vertical fault movement at
155the base of the glacier would result in high strain rates within the basal ice which would instantly
156fracture the ice fabric and propagate upward. During drainage of subglacial lakes in Iceland, large
157surface fractures induced by basal motion have been observed repeatedly (26) and can serve here as
158an analog for the possible surface manifestations of vertical basal motion. The absence of such
159surface ice fractures at Bárdabunga indicates that no substantial fault escarpment formed at the
160bottom. The calculated collapse volume is 1.8±0.2 km
3, not significantly different from the
161combined volume of erupted and intruded magma (Fig. 3B).
162163
Figure 3. Time series of collapse. A) Vertical and horizontal velocities measured at the BARC
164GPS station in the center of the caldera (Fig. 1A), including the rate of vertical rate of ice surface
165subsidence found from altimeter aircraft data and optical satellite photogrammetry. The balance
166velocity is obtained by estimating the rate of displacement required to transport the net
167accumulation of the area draining ice towards east in the western part of the caldera. InSAR
168derived vertical velocities are based on (32). B) Subsidence at the center of the caldera and
169subsidence volume evolution. The volume of the subsidence is obtained by subtracting the mapped
170surface from the pre-collapse surface. The caldera subsidence curve is fitted with an equation of the
171same form as eq. (1). C) High resolution GPS for 12-23 September, showing M>5 earthquakes
172coinciding with 20-40 cm rapid collapse, superimposed on gradual subsidence. Note that the size of
173the steps depends on the location of BARC relative to the earthquake centroids, and cannot be used
174directly to infer the proportion of ring fault slip that ruptured seismically or aseismically. D)
175Cumulative number of M>4 caldera earthquakes, with
magnitude evolution colored in red, blue and
176grey representing clusters on the southern rim, the northern rim and smaller clusters, respectively
177(see Fig. S5). E) Cumulative seismic moment for M>4 caldera earthquakes.
178179
Magma source depth
180
Lava chemistry, surface gas composition and geodetic modelling indicate drainage of a magma
181reservoir at a depth of ~12 km. The erupted lava is typical olivine tholeiite with a relatively uniform
182chemical composition,
consistent with efficient homogenization of melts before eruption
.
Several
183independent geobarometers (Fig. 4) yield an equilibrium pressure of 350-550 MPa, indicating that
184melt resided at depths of 11-16 km before the eruption. We obtained a similar result (14±3 km)
185from analysis of subaerial gas measurements (Fig. 4). This depth concurs with our regional
186geodetic observations, which are dominated by a deflating source at 8-12 km depth beneath
187Bárdarbunga, after the cessation of dike-related deformation in mid-September (Figs. S3 and S4).
188189
Figure 4. Magma source depth from geobarometric and subaerial gas analysis. The CO2-box
190indicates the minimum pressure obtained (400 kbar) from density barometry of plagioclase hosted
191CO2-bearing fluid inclusions. The results from the analysis of subaerial gas compositions are based
192on FTIR and Multi-GAS measurements (24).
193194
Seismicity and subsurface structure
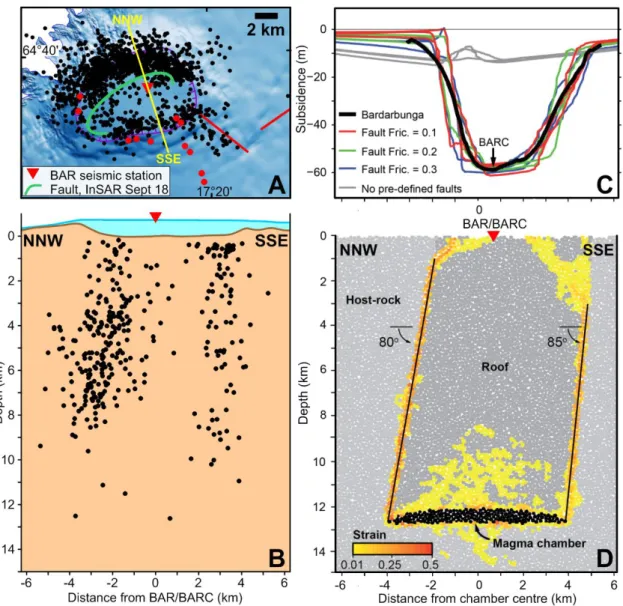
195We used seismic data and Distinct Element Method (DEM) numerical modelling (24), to
196characterize the deeper collapse structure as the reactivation of a steeply-inclined ring fault (Fig. 5).
197We mostly observed seismicity at depths of 0-9 km beneath the northern and southern caldera rims
198(Fig. 5B), with earthquakes being more numerous on the northern rim. This spatial pattern of
199seismicity is consistent with fracturing above a deflating magma reservoir that was elliptical in
200plan-view (27). In cross-section, the hypocenters indicate a steeply (~80°) outwards-dipping fault in
201the northern cluster, while the southern cluster they indicate a vertical or near-vertical fault dip. A
202series of DEM forward simulations of a magma chamber and ring fault system, as constrained by
203the hypocenter distribution and by the geobarometry data, tested the above structural interpretation
204against the observed NNW-SSE subsidence profile. The models indicate that a pre-existing and
205relatively low friction (coefficient of 0.1-0.2) ring-fault system controlled the subsidence at depth
206(Fig. 5C, D). Our best fitting models had preexisting faults dipping out at 80-85° from the caldera
207center on the north side and at 85-90° toward the caldera center on the south side. The modeled
pre-208existing faults lay at 1-2 km below the surface on the north side and 3-4 km on the south side.
209Modeling of a more complex fault geometry or the inclusion of greater material heterogeneity may
210further improve the data fit, but presently lacks robust geophysical constraints. The arrangement of
211an outward dipping fault on one side of a caldera and an inward-dipping fault on the other is typical
212of ‘asymmetric’ or ‘trapdoor-like’ collapses produced in past analog and numerical modeling
213studies (8, 28, 29). It also occurs at Glencoe (29) and Tendurek (30) volcanoes . Finally, our finding
214is consistent with past seismological results that defined a very similar ring-fault geometry during
215the last period of activity at Bardarbunga in 1996 (31).
216Through regional moment tensor (MT) inversion, we infer that the source mechanisms of 77 M>5
217events (Fig. S5) confined to two clusters beneath the northern and southern rim regions show
218contributions of both shear and non-shear components. The shear components indicate possible
219ruptures of segments on the ring fault. Shear failure on inward dipping ring faults, or the sudden
220injection of magma in horizontal fissures forming sills have been proposed (32) to explain the shear
221components of the observed earthquakes at Bárdarbunga. We, however, narrowed down on
222plausible solutions by using the micro-earthquakes (Fig. 5A). The moment tensor solutions are well
223constrained, but the inferred dip of the shear plane we obtain is uncertain since the non-shear
224component, in this case a negative, sub-vertical compensated linear vector dipole (vCLVD), is
225dominant. As a result, the shear orientation obtained depends very much on the decomposition
226approach.
227By using the constraint of the steeply outward dipping ring fault on the northern cluster we derive a
228MT solution that is a combination of a negative vCLVD and steep E-W striking reverse faulting
229(Fig. 3D, 3E and Fig. S5). In contrast, standard decomposition of the northern cluster MTs provides
230normal faulting along steep N-S striking planes, a result that is inconsistent with the observed main
231fault orientation. The southern cluster MTs are consistent with being composed of families (33) of
232steep normal faulting earthquakes.
233The large, negative vCLVD indicates a combination of downward contraction and horizontal
234expansion, as has been observed in mines as well as in volcanic calderas during collapses (e.g. 31,
23534). This could imply failure of support structures directly above or even within the magmatic
236reservoir, or the sudden response of the reservoir fluid to vertical compression.
237Temporal development of subsidence and related seismicity
238Subsidence occurred gradually during the eruption (Fig. 3B). From an initial rate in the caldera
239center of ~1 m/day during the first 20 days (Fig. 3B), subsidence declined in a near exponential
240manner with time (24). Subsidence terminated when the eruption ended in February 2015. We can
241associate some of the M>5 caldera earthquakes, during the first couple of months of activity, with
242drops of 10-40 cm, but subsidence was otherwise continuous (Fig. 3C). The gradual decline in the
243rates of subsidence and caldera volume growth is mirrored by a decline in the cumulative seismic
244moment, the latter reflecting a decrease in the number of larger earthquakes with time (Fig. 3D, 3E).
245Nonetheless, in terms of the cumulative seismic moment of 5.07x10
18Nm for the M>4.0 events,
246this collapse is the second largest recorded, after that of Katmai (1912) (35).
The geodetic moment
247depends on the shear modulus, the fault area and the amount of slip assumed. The shear modulus
248could be very low in regions of intense faulting such as on a caldera ring fault. The possible range
249of the geodetic moment is found by considering a ring fault reaching from the surface to 12 km
250depth, 60 m of slip and a shear modulus over a wide range, 2-20 GPa. This results in a
moment of
2514x10
19- 4x10
20Nm, or 10-100 times the cumulative seismic moment of the earthquakes. This
252difference
is consistent with the modeling of surface deformation observed during one of the events
253(Fig S7).
254255
Figure 5: Fault geometry and collapse modelling: A) Earthquakes 1 August
– 17 October 2014,
256
B) seismicity along a 2-4 km wide strip on the NNW-SSE cross section, depth relative to bedrock
257caldera floor. C-D) Two-dimensional DEM modeling of the collapse, constrained by subsidence
258geometry, earthquake locations in (B), and the geobarometry (Fig. 4). The geometry illustrated in
259(D) obtained the best agreement with the observations. The color scale shows the maximum finite
260shear strain. Surface displacement profiles for different pre-existing fault frictions are provided in
261(C). Three model realizations are shown for each friction value.
262Caldera-flowpath interaction and piston collapse modeling
263We see a short-term (multi-hourly) mechanical coupling of the collapsing caldera and the distal dike
264(south of eruption site) in the timing of earthquakes in the dike and at the caldera (Fig. 6A). Within
265a six-hour window before and after large caldera earthquakes the frequency of dike earthquakes was
266increased relative to background rate (24). We observed this pattern in the data after the beginning
267of October 2014, when the dyke had stopped propagating and a quasi-steady magma flow path had
268developed, until February 2015 when seismic activity stopped. For the three hours after caldera
269earthquakes with magnitude M > 4.6, as well as for the three hours before caldera earthquakes with
270M > 4.0, the increase in seismicity was significant (24) (p = 0.05; Fig. 6, Fig. S8).
271At Bárdarbunga communication therefore existed between caldera subsidence events and pressure
272changes in a conduit up to 47 km away. Spatiotemporal patterns of tilt at Kilauea Volcano, Hawaii,
273show a similar phenomenon that can be explained by the propagation of pressure transients within
274an elastically deformable dyke (36). By analogy, we can make the interpretation that caldera
275earthquakes may generate a pressure pulse that leads to increased seismicity at the end of the dike.
276The communication could be two-way, although it is difficult to explain a pressure pulse from the
277dike towards the caldera. One possibility is that readjustment of the dike (e.g. sudden unblocking)
278can increase the dike volume slightly and subsequently lower the magma pressure which then
279translates back to the caldera. The communication may also be entirely one-way, from the caldera
280to the dike: smaller caldera earthquakes, and/or aseismic deformation at depth just above the
281magma chamber may precede a large caldera earthquake, increasing dike pressure and dike
282seismicity.
283We explain the longer term (weeks to months scale) coupling in the form of the gradually declining
284rates of caldera subsidence, caldera volume change and lava eruption (Figs. 3B, 6B) with a model
285of a collapsing piston overlying a pressurized magma chamber. We assume that the chamber
286pressure and fault friction each partially support the piston weight (24). Drainage of magma reduces
287the chamber pressure and causes piston subsidence (Fig. S6). This in turn raises the chamber
288pressure, leading to a feedback loop that maintains quasi-constant pressure at the magma chamber
289top, and drives further magma drainage. The pressure feeding the eruption drops, however, due to
290the reduction in hydraulic head of magma over time. Kumagai et al. (37) also used a piston model to
291explain caldera collapse at Miyakejima in 2000, but in their model no change in hydraulic head was
292assumed and outflow rate was held constant.
293Assuming that the time-averaged resistive force due to friction on the ring faults remains constant,
294and that magma flow is laminar through a cylindrical pipe with radius r, and conduit length L, with
295L>>r, then
296∆𝑃 ≈ ∆𝑃
0𝑒
− 𝜋𝜌𝑔𝑟4 8𝐴K𝐿𝑡(1)
297Where 'P is the driving overpressure, 'P
0is the initial driving overpressure, U is the density of the
298
magma, g is gravitational acceleration, A is the cross-sectional area of the magma chamber, K is the
299dynamic viscosity of the magma and t is time (24). We estimated 'P
0and the constant in the
300
exponent, assuming that the measured subsidence within the caldera represents the decrease in
301magma chamber height with time (Fig 3B). Note, this represents a minimum estimate for 'P
0, as
302
there may also have been dilation at depth. The model also fits the measured caldera volume
303change (Fig. 3B) and eruption rate (Fig. 6B). This model predicts the same form of decay in flow
304rate (exponential) as the standard ‘Wadge’ model of depressurisation of an overpressured magma
305body (38), but by a different mechanism. The feedback mechanism of re-pressurisation from the
306ongoing piston collapse enhanced the length and speed of dike propagation, and the duration of the
307eruption. In this model, therefore, both the eruption drives the collapse and collapse drives the
308eruption.
309310
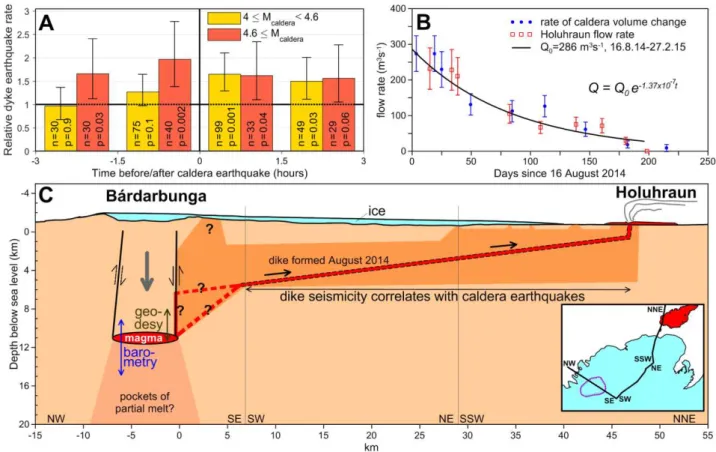
Figure 6. Caldera - magma flowpath interaction. A) Rate of dike earthquakes relative to
311
background levels before and after significant caldera earthquakes of magnitude >M4. The p-values
312indicate the two sided significance and n is the number of earthquakes used. Error bars indicate
31390% confidence intervals (24). B) Exponential model of magma flow rate constrained by caldera
314GPS subsidence (24) compared with rate of volume change in caldera and eruption rate in
315Holuhraun. The eruption stopped on Day 194 (27 February, 2015) before the driving pressure
316reaches zero, as expected if the conduit becomes clogged by solidifying magma as the flow rate
317drops. C) Schematic cross-section of caldera - magma chamber - pipe-like magma flow path and
318eruption site after dike formation (20, 21). The inferred magma chamber is set at 12 km below
319bedrock caldera floor. It is possible that magma ascended first along the ring fault before forming
320the dyke above 6-10 km depth. We indicate the constraints on depth to magma chamber from
321geobarometry with a blue arrow and from geodesy with a green arrow.
322Overview and implications
324
Table 1 contextualizes the key features of the 2014-15 Bardarbunga collapse with respect to those
325of the seven collapses instrumentally monitored to date. The areal extent of the Bardarbunga
326collapse (110 km
2) is the largest yet observed historically and is comparable to that associated with
327major silicic eruptions in the geological record (6). The total subsidence (65 m) is one to two orders
328of magnitude smaller than all past collapses listed here, but the large area means that it has the
329fourth largest collapse volume (1.8 km
3) overall. The erupted volume (1.4 km
3) is the largest of the
330observed mafic collapses so far, although considerable uncertainty surrounds the volumes
331associated with the collapse of Fernandina. In volume terms, both the silicic eruptions and collapses
332of Katmai and Pinatubo were twice to six times larger. The cumulative seismic energy release at
333Bardarbunga (25 x 10
13J, see Table 1) is dwarfed by that of Katmai (1600 x 10
13J) and similar to
334Miyakejima (22 x 10
13J), despite the much smaller area of the latter (1.9 km
2). This is explained by
335the much greater subsidence at Miyakejima (>1600 m). The gradual collapse of Bardarbunga had
336the second longest duration (190 days) yet recorded. Only the duration of collapse at Tolbachik
337(515 days) exceeds it. Finally, Bardarbunga has the longest confirmed length of an associated lateral
338intrusion (48 km) and the longest distance to the main vent (40 km).
339Volcano Year Magma Maximum
subsidence (m) Collapse Duration (days) Collapse Area (km2) Collapse Volume (km3) Reservoir Depth (km) Intrusion Volume (km3) (a) Erupted Volume (km3) (b) Total Magma Volume (km3) Distance to Vent (c) (km) Intrusion Length (d) (km) Seismic Energy (x 1013 J) (e) Max. EQ (f) Bardarbunga 2015 Basalt ~ 61 150 110 1.8 11-16 0.5 1.5 2 46 48 25 5.4 La Reunion 2007 Basalt ~ 450 2 0.82 0.1 2-3 0.02 0.14 0.16 7 7 ? 3.2 Miyakejima 2000 Basalt ~ 1600 40 1.9 0.6 4-7 1.2 0.01 1.21 5.6 35 22 5.6 Tolbachik 1976 Basalt > 500 515 2.5 0.35 4-6? ? 1.2 > 1.2 28 ~ 45 ? 2.9 Fernandina 1969 Basalt ~ 350 12 7 2 ? ? 0.2 > 0.2 10.5? 10.5? 2 5.2 Katmai 1912 Rhyolite > 1300 3 8.8 5.5 2-5 ? 13.5 > 13.5 10 10 1600 7 Pinatubo* 1991 Dacite ~ 900 2 4 2 7-11 ? 4.5 4.5 1 4 2 5.7 340
Table 1: Instrumentally-monitored caldera collapses since 1900 AD. 341
* Note that all caldera collapses except Pinatubo formed in association with lateral withdrawal and intrusion of
342
magma.
References for data:Bardarbunga: (20); this study; La Reunion: (12,16,44-46); Miyakejima: (2, 11, 34, 47-344
49); Tolbachik: (50-53); Fernandina: (2, 9, 54); Katmai: (35, 41, 55); Pinatubo: (2, 15, 42, 43, 56)
345
(a) Intrusion volume values are typically constrained by inversions of data from geodetic networks, and so are available 346
only for the most recent events.
347
(b) Erupted volumes are given as Dense Rock Equivalent (DRE) – i.e. with porosity removed. 348
(c) Distance measured from center of caldera to most distant known vent active during collapse. 349
(d) Estimated horizontal length of the intrusion, from locations of seismicity and/or inversions of geodetic data in all 350
cases except Katmai. For Katmai and Fernandina, intrusion length is estimated as the distance from caldera to vent
351
and is hence a minimum value.
352
(e) Cumulative seismic energy release calculated by converting the cumulative scalar moments (M
0) by using a factor of 353
5x10⁻⁵ (from energy-moment relationship determined by Kanamori et al. (57)) 354
(f) Maximum earthquake magnitude associated with caldera formation. Magnitude determined from surface waves, 355
Ms, is given for Tolbachik (53), Katmai (35) and Fernandina (54). For La Reunion, Md is used (12, 44). For Miyakejima 356
and Bardarbunga, the maximum moment magnitude (Mw) for collapse-related VLP events is given (34, 58, this study). 357
358
Our data and modelling show that withdrawal and eruption of magma triggered the collapse at
359Bardarbunga. For the likely depth to diameter ratio of the magma reservoir, the critical volume
360fraction required to trigger the onset of collapse (0.12-0.21) was much lower than that predicted by
361past analytical and analogue modelling (23, 39). A similar inference of low critical volume fractions
362at La Reunion and Miyakejima (16) was explained as a consequence of the reactivation of
pre-363existing ring faults, a proposition in line with our observations and analysis of the Bardarbunga
364collapse.
365Nonetheless, we also show that there is a tight mechanical interplay between collapse and eruption
366throughout the process once collapse has started, with eruption driving collapse and vice versa on
367both hourly and eruption-long time scales. For the longer time-scale coupling, the results also show
368that the physical properties of both the magma chamber roof and the magma pathway regulate
369caldera collapse and magma outflow rate. Consequently, collapse at Bárdarbunga occurred
370gradually and at a steadily (exponentally) declining rate. This is a very similar pattern to that
371inferred for the 1968 Fernandina collapse (2, 16). In contrast to some model predictions (40)
and to
372the 2007 collapse of Piton de la Fournaise (16), we found no evidence for rapid and sustained
373pressure increase in the magma chamber as a result of collapse, possibly due to substantial ductile
374behavior of the roof of the larger and deeper Bardarbunga magma chamber (13, 16)
.
375The question of whether or to what extent our understanding of caldera collapse at mafic volcanoes
376such as Bardarbunga is transferrable to large silicic systems remains an open one. On the one hand
377the gradual nature of collapse at Bardarbunga and Fernandina contrasts with the highly punctuated
378collapse style inferred during explosive silicic eruptions like Katmai and Pinatubo (2, 41). In
379addition, collapse at silicic volcanoes is generally considered to be triggered by eruption through a
380central vent rather than through the lateral withdrawal mechanism seen at Bardarbunga. On the
381other hand, of the two instrumentally monitored silicic collapses, the most silicic, Katmai was also
382clearly associated with a lateral withdrawal. This mechanism could therefore be more widespread at
383silicic calderas than commonly considered. In addition, the locations and mechanisms of the large,
384apparently collapse-related earthquakes interpreted to denote punctuated collapses of Katmai and
385Pinatubo are poorly constrained, such that a regional tectonic origin for them cannot be precluded
386(15, 35, 42, 43). Consequently, Bardarbunga 2014-15 provides our clearest picture yet of how
387caldera collapse can be triggered during large eruptions, and how the dynamics of the subterranean
388magma flow path and the interaction with magma reservoir pressure regulates eruption rates and the
389rate of collapse.
390Acknowledgements
391
A large part of the field effort was supported with crisis response funding from the Icelandic Government
392
through the Civil Protection Department of the National Commissioner of the Icelandic Police. A
393
considerable part of this work was made possible through the European Community‘s Seventh Framework
394
Programme Grant No. 308377 (Project FUTUREVOLC). Further support came from the EU Seventh
395
Framework Marie Curie project NEMOH No. 289976, and the project CO2Volc ERC grant No. 279802, the
396
Research Fund of the University of Iceland, the Irish Research Council, the Helmholtz Alliance on Remote
397
Sensing and Earth System Dynamics (EDA) andUNAM/CIC Intercambio Académico. We thank the
following key persons for help with instrumentation and data: B.H. Bergsson, V.S. Kjartansson, S.
399
Steinthorsson, Th. Jónsson, P. Erlendsson, J. Soring, I. Jónsdóttir, G. Sverrisdóttir and G. Sigurdsson, the
400
SIL network monitoring team at the IMO, the field observation team of the IES in Holuhraun, and for
401
collaboration on seismic instruments and data we thank R.S. White and the Cambridge team and C. Bean and
402
the UCD team. The subsidence of Bárðarbunga was mapped by the surveying aircraft of Isavia (Icelandic
403
Aviation Operation Services) and from satellite images acquired by Pléiades (© CNES 2014, Distributed
404
Airbus DS, subsidized access provided by the French Space Agency CNES’s ISIS programme) and SPOT 6
405
(©Airbus DS 2014). Committee on Earth Observation Satellites (CEOS) and Geohazards Supersites and
406
Natural Laboratories (GSNL) also provided access to satellite data. CSK data were provided by the Italian
407
Space Agency (ASI) through the Iceland Volcanoes Supersite agreement. The Icelandic Coast Guard
408
provided valuable aeroplane and helicopter support for the field effort. Field operations at Bárdarbunga were
409
supported by the Landsvirkjun power company, the Iceland Glaciological Society and Vatnajökull National
410 Park. 411 412
References
4131. M. Branney, V. Acocella, “Calderas” in The Encyclopedia of Volcanoes, H. Sigurdsson, B. Houghton, H. 414
Rymer, Eds. (Academic Press, Academic Press, Heidelberg, Amsterdam, Boston, ed. 2, 2015), pp. 229-315. 415
2. J. Stix, T. Kobayashi, Magma dynamics and collapse mechanisms during four historic caldera-forming 416
events. J. Geophys. Res. 113, JB005073 (2008). 417
3. A. R. McBirney, A historical note on the origin of calderas. J. Volcanol. Geotherm. Res. 42, 303-306 418
(1990). 419
4. R. S. J. Sparks, P.W. Francis, R. D. Hamer, R. J. Pankhurst, L. O. O'callaghan, R. S. Thorpe, R. Page, 420
Ignimbrites of the Cerro Galán caldera, NW Argentina. J. Volcanol. Geotherm. Res. 24, 205-248 (1985). 421
5. T. H. Druitt, R. S. J. Sparks, On the formation of calderas during ignimbrite eruptions. Nature 310, 679-422
681 (1984). 423
6. P. W. Lipman, Subsidence of ash-flow calderas: relation to caldera size and magma-chamber geometry. 424
Bull. Volc., 59, 198-218 (1997).
425
7. V. Acocella, Understanding caldera structure and develpoment: an overview of analogue models 426
compared to natural calderas. Earth Sci. Rev., 125, 125-160 (2007). 427
8. O. Roche, T. H. Druitt, O. Merle, Experimental study of caldera formation. J. Geophys. Res. 105, 395-416 428
(2001). 429
9. T. Simkin, K. A. Howard, Caldera collapse in the Galapagos Islands, 1968: The largest known collapse since 430
1912 followed a flank eruption and explosive volcanism within the caldera. Science 169, 429–437 (1970). 431
10. S. A. Fedotov, Y. K. Markhinin, The Great Tolbachik Fissure Eruption. Geological and Geophysical Data 432
1975-1976. (Cambridge University Press, Cambridge, 2011).
433
11. N. Geshi, T. Shimano, S. Chiba, Caldera collapse during the 2000 eruption of Miyakejima Volcano, Japan. 434
Bull. Volcanol. 64, 55-68 (2002).
435
12. T. Staudacher, V. Ferrazzini, A. Peltier, P. Kowalski, P. Boissier, P. Catherine, F. Lauret, F. Massin, The 436
April 2007 eruption and the Dolomieu crater collapse, two major events at Piton de la Fournaise (La 437
Réunion Island, Indian Ocean). J. Volcanol. Geotherm. Res. 184, 126-137 (2009). 438
13. E. P. Holohan, M. P. J. Schöpfer, J. J. Walsh, J. J. Stress evolution during caldera collapse. Earth Planet. 439
Sc. Lett. 421, 139-151 (2015). 440
14. K. V. Cashman, G. Giordano, Calderas and magma reservoirs. J. Volcanol. Geotherm. Res. 288, 28-45 441
(2014). 442
15. J. Battaglia, C. H. Thurber, J.-L. Got, C. A. Rowe, R A. White, Precise relocation of earthquakes following 443
the 15 June 1991 eruption of Mount Pinatubo (Philippines). J. Geophys. Res. 109, B7 (2004). 444
16. L. Michon, F. Massin, V. Famin, V. Ferrazzini, G. Roult, Basaltic calderas: Collapse dynamics, edifice 445
deformation, and variations of magma withdrawal. J. Geophys. Res. 116, B3 (2011). 446
17. H. Björnsson, P. Einarsson, Volcanoes beneath Vatnajökull, Iceland: evidence from radio-echo sounding, 447
earthquakes and jökulhlaups. Jokull 40, 147-148 (1990). 448
18. M. T. Gudmundsson, T. Högnadóttir, Volcanic systems and calderas in the Vatnajökull region, central 449
Iceland, constraints on crustal structure from gravity data. Journal of Geodynamics, 43, 153-169 (2007). 450
19. T. Thordarson, G. Larsen, Volcanism in Iceland in historical time: Volcano types, eruption styles and 451
eruption history. J. Geodyn. 43, 118-152 (2007). 452
20. F. Sigmundsson, A. Hooper, S. Hreinsdóttir, K. S. Vogfjörd, B. G. Ófeigsson, E. R. Heimisson, S. Dumont, 453
M. Parks, K. Spaans, G. B. Gudmundsson, V. Drouin, T. Árnadóttir, K. Jónsdóttir, M. T. Gudmundsson, T. 454
Högnadóttir, H. M. Fridriksdóttir, M. Hensch, P. Einarsson, E. Magnússon, S. Samsonov, B. Brandsdóttir, R. 455
S. White, T. Ágústsdóttir, T. Greenfield, R. G. Green, A. R. Hjartardóttir, R. Pedersen, R. A. Bennett, H. 456
Geirsson, P. C. La Femina, H. Björnsson, F. Pálsson, E. Sturkell, C. J. Bean, M. Möllhoff, A. K. Braiden, E. P. S. 457
Eibl, Segmented lateral dyke growth in a rifting event at Bárðarbunga volcanic system. Nature 517, 191-195 458
(2015). 459
21. T. Ágústsdóttir, J. Woods, T. Greenfield, R. G. Green, R. S. White, T. Winder, B. Brandsdóttir, S. 460
Steinthórsson, H. Soosalu, Strike-slip faulting during the 2014 Bárðarbunga-Holuhraun dike intrusion, 461
central Iceland. Geophys. Res. Lett. (accepted). DOI: 10.1002/2015GL067423 462
22. S. R. Gíslason, G. Stefánsdóttir, M. A. Pfeffer, S. Barsotti, Th. Jóhannsson, I. Galeczka, E. Bali, O. 463
Sigmarsson, A. Stefánsson, N. S. Keller, A. Sigurdsson, B. Bergsson, B. Galle, V. C. Jacobo, S. Arellano, A. 464
Aiuppa, E. S. Eiríksdóttir, S. Jakobsson, G. H. Gudfinnsson, S. A. Halldórsson, H. Gunnarsson, B. Haddadi, I. 465
Jónsdóttir, Th. Thordarson, M. Riishuus, Th. Högnadóttir, T. Dürig, G. B. M. Pedersen, A. Höskuldsson, M. T. 466
Gudmundsson, Environmental pressure from the 2014–15 eruption of Bárðarbunga volcano, Iceland. 467
Geochem. Perspect. Lett., 1, 84-93 (2015).
468
23. O. Roche, O., T. H. Druitt, Onset of caldera collapse during ignimbrite eruptions. Earth Planet. Sci. Lett., 469
191(3), 191-202 (2001). 470
24. Materials and methods are available as supplementary materials on Science Online.
471
25. J. Browning, A. Gudmundsson, Surface displacements resulting from magma-chamber roof subsidence, 472
with application to the 2014-2015 Bardarbunga-Holuhraun volcanotectonic episode in Iceland. J. Volcanol. 473
Geotherm. Res. 308, 82-98 (2015).
474
26. H. Björnsson, Hydrology of ice caps in volcanic regions. Soc. Sci. Isl. 45, 139pp (1988). 475
27. E. P. Holohan, V. R. Troll, B. Van Wyk de Vries, J. J. Walsh, T. R. Walter, Unzipping Long Valley: an 476
explanation for vent migration during an elliptical ring fracture eruption. Geology 36, 323-326 (2008). 477
28. E. P. Holohan, T. R. Walter, M.P. Schöpfer, J. J. Walsh, B. Wyk de Vries, V. R. Troll, Origins of oblique‐slip 478
faulting during caldera subsidence. J. Geophys. Res. 118(4), 1778-1794 (2013). 479
29. C. Clough, H. Maufe, E. Baley, The cauldron subsidence of Glen-Coe, and the associated igneous 480
phenomena. Q.J.Soc. Lond. 65, 611–678 (1909). 481
30. H. Bathke, M. Nikhoo, E.P. Holohan, T.R. Walter, Insights into the 3D architecture of an active caldera 482
ring-fault at Tendürek volcano through modeling of geodetic data. Earth. Planet. Sci. Lett. 422:157-168 483
(2015). 484
31. A. Fichtner, H. Tkalcic, Insights into the kinematics of a volcanic caldera drop: Probabilistic finite-source 485
inversion of the 1996 Bardarbunga, Iceland, earthquake. Earth Planet. Sc. Lett. 297, 607-615 (2010). 486
32. B. Riel, P. Milillo, M. Simons, P. Lundgren, H. Kanamori, H., S. Samsonov, The collapse of Bárðarbunga 487
Caldera, Iceland. Geophys. J. Int. 202, 446-453 (2015). 488
33. S. Cesca, A. T. Sen, T. Dahm, Seismicity monitoring by cluster analysis of moment tensors. Geophys. J. 489
Int. 196, 1813-1826 (2013).
490
34. A. Shuler, G. Ekström, M. Nettles, Physical mechanisms for vertical‐CLVD earthquakes at active 491
volcanoes. J. Geophys. Res. 118(4), 1569-1586 (2013). 492
35. K. Abe, Seismicity of the caldera-making eruption of Mount Katmai, Alaska in 1912. B. Seismol. Soc. Am. 493
82, 175-191 (1992). 494
36. C. P. Montagna, H. M. Gonnermann, Magma flow between summit and Pu`u `O`o at Kilauea Volcano, 495
Hawaii. Geochem. Geophy. Geosy. 14, 2232–2246 (2013). 496
37. H. Kumagai, T. Ohminato, M. Nakano, M. Ooi, A. Kubo, H. Inoue, J. Oikawa, Very-long-period seismic 497
signals and caldera formation at Miyake Island, Japan. Sci. 293, 687-690 (2001). 498
38. G. Wadge, Steady state volcanism: evidence from eruption histories of polygenetic volcanoes. 499
J. Geophys. Res. 87, B5: 4035-4049 (1982). 500
39. A. Geyer, A. Folch, J. Martí, Relationship between caldera collapse and magma chamber withdrawal: an 501
experimental approach. J Volcanol. Geotherm. Res. 157, 375-386 (2006). 502
40. A. Folch, J. Marti, Time-dependent chamber and vent conditions during explosive caldera-forming 503
eruptions. Earth Planet. Sc. Lett. 280, 246-253 (2009). 504
41. W. Hildreth, J. Fierstein, Katmai volcanic cluster and the great eruption of 1912. Geophys. J. Int. 112, 505
446-453 (2000). 506
42. B. C. Bautista, M. L. P. Bautista, R. S. Stein, E. S. Barcelona, R. S. Punongbayan, E. P. Laguerta, A. R. 507
Rasdas, G. Ambubuyog, E. Q. Amin, “Relationship of regional and local structures to Mount Pinatubo 508
activity” in Fire and Mud: Eruptions and Lahars of Mount Pinatubo, Philippines. PHIVOLCS, C. G. Newhall, R. 509
S. Punongbayan, Eds. (University of Washington Press, Quezon City, 1996), pp. 351-370. 510
43. J. Mori, R. A. White, D. H. Harlow, P. Okubo, J. A. Power, R. P. Hoblitt, E. P. Laguerta, A. Lanuza, B. C. 511
Bautista, “Volcanic earth quakes following the 1991 climactic eruption of Mount Pinatubo: strong seismicity 512
during a waning eruption” in Fire and Mud: Eruptions and Lahars of Mount Pinatubo, Philippines. PHIVOLCS. 513
C. G. Newhall, R. S. Punongbayan, Eds. (University of Washington Press, Quezon City, 1996), pp. 339-350. 514
44. L. Michon, T. Staudacher, V. Ferrazzini, P. Bachèlery, J. Marti, April 2007 collapse of Piton de la 515
Fournaise: a new example of caldera formation. Geophys. Res. Lett., 34(21) (2007). 516
45. F. R. Fontaine, G. Roult, L. Michon, G. Barruol, A. Di Muro, The 2007 eruptions and caldera collapse of 517
the Piton de la Fournaise volcano (La Reunion Island) from tilt analysis at a single very broadband seismic 518
station. Geophys. Res. Lett. 41, 2803-2811 (2014); published online EpubApr 28 (10.1002/2014GL059691). 519
46. A. Di Muro, N. Metrich, D. Vergani, M. Rosi, P. Armienti, T. Fougeroux, E. Deloule, I. Arienzo, L. Civetta, 520
The Shallow Plumbing System of Piton de la Fournaise Volcano (La R,union Island, Indian Ocean) Revealed 521
by the Major 2007 Caldera-Forming Eruption. J. Petrol. 55, 1287-1315 (2014); published online EpubJul 522
(10.1093/petrology/egu025). 523
47. T. Kaneko, A. Yasuda, T. Shimano, S. Nakada, T. Fujii, T. Kanazawa, A. Nishizawa, Y. Matsumoto, 524
Submarine flank eruption preceding caldera subsidence during the 2000 eruption of Miyakejima Volcano, 525
Japan. Bull. Volcanol. 67, 243-253 (2005); published online EpubMar (10.1007/s00445-004-0407-1). 526
48. M. Amma-Miyasaka, M. Nakagawa, S. Nakada, Magma plumbing system of the 2000 eruption of 527
Miyakejima Volcano, Japan. Bull. Volcanol. 67, 254-267 (2005); published online EpubMar 528
(10.1007/s00445-004-0408-0). 529
49. T. Nishimura, S. Ozawa, M. Murakami, T. Sagiya, T. Tada, M. Kaidzu, M. Ukawa, Crustal Deformation 530
caused by magma migration in the northern Izu Islands, Japan. Geophys. Res. Lett. 28, 3745-3748 (2001); 531
published online EpubOct 1 (Doi 10.1029/2001gl013051). 532
50. S. A. Fedotov, L. B. Slavina, S. L. Senyukov, M. S. Kuchay, Seismic processes and migration of magma 533
during the Great Tolbachik Fissure Eruption of 1975-1976 and Tolbachik Fissure Eruption of 2012-2013, 534
Kamchatka Peninsula. Izv. Atmos. Ocean Phy. 51, 667-687 (2015); published online EpubDec 535
(10.1134/S000143381507004x). 536
51. S. A. Fedotov, I. S. Utkin, L. I. Utkina, The Peripheral Magma Chamber of Ploskii Tolbachik, a Kamchatka 537
Basaltic Volcano: Activity, Location and Depth, Dimensions, and their Changes Based on Magma Discharge 538
Observations. J. Volcanol. Seismol. 5, 369-385 (2011); published online EpubDec 539
(10.1134/S0742046311060042). 540
52. P. Doubik, B. E. Hill, Magmatic and hydromagmatic conduit development during the 1975 Tolbachik 541
Eruption, Kamchatka, with implications for hazards assessment at Yucca Mountain, NV. J. Volcanol. 542
Geotherm. Res. 91, 43-64 (1999); published online EpubJul (Doi 10.1016/S0377-0273(99)00052-9).
543
53. S.A. Fedotov, A. M. Chirkov, N.A. Gusev,G. N. Kovalev, Y. B. Slezin, The large fissure eruption in the 544
region of Plosky Tolbachik volcano in Kamchatka, 1975–1976. Bull. Volcanol. 43, 47-60 (1980). 545
54. J. Filson, T. Simkin, L. K. Leu, Seismicity of a caldera collapse: Galapagos Islands 1968. J. Geophys. Res., 546
78(35), 8591-8622 (1973). 547
55. J. E. Hammer, M. J. Rutherford, W. Hildreth, Magma storage prior to the 1912 eruption at Novarupta, 548
Alaska. Contrib. Mineral. Petr. 144, 144-162 (2002); published online EpubNov (10.1007/s00410-002-0393-549
2). 550
56. M. J. Rutherford, J. D. Devine, in Fire and Mud: Eruptions and Lahars of Mount Pinatubo, Philippines C. 551
G. Newhall, R. S. Punongbayan, Eds. (Philippine Institute of Volcanology and Seismology & University of 552
Washington Press, Quezon City, Seattle & London, 1996), pp. 751–766. 553
57. H. Kanamori, J. Mori, E. Hauksson, T. H. Heaton, L. K. Hutton, L. M. Jones, Determination of earthquake 554
energy release and ML using TERRAscope. Bull. . Seismol. Soc. Am., 83(2), 330-346 (1993). 555
58. M. Kikuchi, Y. Yamanaka, K. Koketsu, Source Process of the Long-period Seismic Pulses Associated with 556
the 2000 Eruption of Miyakejima Volcano and its Implications. J. Geograph. Tokyo 110(2), 204-216 (2001). 557
59. M. T. Gudmundsson, T. Hognadottir, A. B. Kristinsson, S. Gudbjornsson, Geothermal activity in the 558
subglacial Katla caldera, Iceland 1999-2005, studied with radar altimetry. Ann. Glacio. 45, 66-72 (2007). 559
60. C. Mätzler, Microwave permittivity of dry snow. IEEE Trans. Geosci. Remote Sens. 34, 573-581 (1996). 560
61. C. Rossi, C. Minet, T. Fritz, M. Eineder, R. Bamler, Temporal monitoring of subglacial volcanoes with 561
TanDEM-X—Application to the 2014–2015 eruption within the Bárðarbunga volcanic system, Iceland. 562
Remote Sens. Environ. 181, 186-197 (2016) 563
62. T. Johannesson, H. Björnsson, E. Magnússon, S. Guðmundsson, F. Pálsson, O. Sigurðsson, T. 564
Thorsteinsson, E. Berthier, Ice-volume changes, bias estimation of mass-balance measurements and 565
changes in subglacial lakes derived by lidar mapping of the surface of Icelandic glaciers. Ann. Glacio. 54, 63-566
74 (2013). 567
63. E. Magnusson, F. Palsson, H. Bjornsson, S. Gudmundsson, Removing the ice cap of Oraefajokull central 568
volcano, SE-Iceland: Mapping and interpretation of bedrock topography, ice volumes, subglacial troughs 569
and implications for hazards assessments. Jokull 62, 131-150 (2012). 570
64. H. Bjornsson, F. Pálsson, M. T. Gudmundsson, Vatnajokull, Northwest Part, 1:100 000: Bedrock 571
topography, Landsvirkjun and Science Institute, University of Iceland, 1992.
572
65. A. H. Jarosch, Icetools: A full Stokes finite element model for glaciers. Comput. Geosci. 34, 1004-1014 573
(2008). 574
66. J. W. Glen, The Creep of Polycrystalline Ice. P. Roy. Soc. A-Math. Phy. 228, 519-538 (1955). 575
67. K. M. Cuffey, W. S. B. Paterson, The Physics of Glaciers. (Elsevier Butterworth-Heinemann, Burlington, 576
ed. 4, 2010). 577
68. C. E. Lesher, F. J. Spera, “Thermodynamic and Transport Properties of Silicate Melts and Magma“ in The 578
Encyclopedia of Volcanoes, H. Sigurdsson, B. Houghton, H. Rymer, Eds. (Academic Press, Academic Press,
579
Heidelberg, Amsterdam, Boston, ed. 2, 2015), pp. 113-141. 580
69. R. Bödvarsson, S. T. Rögnvaldsson, R. Slunga, E. Kjartansson, The SIL data acquisition system—at present 581
and beyond year 2000. Phys. Earth Planet. Inter. 113, 89-101 (1999). 582
70. R. Slunga, S. T. Rögnvaldsson, R. Bödvarsson, Absolute and relative locations of similar events with 583
application to microearthquakes in southern Iceland. Geophys. J. Int. 123, 409–419 (1995). 584
71. S. Th. Rögnvaldsson, R. Slunga, Routine fault plane solutions for local networks: a test with synthetic 585
data. Bull. Seism. Soc. Am. 83.4, 1232-1247 (1993). 586
72. R. Stefánsson, R. Böđvarsson, R. Slunga, P. Einarsson, S. Jakobsdóttir, H. Bungum, S. Gregersen, J. 587
Havskov, J. Hjelme, H. Korhonen, Earthquake prediction research in the South Iceland seismic zone and the 588
SIL project. Bull. Seism. Soc. Am. 83, 696–716 (1993). 589
73. S., A., R. Cesca, T. Dahm, Discrimination of induced seismicity by full moment tensor inversion and 590
decomposition. J. Seimsol. 17, 147-163 (2013). 591
74. P. A. Rosen, S. Hensley, I. R. Joughin, F. K. Li, S. N. Madsen, E. Rodriguez, R. M. Goldstein, Synthetic 592
aperture radar interferometry, presented at Proceedings of the IEEE, 2000 (unpublished). 593
75. B. Kampes, Delft Object-oriented Radar Interferometric Software: User’s Manual and Technical 594
Documentation v4.02, presented at Delft Technical University, 1999 (unpublished). 595
76. Y. Y. Kagan, 3-D rotation of double-couple earthquake sources. Geophys. J. Int. 106, 709–716 (1991). 596
77. R. M. Goldstein, C. L. Werner, Radar interferogram filtering for geophysical applications. Geophys. Res. 597
Lett. 25, 4035-4038 (1998).
598
78. C. W. Chen, H. A. Zebker, Two-dimensional phase unwrapping with use of statistical models for cost 599
functions in nonlinear optimization. J. Opt. Soc. Am. A Opt. Image. Sci. Vis. 18, 338-351 (2001). 600
79. Y. Okada, Internal deformation due to shear and tensile faults in a half-space. B. Seismol. Soc. Am. 82, 601
1018-1040 (1992). 602
80. A. Hooper, J. Pietrzak, W. Simons, H. Cui, R. Riva, M. Naeije, A. Terwisscha van Scheltinga, E. Schrama, G. 603
Stelling, A. Socquet, Importance of horizontal seafloor motion on tsunami height for the 2011 Mw=9.0 604
Tohoku-Oki earthquake. Earth Planet. Sc. Lett. 361, 469-479 (2013). 605
81. C. E. Ford, D. G. Russell, J. A. Craven, M. R. Fisk, Olivine-liquid equilibria: Temperature, pressure and 606
composition dependence of the crystal/liquid cation partition coefficients for Mg, Fe2+, Ca and Mn. J. 607
Petrol. 24, 256-266 (1983).
608
82. H. J. Yang, R. J. Kinzler, T. L. Grove, Experiments and models of anhydrous, basaltic olivine-plagioclase-609
augite saturated melts from 0.001 to 10 kbar. Contrib. Mineral. Petr. 124, 1-18 (1996). 610
83. G. H. Gudfinnsson, D. C. Presnall, A pressure-independent geothermometer for primitive mantle melts. 611
J. Geophys. Res. 106, B8 (2001).
612
84. K. D. Putirka, Thermometers and barometers for volcanic systems. Rev. Mineral. Geochem. 69, 61-120 613
(2008). 614
85. Y. Kawakami, J. Yamamoto, H. Kagi, Microraman densimeter for CO2 inclusions in mantle derived 615
minerals. Appl. Spectrosc. 57, 1333-1339 (2003). 616
86. M.R. Burton, P. Allard, F. Mure, A. La Spina, Magmatic gas composition reveals the 617
source depth of slug-driven Strombolian explosive activity, Science, 317, 5835, 227-230 (2007), 618
doi:10.1126/science.1141900. 619
620
87. A. Aiuppa, C. Federico, G. Giudice, S. Gurrieri, Chemical mapping of a fumarolic field: La Fossa Crater, 621
Vulcano Island (Aeolian Islands, Italy), Geophys. Res. Lett., 32 (13) (2005), p. L13309 622
http://dx.doi.org/10.1029/2005GL023207 623
88. P.-J. Gauthier, O. Sigmarsson, M. Gouhier, B. Haddadi, and S. Moune, Elevated gas flux and trace metal 624
degassing from the 2014–2015 fissure eruption at the Bárðarbunga volcanic system, Iceland, J. Geophys. 625
Res. Solid Earth, 121, (2016) doi:10.1002/2015JB012111.
626
89. E. Bali, O. Sigmarsson, S. Jakobsson, H. Gunnarsson, Volatile budget of the Nornahraun eruption in the 627
Bárðarbunga system, Iceland. Geophysical Research Abstracts Vol. 17, EGU2015-5757, 2015 EGU General 628
Assembly (2015). http://meetingorganizer.copernicus.org/EGU2015/EGU2015-5757.pdf 629
90. A. Burgisser, M. Alletti, B. Scaillet, Simulating the behavior of volatiles belonging to the C–O–H–S 630
system in silicate melts under magmatic conditions with the software D-Compress, Comput. Geosci., 79, 1– 631
14. 632
91. D. O. Potyondy, P. A. Cundall, A bonded particle model for rock. Int. J. Rock Mech. Min. 41, 1329-1364 633
(2004). 634
92. D. Mas Ivars, M. E. Pierce, C. Darcel, J. Reyes-Montes, D. O. Potyondy, R. P. Young, P. A. Cundall, The 635
synthetic rock mass approach for jointed rock mass modelling. Int. J. Rock Mech. Min. 48, 219-244 (2011). 636
93. Itasca Consulting Group, Inc. PFC2D - Particle Flow Code in Two-Dimensions, Ver. 5.0. Minneapolis, 637
Itasca (2014). 638
94. K. Mogi, Relations between the eruptions of various volcanoes and the deformations of the ground 639
surfaces around them. B. Earthq. Res. Inst. Univ. Tokyo 36, 99–134 (1958). 640
95. M. Ripepe, D. Delle Donne, R. Genco, G. Maggio, M. Pistolesi, E. Marchetti, G. Lacanna, G. U. P. Poggi, 641
Volcano seismicity and ground deformation unveil the gravity-driven magma discharge dynamics of a 642
volcanic eruption. Nat. Commun. 6 (2015). 643
96. Y. Bottinga, D. Weill, The viscosity of magmatic silicate liquids: a model for calculation. Am. J. Sci. 272, 644
438–475 (1972). 645