Publisher’s version / Version de l'éditeur:
Procedia Manufacturing, 10, pp. 720-729, 2017-07-07
READ THESE TERMS AND CONDITIONS CAREFULLY BEFORE USING THIS WEBSITE. https://nrc-publications.canada.ca/eng/copyright
Vous avez des questions? Nous pouvons vous aider. Pour communiquer directement avec un auteur, consultez la première page de la revue dans laquelle son article a été publié afin de trouver ses coordonnées. Si vous n’arrivez pas à les repérer, communiquez avec nous à PublicationsArchive-ArchivesPublications@nrc-cnrc.gc.ca.
Questions? Contact the NRC Publications Archive team at
PublicationsArchive-ArchivesPublications@nrc-cnrc.gc.ca. If you wish to email the authors directly, please see the first page of the publication for their contact information.
NRC Publications Archive
Archives des publications du CNRC
This publication could be one of several versions: author’s original, accepted manuscript or the publisher’s version. / La version de cette publication peut être l’une des suivantes : la version prépublication de l’auteur, la version acceptée du manuscrit ou la version de l’éditeur.
For the publisher’s version, please access the DOI link below./ Pour consulter la version de l’éditeur, utilisez le lien DOI ci-dessous.
https://doi.org/10.1016/j.promfg.2017.07.029
Access and use of this website and the material on it are subject to the Terms and Conditions set forth at
Experimental analysis of laser and scanner control parameters during
laser polishing of H13 steel
Miller, Joshua D.; Tutunea-Fatan, O. Remus; Bordatchev, Evgueni V.
https://publications-cnrc.canada.ca/fra/droits
L’accès à ce site Web et l’utilisation de son contenu sont assujettis aux conditions présentées dans le site LISEZ CES CONDITIONS ATTENTIVEMENT AVANT D’UTILISER CE SITE WEB.
NRC Publications Record / Notice d'Archives des publications de CNRC:
https://nrc-publications.canada.ca/eng/view/object/?id=bb23538d-f4e7-4174-81a8-4180409f0d2f https://publications-cnrc.canada.ca/fra/voir/objet/?id=bb23538d-f4e7-4174-81a8-4180409f0d2f
2351-9789 © 2017 Published by Elsevier B.V. This is an open access article under the CC BY-NC-ND license (http://creativecommons.org/licenses/by-nc-nd/4.0/).
Peer-review under responsibility of the organizing committee of the 45th SME North American Manufacturing Research Conference doi: 10.1016/j.promfg.2017.07.029
Procedia Manufacturing 10 ( 2017 ) 720 – 729 Available online at www.sciencedirect.com
ScienceDirect
45th SME North American Manufacturing Research Conference, NAMRC 45, LA, USA
Experimental Analysis of Laser and Scanner Control Parameters
During Laser Polishing of H13 Steel
Joshua D. Miller
a, O. Remus Tutunea-Fatan
a, and Evgueni V. Bordatchev
b*
a
Mechanical and Materials Engineering, Western University, London, Ontario, Canada
b
National Research Council of Canada, London, Ontario, Canada
Abstract
Laser polishing is a manufacturing process in which a small amount of material is melted via laser irradiation and molten pool is then redistributed to create a smoother surface finish/superior surface quality. The focus of this study is to generate more comprehensive understanding of the effects that laser and scanner control parameters have on the formation of laser polished lines. A parameter known as “Laser On/Off delay” is varied along with the laser power to study the impact that these parameters have on the synchronization between laser power and beam scanning velocity. It was determined through experimental analysis that the “Laser On delay” parameter plays a significant role on the formation of the laser polished lines, essentially in a region that is outside to the widely characterized “steady state” zone of constant track width. A set of experiments was conducted to identify the combined effect of transient (acceleration/deceleration) phases for laser power and speed on the terminal geometry of the polished line. When the optimal transient combination of power and speed was used, surface quality improvement by 83% (areal surface roughness (Sa) reduction from 1.35 µm to 0.23 µm) was obtained.
© 2017 The Authors. Published by Elsevier B.V.
Peer-review under responsibility of the Scientific Committee of NAMRI/SME.
Keywords: laser polishing; line formation; surface quality; laser-on-delay; synchronization control
1. Introduction
The laser polishing of tool steels and metals in general have been around the manufacturing industry for more than a decade and a half. However, most of the knowledge of polishing processes is based around manual polishing
* Corresponding author. Tel.: +1-519-430-7107; fax: +1-519-430-7064.
E-mail address: evgueni.bordatchev@nrc-cnrc.gc.ca
© 2017 Published by Elsevier B.V. This is an open access article under the CC BY-NC-ND license (http://creativecommons.org/licenses/by-nc-nd/4.0/).
processes which are very time consuming and often require skilled workers to complete [1-3]. This is why, in recent years, laser polishing (LP) has become more widely used due to the ability to quickly and efficiently polish surfaces. Laser polishing is the process of using laser radiation to melt a very small layer of material creating a small molten pool which uses the physics of surface tension to evenly distribute the recently melted material across the surface and thus creating a much smoother surface finish [4].
Due to the fact that LP process is fairly new in comparison to many of the conventional processes used in the manufacturing industry, many aspects of the research surrounding the topic remain focused on process optimization. Often, when experimenting with the optimization of laser polishing parameters (power, scanning speed, focal offset, etc.), a so-called “line test method” is implemented. The line test method consists of producing a series of lines independent of one another, each with varying laser polishing process parameters [5-7]. This method creates a quick and extensive amount of data which can be, and often is, used to determine the parameters which will produce the best or required surface quality.
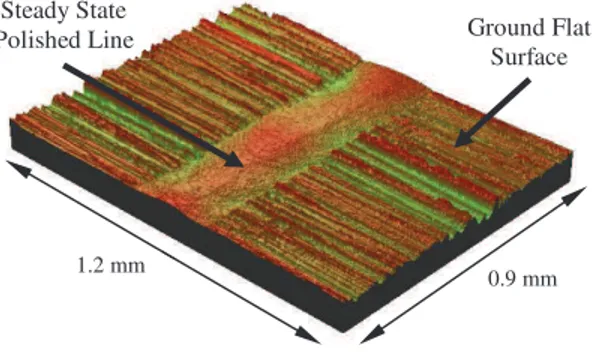
Fig 1: The topography of the steady state zone for a representative laser polished line
During the analysis portion of the line test experimentation, many researchers focus solely on the steady state zone of the laser polished line that is essentially characterized by a constant track width. As also suggested by Figure 1, the common steady state analysis generally precludes the inclusion of the transient ends of the polished line [7-9]. However, when conducting a set of line polishing experiments, it was noticed that, depending on the process parameters, the ends of the polished lines had geometric characteristics that were different from those of the steady state.
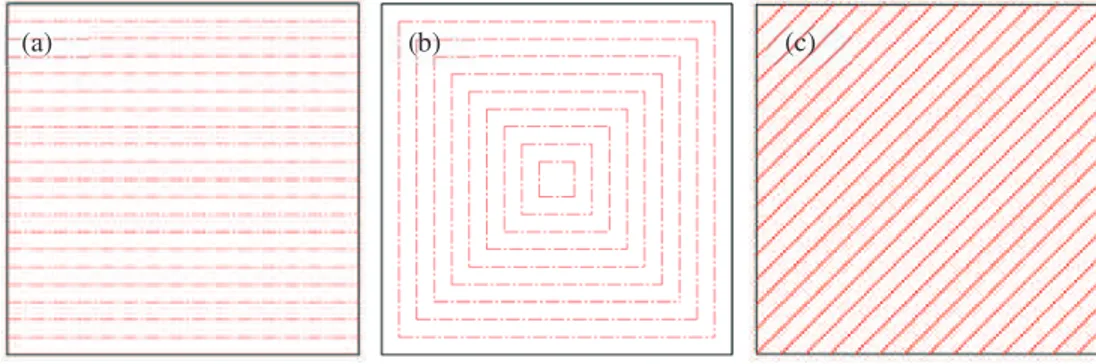
The slight alterations between the transient stage zone of the LPed line and the steady state zone may seem insignificant when considering a line test method experiment, but when placed into real world applications, the difference between the state zones may cause a decrease in the efficiency of the LP process because in most cases, the initial/final segments of the line also belong to the broader polished area. Typically, an industrial LP application will involve a requirement to polish an entire area on the surface of the product. Area laser polishing, however, simply consists of overlapping single LPed lines to cover the required area. There are many strategies for surface polishing, some of which are shown in Figure 2, many of which are similar to conventional pocket machining strategies [10, 11]. The linear method involves horizontal (or vertical) lines overlapping and can consist of all the lines being formed in the same way (ex. left to right) or altering directions. The inside-out (or outside-in) method consists of squares which get gradually larger (or smaller) and overlap until the area is filled. Finally, the diagonal method, although self-explanatory, consists of overlapping diagonal lines which, again, can all go in the same direction or altering directions each LPed line.
Although all of these methods differ from one another, they all have a common aspect which is that the beginning/ends of each line produced interacts with the beginning/end of the previous line that was made in the process. This means that if the transient stages of each line (e.g. acceleration and deceleration) in the area polishing process are not formed as expected, then the overall efficiency of the LP process will be decreased.
Thus, the focus of this study will be to generate more comprehensive understanding of the transient stages of a laser polished line formation. To achieve this, experiments will be conducted using the line test method with varying laser and scanner control parameters and the results will be analyzed for discrepancies in the transient state zones of the lines. 1.2 mm 0.9 mm Ground Flat Surface Steady State Polished Line
722 Joshua D. Miller et al. / Procedia Manufacturing 10 ( 2017 ) 720 – 729
Fig 2: Conventional area polishing strategies: (a) zigzag/lace (b) spiral (c) diagonal
2. Experiment methodology and initial observations
A typical laser polished line consists of three primary sections (zones): the initial transient section (e.g. acceleration) in which the laser is powered on and the laser beam begins to move; the steady state section in which the laser power and speed have reached a continuous state; and the final transient section (e.g. deceleration) in which the beam stops its movement and the laser is powered off. Now, the steady state section of the laser polished line is fairly straight forward, as only the laser parameters (power, scanning speed, focal offset, etc.) have an effect on the width of the LPed line. However, the initial and final transient state zones introduce additional factors which are introduced via scanner control factors. Although some LP systems use motion stages to move the workpiece, the LP system used in the present work utilizes a laser scan head to control the laser beam movement onto a stationary workpiece. The use of similar scan heads has been used in comparable experimental studies [12]. The laser scanner has a system of mirrors which pivot very rapidly to position the laser beam onto the workpiece.
While much faster than the electromechanical motion stages, positioning mirrors cannot move instantaneously and thereby additional factors must be introduced to compensate for the time required for the mirrors to accelerate and decelerate at the beginning and end of a line respectively. These factors are known as “Laser On delay” and “Laser Off delay”. According to the software manual for the scanner control, the Laser On delay is used to allow the beam control mirrors to accelerate properly before the laser is turned on and the Laser Off delay is used to ensure that the laser beam reached the final point in the line before the laser is turned off. These new factors introduce the ability to create synchronous movement between the beam position via the mirrors (i.e. beam velocity) and the laser power. These scanner control factors in combination with the standard laser parameters can heavily effect the formation of a laser polished line.
For the sake of simplicity, the Laser On and Laser Off delay values were kept the same in each line formation scenario and thus it was assumed that the initial states and the final states of each line behave in similar fashions to depict the presumed outcomes. With this in mind, there are three possible line formation scenarios that were identified during line test experiments:
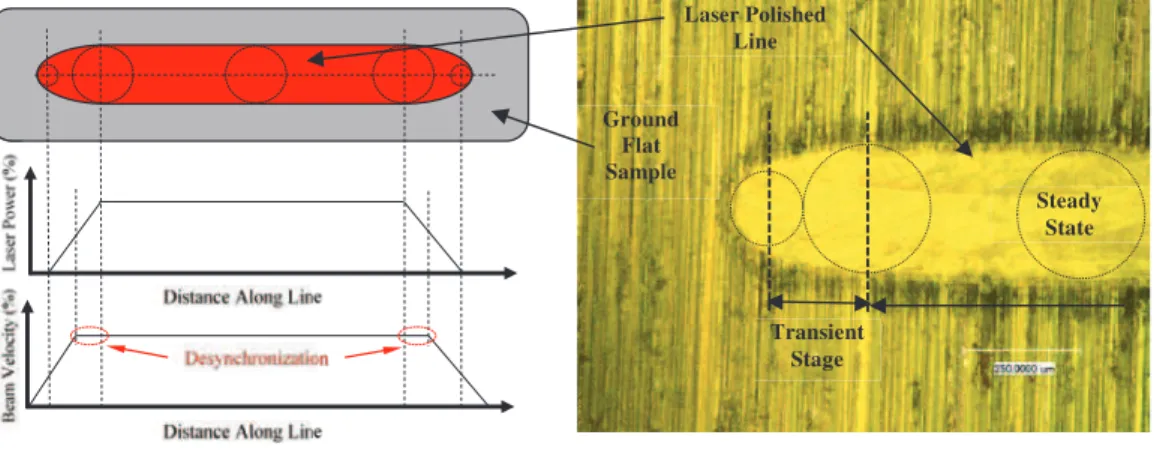
x Case 1: laser speed gradient “ahead of” laser power gradient (Figure 3). In this case, the transient state zone of the laser polished line has a smaller track width than that of the steady state zone width of the line. The width of the track in the transient state starts rather small and gradually grows as the line continues until the steady state width is reached. This shows a desynchronization between the laser power and the laser velocity, meaning that the laser beam begins to travel prior to the laser beam reaching full power.
Fig 3: Terminal geometry of a line generated under Case 1 conditions
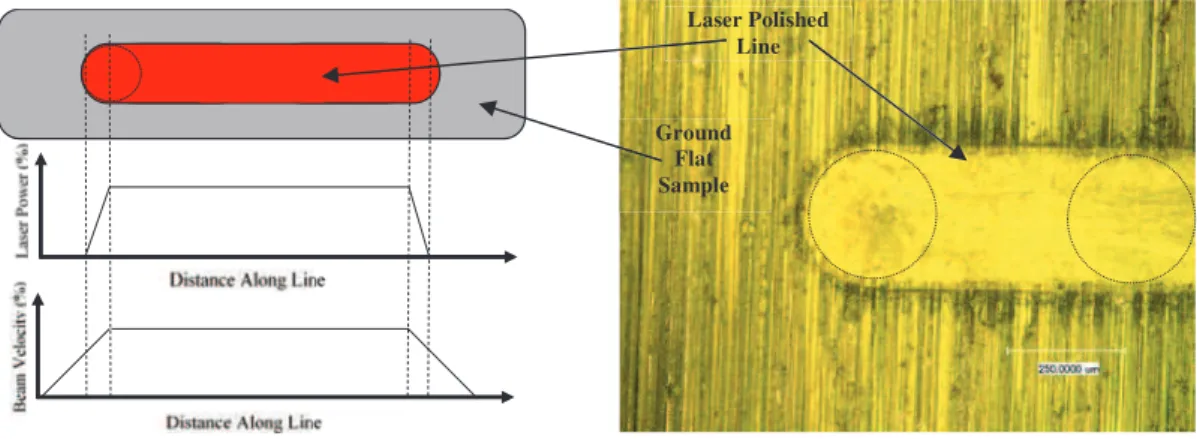
x Case 2: laser power gradient “ahead of” laser speed gradient (Figure 4). In this case, transient states have a larger track width than that of the steady state track. In this case, the initial state has a large diameter, almost circle shaped track which gradually decreases in size until reaching the steady state track width. Again, this shows an obvious desynchronization between power and velocity of the beam. In this case however, the laser power has reached peak power before the laser beam begins to move.
Fig 4: Terminal geometry of a line generated under Case 2 conditions
x Case 3: laser speed gradient “in sync with” laser power gradient (Figure 5). This particular case would be the ideal scenario for any line formation in laser polishing. The transient states of the line have almost the same track width as the steady state portion of the line. In this case, the laser power and the laser velocity would be synchronized such that the laser beam begins to move just as the beam reaches peak power. This is the ideal scenario as it would lead to the shortest attainable distance for a line to reach the desired steady state conditions. However, finding the combination of laser power, speed and laser delays capable to generate this particular geometry of the line end might not be always obvious.
Transient Stage Steady State Ground Flat Sample Laser Polished Line Transient Stage Steady State Ground Flat Sample Laser Polished Line
724 Joshua D. Miller et al. / Procedia Manufacturing 10 ( 2017 ) 720 – 729
Fig 5: Terminal geometry of a line generated under Case 3 conditions
Of note, the relatively vague/presently undefined terms used (i.e., “ahead of”, “in sync with”) should not be misinterpreted as simple inequalities/equalities. In reality, the relative relationship/balance between power and speed (as analyzed in the context of terminal line geometry) is more complex than a simple “greater than” or “equal” sign. However, for the lack of a better term, this somewhat imprecise terminology was used at this time.
Therefore, by means of experimentation, the above listed cases will be produced via the line test method and analyzed such that a broader understanding of the development of these cases can be achieved. Like many other manufacturing processes, the success of LP is determined by a number of process parameters. However, to limit the number of variables in the study, an initial set of experiments was conducted while keeping some of the laser parameters constant. The constant process parameters are identified in Table 1 below.
Table 1: Constant laser polishing parameters
Factor Name Constant Value Focal distance 100 mm Focal offset 0.0 mm Laser velocity 100 mm/s Argon flow 50 cfh
Laser operating mode continuous wave (CW)
By keeping these parameters constant, several polished lines were generated by varying laser power as well as Laser On/Off delay parameters (Table 2).
Table 2: Experimental design of the line polishing experiments
Line number 1 2 3 4 5 6 7 8 9 10 11 12 13 14 15
Laser power (W) 50 100 150
Laser On/Off delay (µs) 0 10 50 250 500 0 10 50 250 500 0 10 50 250 500
3. Experimental setup
The experimental setup used for testing (Figure 6) consists of the following components:
(a) Computer responsible for control of the laser scan head. This computer uses ScanLab’s LaserDESK software to program the movement of the laser beam during experimentation. The software used here is where the scanner control parameters (laser on/off delay, etc.) are changed.
Ground Flat Sample
Laser Polished Line
(b) Computer responsible for the control of the X-Y-Z motion control (Aerotech stage). NView motion control software is used here to position the scan head at the appropriate Z-direction height from the sample such that the laser is at its focal point. The X-Y movement are controlled here to roughly position the sample in the correct location.
(c) Laser generator system encompassing an IPG Photonics YLR-500 model laser. The laser being used has a wavelength of 1070 nm and a maximum power of 500 W. The laser is delivered to the system via an IPG Photonics fiber cable.
(d) Bender of 1.5” diameter beam used to direct the laser beam from the fiber optic into the scanner head. (e) Laser scan head relying on a system of mirrors to quickly manipulate the position of the laser beam. The
working area for this particular scan head is 33 mm x 33 mm. There is an air-cooling system in place to keep the scan head from overheating.
(f) Lens of 100 mm objective used to focus the laser beam onto the sample workpiece.
(g) Argon gas enclosure consisting of a manufactured acrylic box that is used at the base of the enclosure to secure the enclosure to the motion control system. A plastic sheet is then secured from the exterior of the objective lens to the base of the enclosure box. This sheet allows free motion in the X-Y-Z direction yet still contains the gas being delivered into the system.
(h) Workpiece of a round disk shape made of ground flat H13 tool steel (20 mm thickness). (i) Aerotech PRO280LM motion control system controlled by the NView software. (j) Central gas tank system in charge with the argon supply.
Fig 6: Overview of the system used to be perform line polishing experiments
4. Results and discussion
Upon completion of the experiments, it was evident that the tests performed whilst using a laser power of 50 W did not affect the H13 steel enough to create conclusive or useful information for analysis. This can be seen in Figure 7, where the left most set of lines are performed at 50 W power. Therefore, the analysis of the experiments will focus solely on lines 6-15 as listed in Table 2.
726 Joshua D. Miller et al. / Procedia Manufacturing 10 ( 2017 ) 720 – 729
Fig 7: Macroscopic view of the line polishing experiments
4.1. Effect of laser on delay on track width
Focusing first on the effects of laser on delay on the initial transient stage zone of the laser polished line, it is evident that the variation in delay does in fact have an impact on the formation of the track shape. The results of the varying laser delays can be seen in Figure 8 and Figure 9 for laser powers of 100 W and 150 W, respectively.
Fig 8: Effect of laser on delay on track width at 100 W laser power
Fig 9: Effect of laser on delay on track width at 150 W laser power
-150 -100 -50 0 50 100 150 0 50 100 150 200 250 T r ac k W idt h (µ m ) Length (µm)
Line 6: Delay = 0 us Line 7: Delay = 10 us Line 8: Delay = 50 us Line 9: Delay = 250 us Line 10: Delay = 500 us -200 -150 -100 -50 0 50 100 150 200 0 50 100 150 200 250 300 350 400 T r ac k W idt h (µ m ) Length (µm)
Line 11: Delay = 0 us Line 12: Delay = 10 us Line 13: Delay = 50 us Line 14: Delay = 250 us Line 15: Delay = 500 us
As expected, laser on delay values have triggered a variable desynchronization between laser power and laser velocity gradients. In both test scenarios, the lines executed with laser on delay of 0 and 10 µs clearly resemble Case 1 scenario described in Section 2. As discussed, in this case laser beam begins to move along the line trajectory prior to having the laser power reach its maximum value. At the other end of the spectrum, experiments ran with 500 µs delays fall under Case 2 scenario category. In this case, laser power rises ahead of the actual start of beam motion, such that too much power was delivered to the sample. Although the experiments ran at 250 µs laser on delay are somewhat closer to the ideal Case 3 scenario, certain characteristics of Case 2 are still present. Overall, it seems to be that the lines generated with a 50 µs laser on delay exhibit most of the characteristics of the ideal Case 3 situation.
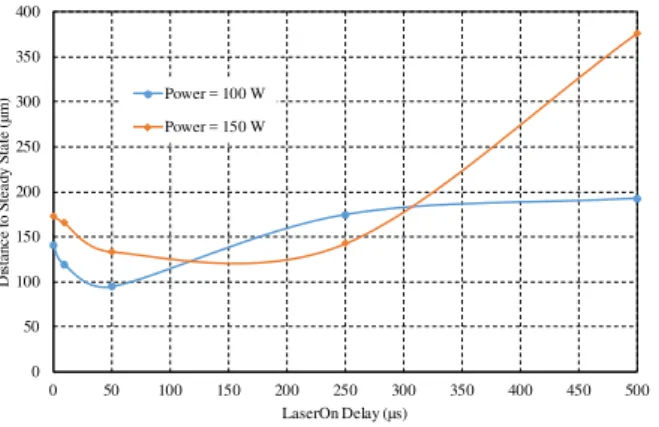
One other important outcome of the line formation results is related to the distance required by the LP lines to reach the steady state (Figure 10). Similar to prior comments, polished lines generated with 50 µs laser on delay require the lowest distance to reach their steady state. While it was expected that the time to reach steady state for 150 W will be larger than that for 100 W lines, this was not the case between approximately 120 µs and 300 µs.
Fig 10: Dependence between the length of the transient state and laser on delay duration
4.2. Effect of laser on delay on the topography of the transient zone
One experimental aspect that was not analyzed so far was the effect of Laser On/Off delay on the topography/geometry of the transient zone. After a closer examination of the ends of the polished lines, it became clear that a certain correlation exists between the Laser On delay duration and the transient molten pool characteristics (Figure 11).
For lines with lower laser on delays (L6, L7, L8), molten pool seems to accumulate slowly until reaching steady state conditions. By contrast, the lines associated with larger laser on delays (L9, L10) exhibit the characteristics of a “bubbling” molten pool immediately the initial spot of the laser and in turn, this would mean that energy buildup has happened faster in these cases. As such, when Laser On delay is larger and the motion is relatively slow, molten pool will end up being larger in the transient stage zone, and thus - as the beam advances – molten pool will tend to follow, as if being “pushed” by the trailing laser spot.
0 50 100 150 200 250 300 350 400 0 50 100 150 200 250 300 350 400 450 500 D is tan ce t o S tead y S tat e ( µ m ) LaserOn Delay (µs) Power = 100 W Power = 150 W
728 Joshua D. Miller et al. / Procedia Manufacturing 10 ( 2017 ) 720 – 729
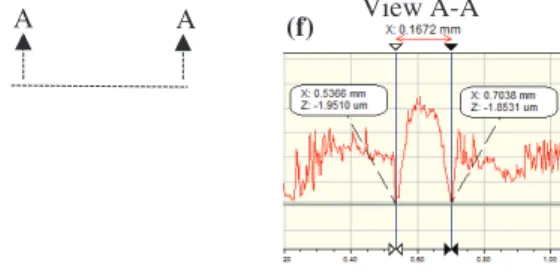
Fig 11: Topography of the transient zones for: (a) line 6, (b) line 7, (c) line 8, (d) line 9, and (e) line 10; and (f) a typical example of cross-section measurement for steady-state zone
When power is increased to 150 W, similar trends are present (Figure 12). However, a certain difference is visible for the initial spot that starts to exhibit certain “cratering” characteristics. The cratering effect generates a molten pool that is larger than required that tends to spread coaxially prior to starting to “move” along with the laser beam. Same as for 100 W, the “bubbling” effect manifests earlier for larger laser on delays.
Fig 12: Topography of the transient zone for: (a) line 11, (b) line 12, (c) line 13, (d) line 14, and (e) line 15; and (f) a typical example of cross-section measurement for steady-state zone
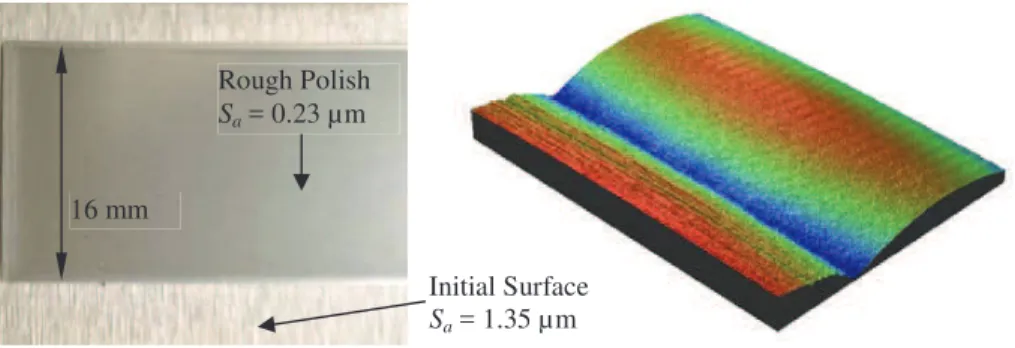
To portray the effects that the transient stages of line formation have on area polishing, a rough polishing experiment was conducted using a continuous wave laser with a 95%-line overlap. The area polishing strategy that was used was the zigzag/alternating line method (Figure 2). The laser polishing process was able to achieve a surface roughness reduction of 83%, resulting in the areal surface roughness dropping from its initial post-grinding
(d) (e) A A View A-A V (f) A A View A-A (f) (a) (b) (d) (e) (c)
Sa= 1.35 µm to a final post-polished value of Sa= 0.23 µm. However, these values are recorded at the steady state
area of the sample. Figure 13 shows that in this experiment the chosen process parameters have yielded a “trenching” effect in line cross over regions.
Fig 13: Laser polished sample exhibiting an improved areal surface roughness
5. Conclusion
The focus of this study was to investigate the phenomena occurring during the initial transient state of a polished line as a result of the interplay between laser and scanner control parameters, specifically in the form of delays. The main conclusion to be drawn from this study is that both laser and speed On/Off delays play a significant role on both the terminal geometry of the laser polished track and the formation/motion of the molten pool along the laser polished line.
Future research will attempt to investigate further the thermo-physical mechanisms associated with the transient phases of the LP process as well as to determine the optimal combinations of delays that will ensure the fastest reach of the steady state regime.
References
[1] Kumstel, J. and Kirsch, B., 2013. Polishing titanium- and nickel-based alloys using cw-laser radiation. Lasers in Manufacturing (LIM 2013), 41, pp. 355-364.
[2] Perry, T.L., Werschmoeller, D., Duffie, N.A., Li, X.C., and Pfefferkorn, F.E., 2009. Examination of selective pulsed laser micropolishing on microfabricated nickel samples using spatial frequency Analysis. Journal of Manufacturing Science and Engineering - Transactions of the
ASME, 131(2).
[3] Temmler, A., Willenborg, E., and Wissenbach, K., 2011. Design surfaces by laser remelting. Lasers in Manufacturing 2011: Proceedings of
the Sixth International Wlt Conference on Lasers in Manufacturing, Vol 12, Pt A, 12, pp. 419-430.
[4] Bordatchev, E.V., Hafiz, A.M.K., and Tutunea-Fatan, O.R., 2014. Performance of laser polishing in finishing of metallic surfaces.
International Journal of Advanced Manufacturing Technology, 73(1-4), pp. 35-52.
[5] Krauss, H. and Zaeh, M.F., 2013. Investigations on manufacturability and process reliability of selective laser melting. Lasers in
Manufacturing (LIM 2013), 41, pp. 808-815.
[6] Vadali, M., Ma, C., Duffle, N.A., Li, X.C., and Pfefferkorn, F.E., 2011. Pulsed laser micro polishing: An analytical method for predicting surface finish. Proceedings of the ASME International Manufacturing Science and Engineering Conference 2011, Vol 2, pp. 409-417. [7] Ukar, E., Lamikiz, A., de Lacalle, L.N.L., del Pozo, D., and Arana, J.L., 2010. Laser polishing of tool steel with CO2 laser and high-power
diode laser. International Journal of Machine Tools & Manufacture, 50(1), pp. 115-125.
[8] Chow, M.T.C., Bordatchev, E.V., and Knopf, G.K., 2013. Experimental study on the effect of varying focal offset distance on laser micropolished surfaces. International Journal of Advanced Manufacturing Technology, 67(9-12), pp. 2607-2617.
[9] Hafiz, A.M.K., Bordatchev, E.V., and Tutunea-Fatan, R.O., 2014. Experimental analysis of applicability of a picosecond laser for micro-polishing of micromilled Inconel 718 superalloy. International Journal of Advanced Manufacturing Technology, 70(9-12), pp. 1963-1978. [10] Dorado-Vicente, R., Romero-Carrillo, P., Lopez-Garcia, R., and Diaz-Garrido, F.A., 2013. Comparing planar pocketing tool paths via
acceleration measurement. Manufacturing Engineering Society International Conference, (MESIC 2013), 63, pp. 270-277.
[11] Giorleo, L., Ceretti, E., and Giardini, C., 2015. Ti surface laser polishing: Effect of laser path and assist gas. Procedia CIRP, 33, pp. 446-451. [12] Ukar, E., Lamikiz, A., Martinez, S., Estalayo, F., and Tabernero, I., 2013. Laser polishing of GGG70L cast iron with 2D scan-head.
Manufacturing Engineering Society International Conference, (MESIC 2013), 63, pp. 53-59.
Rough Polish
Sa= 0.23 µm
Initial Surface
Sa= 1.35 µm