arXiv:1305.0125v1 [hep-ex] 1 May 2013
EUROPEAN ORGANISATION FOR NUCLEAR RESEARCH (CERN)
CERN-PH-EP-2012-296
Submitted to: PRD
Search for resonant diboson production in the
W W/W Z → ℓνjj
decay channels with the ATLAS detector
at
√
s = 7 TeV
The ATLAS Collaboration
Abstract
A search for resonant diboson production using a data sample corresponding to
4.7
fb
−1of
in-tegrated luminosity collected by the ATLAS experiment at the Large Hadron Collider in
pp
collisions
at
√
s = 7 TeV
is presented. The search for a narrow resonance in the
W W
or
W Z
mass
distribu-tion is conducted in a final state with an electron or a muon, missing transverse momentum and at
least two jets. No significant excess is observed and limits are set using three benchmark models:
W W
resonance masses below 940
GeV
and 710
GeV
are excluded at
95%
confidence level for spin-2
Randall–Sundrum and bulk Randall–Sundrum gravitons, respectively;
W Z
resonance masses below
950
GeV
are excluded at
95%
confidence level for a spin-1 Extended Gauge Model
W
′boson.
Search for resonant diboson production in the
W W/W Z → ℓνjj decay channels
with the ATLAS detector at
√
s = 7 TeV
The ATLAS Collaboration
(Dated: June 21, 2018)
A search for resonant diboson production using a data sample corresponding to 4.7 fb−1 of inte-grated luminosity collected by the ATLAS experiment at the Large Hadron Collider in pp collisions at√s = 7 TeV is presented. The search for a narrow resonance in the W W or W Z mass distribu-tion is conducted in a final state with an electron or a muon, missing transverse momentum and at least two jets. No significant excess is observed and limits are set using three benchmark models: W W resonance masses below 940 GeV and 710 GeV are excluded at 95% confidence level for spin-2 Randall–Sundrum and bulk Randall–Sundrum gravitons, respectively; W Z resonance masses below 950 GeV are excluded at 95% confidence level for a spin-1 Extended Gauge Model W′boson.
PACS numbers: 12.60.Nz, 12.60.Cn
I. INTRODUCTION
Many extensions to the Standard Model (SM) predict new massive particles that can decay to W W , W Z or ZZ final states [1–3]. In some extensions, the branching ratios of the new particles to these diboson final states greatly exceed their branching ratios to light fermions or photons [4–6]. An analysis of W W , W Z and ZZ events is therefore a central element in the search for physics beyond the SM.
This article describes a search for a narrow resonance decaying to either a W W or W Z diboson intermediate state with subsequent decays to an ℓνjj final state, i.e. a charged lepton (electron or muon), large missing trans-verse momentum (Emiss
T ) and at least two jets. Data
cor-responding to 4.7 fb−1 collected by the ATLAS
experi-ment at the Large Hadron Collider (LHC) in pp collisions at √s = 7 TeV are used. The search is complementary to other direct searches by the ATLAS Collaboration for a W W or W Z resonance using events from the ℓνℓν [7] or ℓνℓℓ [8] final state and has the additional advantage of the hadronically decaying W or Z boson in the final state, which leads to a higher branching ratio. Also, the ℓνjj final state allows the reconstruction of the invari-ant mass of the system, under certain assumptions for neutrino momentum from a W boson decay. Such a re-construction is not possible in the ℓνℓν final state due to the presence of two neutrinos in each event. A sepa-rate search for a ZZ resonance has been performed using events with a ℓℓℓℓ or ℓℓjj final state at√s = 7 TeV [9].
Three benchmark signal models are used to interpret the ℓνjj results. A spin-2 Randall–Sundrum graviton (G∗) is used to model a narrow resonance decaying to
W W in two distinct warped extra-dimension models: the original Randall–Sundrum (RS) model [1] (commonly called RS1) and the bulk RS model [10] which allows all SM particles to propagate into the extra dimension. The W Z resonance is modeled by a Sequential Stan-dard Model (SSM) W′ boson with the W′W Z coupling
strength set by the Extended Gauge Model (EGM) [11].
In the EGM model, the W′W Z coupling is equal to
the SM W W Z coupling strength scaled by a factor cEGM × (mW/mW′)2, producing a partial width
pro-portional to mW′. In the nominal EGM, the coupling
strength scaling factor cEGM is set to one. However, this
analysis derives exclusion limits for a range of values of this parameter as a function of the invariant mass of the ℓνjj system. This particle is referred to as the EGM W′ boson below.
Gauge Model (EGM) [11]. In the EGM model, the W′W Z coupling is equal to the SM W W Z coupling
strength scaled by a factor cEGM × (mW/mW′)2 with
cEGMset to 1, thereby producing a partial width
propor-tional to mW′. This particle is referred to as the EGM
W′ boson throughout the text.
The aforementioned direct W W resonance search by the ATLAS Collaboration using ℓνℓν final-state events in 4.7 fb−1 pp collision data at √s = 7 TeV excludes
an RS1 graviton with mass less than 1.23 TeV and a bulk RS graviton with mass below 840 GeV [7]. Previous searches for a W W resonance by the D0 Collaboration in Run II at the Tevatron exclude an RS1 graviton with mass less than 760 GeV [12]. Similar searches, mentioned above, for a ZZ resonance by the ATLAS Collaboration exclude an RS1 graviton with mass below 845 GeV [9]. The CMS Collaboration reports a ZZ resonance search in the ℓℓjj final state and excludes an RS1 graviton with mass below 945 TeV [13]. Previous direct searches for a W Z resonance at √s = 7 TeV by the ATLAS and CMS Collaborations exclude the EGM W′ benchmark
with mass below 760 GeV [8] and 1143 GeV [14], respec-tively.
II. THE ATLAS DETECTOR
ATLAS [15] is a general-purpose particle detector used to investigate a broad range of different physics processes. Its cylindrical construction is forward-backward symmet-ric and provides nearly complete hermeticity. The
de-tector is composed of three main subsystems: the in-ner detector, the calorimeter system and the muon spec-trometer. The inner detector (ID) is used for tracking and measuring the momentum of charged particles within the pseudorapidity range |η| < 2.5 [16] and is composed of a silicon pixel detector, a silicon microstrip detector and, for |η| < 2.0, a transition radiation tracker. A uni-form 2 T magnetic field is provided by a superconduct-ing solenoid surroundsuperconduct-ing the ID. The calorimeter sys-tem forms the next layer of the detector, spanning the region |η| < 4.9 and providing three-dimensional recon-struction of particle showers. The inner calorimeter is a high-granularity lead–liquid-argon (LAr) electromag-netic (EM) sampling calorimeter covering |η| < 3.2. Sur-rounding the EM calorimeter is an iron–scintillator-tile sampling calorimeter providing hadronic coverage in the range |η| < 1.7, extended to |η| < 3.2 with copper– LAr technology. The EM and hadronic calorimeters both have LAr-based forward detectors reaching up to |η| = 4.9. Outside the calorimeters, the muon spectrom-eter (MS) is used to identify muons and measure their momenta. The MS is composed of three large air-core superconducting toroid systems (one barrel and two end-caps) each with eight azimuthally symmetric supercon-ducting coils. Three layers of precision tracking bers, consisting of drift tubes and cathode strip cham-bers, allow muon track reconstruction for |η| < 2.7, and fast resistive plate and thin-gap trigger chambers provide trigger signals in the region |η| < 2.4.
The ATLAS detector uses a three-level trigger system to select events for offline analysis. For this search, events are required to have at least one lepton satisfying trigger requirements, the details of which are presented in section IV.
III. MONTE CARLO SIMULATION
Monte Carlo (MC) simulations are used to model the benchmark signal samples and most SM background pro-cesses. The RS1 G∗ and EGM W′ boson production
and decay are simulated using pythia 6.4 [17] with the modified leading-order (LO∗) parton distribution
func-tion (PDF) set MRST2007LO* [18]. RS1 G∗ samples
are generated for resonance masses between 500 GeV and 1500 GeV in 250 GeV steps. In these samples the warp-ing parameter, ˜k ≡ k/MPl, is set to 0.1, where MPl =
MPl/
√
8π is the reduced Plank mass. EGM W′ samples
are generated with resonance masses from 500 GeV to 1500 GeV in 100 GeV steps, and the production cross-sections are calculated at next-to-next-to-leading order (NNLO) in αS using zwprod [19]. The EGM coupling
strength scaling factor cEGMis set to 1.0 in these samples,
which produces a resonance width of 0.032 × mW′ GeV.
The bulk RS model is implemented in calchep [20], allowing simulation of the 2 → 4 production and decay
TABLE I: Production cross-sections times branching ratios for G∗
→ W W or W′
→ W Z for the RS1 G∗, bulk RS G∗, and the EGM W′, for resonance masses equal to 500 GeV, 1000 GeV, and 1500 GeV. All cross-sections are given in pi-cobarns. RS1 G∗ Bulk RS G∗ EGM W′ Mass [GeV] σ × BR [pb] 500 13.0 3.0 2.6 1000 0.23 0.023 0.10 1500 0.017 0.0011 0.011
of the graviton with transfer of spin information to the final-state particles. The CTEQ6L LO PDF set [21] is used for these events. Because the bulk RS G∗
gravi-ton has negligible coupling to light fermions, only gluonic initial states are considered. These events are processed with pythia to simulate the parton shower, hadroniza-tion and underlying event. Samples are generated with ˜
k of 1.0 and resonance masses from 500 GeV to 1500 GeV in 100 GeV steps, with cross-sections taken from the calchepcalculation. For three representative resonance masses, the production cross-sections times branching ra-tios to W W/W Z for each sample are given in Table I.
Templates with 50 GeV spacing in the mass of the ℓνjj system, mℓνjj, are constructed to ensure a signal
prediction if no signal MC sample is generated at that mass. These templates are created by first fitting the fully simulated mℓνjj distribution with a Crystal Ball
function [22]. The shape parameters from these fits are interpolated across the mass range 500–1500 GeV and used to construct Crystal Ball functions, the signal tem-plates, at the intermediate mass points. The acceptances for these signal templates are also interpolated from fits to the acceptances of the fully simulated samples.
For SM background processes, the production of a W or Z boson in association with jets is simulated with alpgen [23] using the CTEQ6L LO PDF set. These events are processed with herwig [24] for parton show-ering and hadronization, and jimmy [25] to simulate the underlying event. The samples are initially normalized to the NNLO production cross-section computed with fewz [26, 27]. The prediction of the W boson trans-verse momentum, pT, by alpgen is reweighted to agree
with the shape predicted by sherpa [28], which is ob-served to agree more closely with data at high pT [29].
Single top quark (tb, tqb, tW ) and top quark pair (t¯t) production are simulated with the next-to-leading-order (NLO) generator mc@nlo [30–32] interfaced to her-wigand jimmy and using the CT10 [33] NLO PDF set. A sample of t¯t events generated with powheg [34–36] in-terfaced to herwig and jimmy is used to cross-check the mc@nlo t¯t production model, and a powheg t¯t sam-ple interfaced to pythia is generated to study the
dependence on the parton shower and hadronization model. The AcerMC event generator [37] interfaced with pythia is employed to study the effect of initial-and final-state radiation in t¯t events. Both t¯t and single top quark samples are generated assuming a top quark mass, mt, of 172.5 GeV, but two mc@nlo t¯t samples are
generated with mt= 170 GeV and 175 GeV to determine
the dependence of the background prediction on the top quark mass. The t¯t cross-section is normalized to the ap-proximate NNLO value [38, 39]. Single top quark produc-tion cross-secproduc-tions are taken from an NNLO calculaproduc-tion for the tb process [40], and approximate NNLO calcula-tions for the tqb and tW processes [41]. SM diboson pro-duction (W W, W Z, ZZ) is modeled using herwig and normalized to the NLO production cross-sections com-puted by mcfm [42, 43] with the MRST2007LO* PDF set. In all samples, photos [44] is employed to simulate final-state photon radiation and tauola [45] to take into account polarization in τ lepton decays.
All MC samples include the effect of multiple pp inter-actions (pile-up) per bunch crossing and are reweighted so as to match the distribution of the number of inter-actions per bunch crossing to that observed in the data. The detector response is simulated using a geant4-based model [46] of the ATLAS detector [47]. Finally, events are reconstructed using the same software used for colli-sion data.
IV. OBJECT RECONSTRUCTION AND EVENT SELECTION
The events recorded by the ATLAS detector for this analysis are selected by single-electron or single-muon triggers. The electron trigger requires an electron-like object [48] with transverse energy (ET) greater than
20 GeV or 22 GeV depending on the LHC instantaneous luminosity. The muon trigger requires a muon candi-date with pT > 18 GeV. The data sample used,
col-lected in 2011, corresponds to an integrated luminosity of 4.7 fb−1 [49, 50] after applying data-quality
require-ments [51]. MC events must satisfy the same trigger se-lection requirements.
All triggered events must have at least one recon-structed vertex formed by the intersection of at least three tracks with pT > 400 MeV [52]. From the list of
all vertices satisfying this requirement, the vertex with the largest sum of squared pT of the associated tracks is
assumed to be the primary hard-scatter vertex (PV). Electrons are reconstructed from energy clusters in the calorimeter with an electromagnetic shower profile con-sistent with that expected for an electron, and must have a matching ID track. Electron candidates must have ET > 30 GeV and be found within the fiducial region
defined by |η| < 2.47, excluding the region 1.37 < |η| < 1.52 which corresponds to the poorly instrumented
tran-sition between the barrel and endcap calorimeters. The longitudinal impact parameter of the electron track with respect to the PV (|z0|) must be less than 1 mm, and
the significance of its transverse impact parameter with respect to the PV (|d0|/σd0) must be less than 10.
Electron candidates must also be isolated from other activity in the calorimeter, such that the sum of calorime-ter transverse energy in a cone of radius ∆R = p(∆φ)2+ (∆η)2 = 0.3 around the electron, corrected
for pile-up contributions and the electron energy, is less than 6 GeV. The energy scale and resolution for elec-trons in MC events are corrected to match that in Z → e+e−events [53] measured in data.
Muons are reconstructed from the combination of tracks formed from hits in the MS and the ID [54, 55]. The combined muon track must have pT > 30 GeV and
|η| < 2.4. The muon track must have |z0| < 10 mm
and |d0|/σd0 < 10. The difference in |z0| requirements
between the electron and muon tracks results from the higher fraction of misreconstructed electrons due to QCD multi-jet events.
Furthermore, muon candidates must be isolated from other tracks and calorimeter activity: the sum of track transverse momenta surrounding the muon track in a cone of radius ∆R = 0.3 must be less than 15% of the muon pT; the calorimeter transverse energy, corrected for
pile-up contributions, in a cone of radius ∆R = 0.3 must be less than 14% of the muon pT. The muon pT scale
and resolution in MC events are adjusted to match that in Z → µ+µ− events measured in data [56].
Jets are reconstructed using the anti-ktsequential
re-combination clustering algorithm [57, 58], with radius set to 0.4. The inputs to the reconstruction algorithm are topological energy clusters [59] calibrated at the EM en-ergy scale, appropriate for the enen-ergy deposited by elec-trons or photons [59]. These jets are then calibrated to the hadronic energy scale, using pT- and η-dependent
correction factors obtained from simulation. The uncer-tainty on these correction factors is determined from con-trol samples in data. Jets originating from the PV are selected by requiring that at least 75% of the pTsum of
tracks matched to the jet belongs to tracks originating from the PV. If a reconstructed electron and jet candi-date overlap within ∆R = 0.3, the jet is rejected. Finally, jets must have pT > 40 GeV and |η| < 2.8.
Jets originating from b-quarks are identified by exploit-ing the long lifetimes of bottom hadrons, which lead to observable decay lengths in the detector. The SV0 sec-ondary vertex b-tagger [60, 61] is used at an operating point yielding an average b-jet-tagging efficiency of 50% in simulated t¯t events and an average light-quark jet re-jection factor of 200.
The missing transverse momentum (Emiss
T ) is defined
as the negative vector sum of transverse energies or mo-menta of all objects in the event. The ATLAS Emiss
T
MS with the transverse energies measured in calorimeter cells associated either to physics objects (such as jets or leptons) or to topological clusters not associated with physics objects. Calorimeter cells used in the ETmiss
calcu-lation are calibrated individually according to the physics object to which they are associated. Cells in topological energy clusters that are not associated with any recon-structed high-pT object are calibrated separately using
the local hadronic calibration scheme [63].
In the initial selection, events must contain exactly one electron or muon, and must have ETmiss> 40 GeV. Events
are also required to contain at least two jets, with the re-quirement that the highest-pT jet has pT > 100 GeV.
In the following, events with an electron are labeled eνjj and muon events are labeled µνjj. To reduce the QCD multi-jet background, two triangular veto regions are constructed in the plane defined by the Emiss
T and
∆φ(ℓ, Emiss
T ), the difference in azimuthal angle between
the lepton and Emiss
T directions. The first region, defined
by |∆φ| < 1.5 − 1.5 × (Emiss
T /75 GeV), corresponds to
events where the lepton and Emiss
T directions are aligned.
Back-to-back event topologies populate the second re-gion defined by |∆φ| > 2.0 + (π − 2) × (Emiss
T /75 GeV).
Events falling in either of these two regions are rejected. The selection cuts described above define the preselection criteria.
V. BACKGROUND ESTIMATION
Background sources are classified into two categories based on the origin of the charged lepton in the event. The first category includes backgrounds where the charged lepton is produced in the decay of a W or Z boson. The second category corresponds to all other sources, including both events with a misidentified lep-ton, e.g. where a jet with a large electromagnetic energy fraction passes the electron selection requirements, and events with a true lepton produced in a hadron decay.
Backgrounds from the first category, which include W/Z + jets, t¯t, single top quark, and diboson produc-tion, are modeled with MC events and are normalized to the product of the production cross-section for that back-ground and the total integrated luminosity of the dataset. The normalization of the W + jets and t¯t backgrounds is further tested using data as described in Section VI.
Backgrounds in the second category are modeled with independent samples of collision data based on the follow-ing prescriptions. In the eνjj channel, the sample is se-lected by inverting the calorimeter isolation requirement for electron candidates that satisfy all other selection cri-teria. This selects events that are likely to originate from multi-jet production, but have kinematic properties that are very similar to those multi-jet events that pass the isolation requirement. In the µνjj channel, the primary source of these backgrounds are semileptonic decays of
TABLE II: The number of data and estimated background events after applying the preselection cuts. The associated errors are the quadrature sum of the systematic and statistical uncertainties.
Process eνjj channel µνjj channel
[103 events] [103 events] W +jets 38.0 ± 4.1 46.0 ± 4.8 Z+jets 1.3 ± 0.1 1.8 ± 0.2 Top 15.0 ± 1.4 16.0 ± 1.5 Diboson 0.5 ± 0.1 0.5 ± 0.1 Fake lepton 0.9 ± 0.2 0.5 ± 0.2 Total background 56.0 ± 4.3 65.0 ± 5.1 Data 55.2 64.2
hadrons within a jet. Events with muons that satisfy all selection criteria except the transverse impact parameter significance cut are used to model this background. Kine-matic variable templates are derived from these samples after subtracting the contributions from backgrounds in the first category.
The data-driven backgrounds in the second category, henceforth labeled “fake” lepton backgrounds, are then normalized together with the W + jets background through a likelihood fit to the data in a region with negligible signal contamination. This is done separately for the eνjj and µνjj channels using the lepton trans-verse mass distribution, mT≡
q 2pℓ
TETmiss(1 − cos(∆φ)),
which distinguishes events with charged leptons from a W boson decay from events with a “fake” lepton. The normalization of all other backgrounds, from the first cat-egory, remains fixed in the fit.
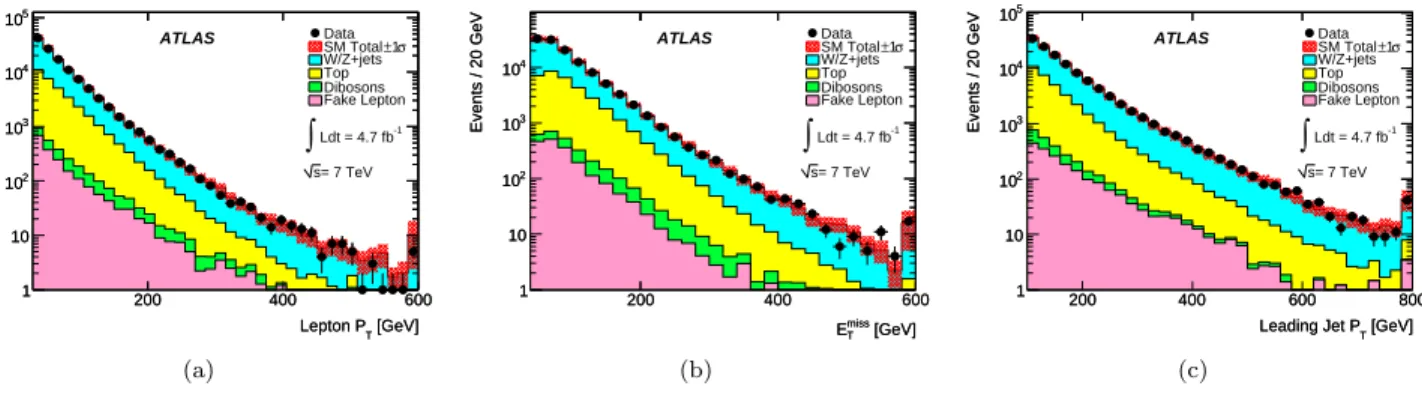
The distributions of the lepton pT, ETmissand the
lead-ing jet pT in data and for the predicted backgrounds,
after applying the event preselection criteria, are shown in Fig. 1. In this figure, the associated errors are com-bination of the systematic and statistical uncertainties. Table II shows the yields for each background and for the data. The total estimated background and the data agree within the expected total uncertainty at this stage of the selection.
VI. SELECTION OF SIGNAL AND CONTROL REGIONS
The W W or W Z mass, mℓνjj, is calculated as the
invariant mass of the ℓνjj system. To reconstruct this quantity, the x and y components of the neu-trino momentum vector, px and py, are set equal to
Emiss
T cos(φmiss) and ETmisssin(φmiss), respectively, with
φmiss corresponding to the direction of the ETmiss
vec-tor in the tranverse plane. The neutrino pz is obtained
by imposing the W boson mass constraint in the momen-tum conservation equation. It is defined as either the real
[GeV] T Lepton P 200 400 600 Events / 15 GeV 1 10 2 10 3 10 4 10 5 10 Data σ 1 ± SM Total W/Z+jets Top Dibosons Fake Lepton -1 Ldt = 4.7 fb
∫
= 7 TeV s ATLAS [GeV] T Lepton P 200 400 600 Events / 15 GeV 1 10 2 10 3 10 4 10 5 10 (a) [GeV] T miss E 200 400 600 Events / 20 GeV 1 10 2 10 3 10 4 10 Data σ 1 ± SM Total W/Z+jets Top Dibosons Fake Lepton -1 Ldt = 4.7 fb∫
= 7 TeV s ATLAS [GeV] T miss E 200 400 600 Events / 20 GeV 1 10 2 10 3 10 4 10 (b) [GeV] T Leading Jet P 200 400 600 800 Events / 20 GeV 1 10 2 10 3 10 4 10 5 10 Data σ 1 ± SM Total W/Z+jets Top Dibosons Fake Lepton -1 Ldt = 4.7 fb∫
= 7 TeV s ATLAS [GeV] T Leading Jet P 200 400 600 800 Events / 20 GeV 1 10 2 10 3 10 4 10 5 10 (c)FIG. 1: (color online) Data and background predictions for (a) the lepton pT, (b) E miss
T , and (c) leading jet pTfor preselected events. Electron and muon events are combined in all plots. The right-most bin contains overflow events.
[GeV] jj m 50 100 150 200 Events / 8 GeV 100 200 300 400 500 600 700 Data σ 1 ± SM Total W/Z+jets Top Dibosons Fake Lepton 5) × WZ ( → W’ = 1 TeV W’ m -1 Ldt = 4.7 fb
∫
= 7 TeV s ATLAS [GeV] jj m 50 100 150 200 Events / 8 GeV 100 200 300 400 500 600 700FIG. 2: (color online) Observed and predicted mjj distri-bution in all events satisfying the pT selection requirements of the reconstructed W/Z bosons. Predictions for an EGM W′ boson, with the signal cross-section enhanced by a factor of five, are shown for a resonance mass of 1 TeV.
component of the complex pz solution or the minimum
of the two real solutions. In events with three or more jets, the two jets with the highest transverse momenta are considered.
In signal events, the pT of each boson peaks near
half of the resonance mass, and the dijet mass distri-bution, mjj, is characterized by a peak close to the
W or Z boson mass. Since this analysis searches for resonant masses larger than 500 GeV, the signal region is defined by requiring the reconstructed pT of the
di-jet system and of the lepton–Emiss
T system to be greater
than 200 GeV and the reconstructed dijet mass to be within the window 65 < mjj < 115 GeV. Figure 2
com-pares the mjj distribution observed in data with those
predicted for the backgrounds and an enhanced EGM W′ signal after the requirements on the reconstructed
dijet and lepton–Emiss
T pT values but without the dijet
mass window requirement.
Two control regions are created to test the W +
[GeV] jj ν l m 500 1000 1500 2000 2500 Events / 100 GeV 1 10 2 10 3 10 Data σ 1 ± SM Total W/Z+jets Top Dibosons Fake Lepton -1 Ldt = 4.7 fb
∫
= 7 TeV s ATLAS [GeV] jj ν l m 500 1000 1500 2000 2500 Events / 100 GeV 1 10 2 10 3 10FIG. 3: (color online) The mℓνjj distribution for the data and the background predictions for events in the W + jets back-ground control region. The right-most bin contains overflow events.
jets and t¯t background modeling of the mℓνjj
distribu-tion. The W + jets control region is identical to the signal region, except for the mjj requirement, which
is inverted. Two independent sidebands are formed, mjj < 65 GeV and mjj > 115 GeV. A scale factor,
de-fined as the number of data events divided by the total background prediction, is computed in each sideband and parameterized as a function of mℓνjj. The weighted
aver-age of the scale factors, found in the mjj < 65 GeV and
mjj > 115 GeV sidebands, has a value of 1.012 and is
used to normalize the W + jets background prediction in the signal region. The difference between the individual scale factors is used as the uncertainty on this normaliza-tion. The two sidebands are combined in Fig. 3, which shows the mℓνjj distribution for the W + jets control
region after applying the W + jets scale factors. Good agreement between the data and MC is observed.
The t¯t control region is created by selecting events with at least two b-tagged jets. The reconstructed pT of the
[GeV] jj ν l m 500 1000 1500 2000 Events / 100 GeV 1 10 2 10 Data σ 1 ± SM Total W/Z+jets Top Dibosons Fake Lepton -1 Ldt = 4.7 fb
∫
= 7 TeV s ATLAS [GeV] jj ν l m 500 1000 1500 2000 Events / 100 GeV 1 10 2 10FIG. 4: (color online) The mℓνjj distribution in data events and the estimated backgrounds for the t¯t background control region. The right-most bin contains overflow events.
events are required to have mjj < 65 GeV or mjj >
115 GeV to avoid overlap with the signal region. Figure 4 shows mℓνjj for all events in the t¯t control region. In this
control region, 587 ± 87 t¯t events and 42 ± 6 events from other backgrounds are expected and 602 data events are observed. Given the agreement observed in the t¯t control region, no normalization correction is applied to the t¯t background prediction in the signal region.
VII. SYSTEMATIC UNCERTAINTIES
Systematic uncertainties that affect the predicted sig-nal acceptance and background rate are grouped into three independent categories: uncertainties due to the limited precision of theoretical calculations, experimen-tal uncertainties on the event reconstruction efficiencies and resolutions, and the determination of the integrated luminosity. Uncertainties from the first and third cate-gories impact the signal and all of the backgrounds except W + jets and “fake” lepton backgrounds which are esti-mated from data. The integrated luminosity uncertainty is 3.9% [49, 50].
Several sources of theoretical uncertainty on the t¯t background rate are considered. The largest of these is the+7−10% [38, 39] uncertainty on the production cross-section. Additionally, the magnitudes of the following systematic uncertainties affecting the t¯t background dis-tribution vary with mℓνjj. The largest deviation from
the t¯t prediction for all mℓνjj values is presented below.
The nominal mc@nlo model for t¯t production differs from the powheg model by at most 3%. A 1–2% vari-ation is measured when the top quark mass is varied by ±2.5 GeV using mc@nlo MC samples. The difference between the nominal herwig parton shower model and the pythia model in powheg generated events is at most 2%. Finally, the uncertainty due to the initial-state ra-diation (ISR) and final-state rara-diation (FSR) model in
pythiais estimated to be at most 3% for all mℓνjj val-ues.
For the remaining, smaller backgrounds modeled with MC simulation, only theoretical uncertainties due to lim-ited knowledge of their production cross-sections are con-sidered. The production rate of W W and ZZ dibosons is known to 5% accuracy, while that for W Z production is known to within 7% [43]. The uncertainty on the Z + jets production rate is estimated to be 5%, primarily due to limited knowledge of the u- and d-quark PDFs [19]. The production of s-channel single top quarks (tb) is known to 6% [40] while t-channel (tqb) and tW production are known to+5−4% and 9% [41], respectively.
For the signals, the PDF uncertainty is esti-mated by comparing signal events generated with MRST2007LO* and CTEQ6L PDFs and a maximum dif-ference of 5% is measured in the acceptance. The ISR and FSR uncertainty is determined to be 5% using the same procedure as that for t¯t events.
The largest experimental uncertainties come from the determination of the jet energy scale (JES) [59] and res-olution (JER) [64]. The JES uncertainty includes effects due to uncertainties in jet flavor composition, overlap-ping jets, and pile-up effects. The overall JES uncer-tainty on each background process as well as the signal is determined by varying all jet energies within their un-certainties. The impact of this uncertainty varies with mℓνjj, and the largest deviation from the nominal
pre-diction is presented. For the background samples, this ranges from 8% for single top quark events to 13% for di-boson events. For the signal events samples, the largest deviation from the nominal prediction for all mℓνjj
val-ues is 4%. An equivalent procedure is applied to evaluate the JER uncertainty, and the largest deviation from the nominal prediction is found to be between 1% and 3% for all signal and background samples.
Additional uncertainties arise from the differences be-tween data and MC simulation in the reconstruction ef-ficiencies and energy or momentum resolution for elec-trons, muons, and ETmiss. The electron energy scale
and resolution uncertainties are derived by comparing Z → e+e− events in data and MC samples. The
com-bined uncertainty is 2–3% depending on mℓνjj. The
cor-responding uncertainty for muons is at most 2% for any mℓνjjvalue. The primary contribution to the ETmissscale
uncertainty is pile-up, but the impact on the mℓνjj
dis-tribution above 500 GeV is less than 1% for all back-grounds. The combined uncertainty on the signal accep-tance ranges from 7% at low mℓνjjto 20% at high mℓνjj.
The distributions from the “fake” lepton and W +jets backgrounds are normalized to the number of events in data control regions, and are therefore not affected by systematic uncertainties in the relative reconstruction ef-ficiency in data and MC events, nor uncertainties in their respective production cross-sections. The “fake” lepton background normalization uncertainty is estimated by
TABLE III: Estimated background yields, number of data events, and predicted signal yield after applying the signal selection criteria. Quoted uncertainties are statistical plus systematic as described in text.
Process eνjj µνjj W +jets 700 ± 65 590 ± 60 Z+jets 15 ± 2 15 ± 2 Top 615 ± 70 515 ± 65 Diboson 75 ± 9 60 ± 8 Fake Lepton 20 ± 16 15 ± 15 Total backgrounds 1425 ± 100 1195 ± 85 Data 1453 1328 RS1 G∗(m G∗ = 1 TeV) 22 ± 2 18 ± 2 Bulk G∗(m G∗ = 1 TeV) 4 ± 0.4 3.5 ± 0.3 EGM W′ (m W′ = 1 TeV) 29 ± 2 24 ± 2
using the distributions of Emiss
T and the scalar sum of
the lepton pT and ETmiss to determine the “fake” lepton
normalization, and quoting the maximum deviation from the mT-fitted value. This results in an 80 (100)%
uncer-tainty on events with electrons (muons). The W +jets normalization uncertainty is defined as the difference be-tween the low-mjj and high-mjj control region scale
fac-tors, resulting in an uncertainty of 9%.
VIII. RESULTS AND INTERPRETATION
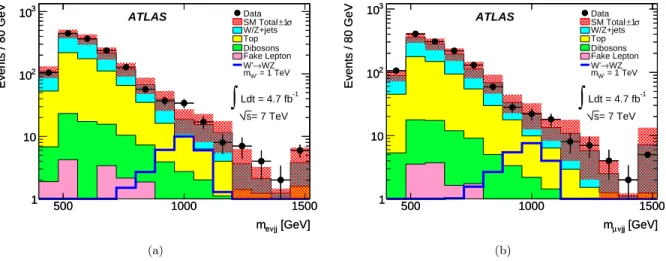
The numbers of expected and observed events after the final signal selection are reported in Table III. A total of 1453 eνjj and 1328 µνjj events are observed with back-ground predictions of 1425 ± 100 and 1195 ± 85 events, respectively. The mℓνjj distributions for data, predicted
background samples and an EGM W′ boson signal with
mass mW′ = 1 TeV are shown in Fig. 5.
These distributions are used to construct a log-likelihood ratio (LLR) test statistic to compute the sta-tistical significance of any excess over expectation using a modified frequentist approach. Pseudo-experiments that treat all systematic uncertainties as Gaussian-sampled nuisance parameters are used to generate the distribu-tion of possible LLR values for the background-only (b) and signal-plus-background (s+b) hypotheses. Confi-dence levels (CL) for each hypothesis are defined as the fraction of experiments with LLR greater than or equal to the LLR evaluated on the data.
The statistical significance of an observed signal is quantified by giving, for each mass point, the p-value (p ≡ 1 − CLb) of the background-only hypothesis. The
greatest deviations from the background prediction occur at mℓνjj = 1300 GeV and 1500 GeV with p = 0.12 and
0.11, respectively.
Lacking evidence for new phenomena, limits on the sig-nal rate are determined using the CLs method [65, 66].
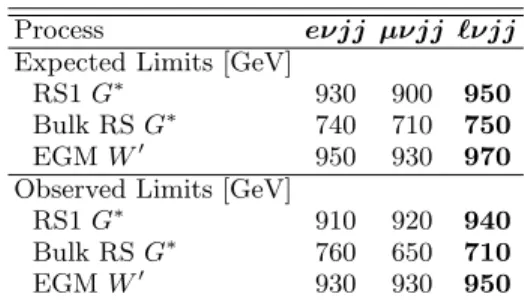
TABLE IV: Expected and observed 95% CL lower mass limits (GeV) for the RS1 G∗, bulk RS G∗, and the EGM W′boson using eνjj events, µνjj events and the combined channels.
Process eνjj µνjj ℓνjj
Expected Limits [GeV]
RS1 G∗ 930 900 950
Bulk RS G∗ 740 710 750
EGM W′ 950 930 970
Observed Limits [GeV]
RS1 G∗ 910 920 940
Bulk RS G∗ 760 650 710
EGM W′ 930 930 950
This method uses a ratio of the p-values of the signal-plus-background and background-only hypotheses called CLs. For a 95% CL exclusion, the signal production
cross-section (σ95%) is adjusted until CL
s = 0.05, and
the resonance mass limit (m95%) is defined by the mass
for which σ(m95%) = σ95%. The excluded production
cross-sections times the branching ratios to the W W or W Z final state are shown in Fig. 6, with the eνjj and µνjj channels combined, for the three signal hypothe-ses. The expected and observed limits on the resonances are shown in Table IV for the eνjj and µνjj channels separately, as well as their combination.
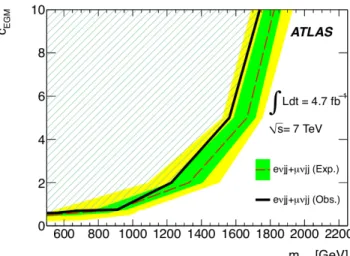
Limits are also set on the EGM W′ boson coupling
strength scaling factor cEGM within the EGM
frame-work. The EGM W′ boson limits shown in Fig. 6
corre-spond to cEGM= 1. For cEGM> 10, the resonance width
exceeds the experimental resolution, thus only values less than 10 are considered. Limits on cEGM are derived as a
function of mW′ as shown in Fig. 7.
IX. CONCLUSION
We report the results of a search for resonant W W and W Z production in the ℓνjj decay channels using an in-tegrated luminosity of 4.7 fb−1 of pp-collision data at
√
s = 7 TeV collected in 2011 by the ATLAS detector at the Large Hadron Collider. A set of event selections for the RS1 G∗, the bulk RS G∗, and the EGM W′boson
sig-nals are derived using simulated events. No evidence for resonant diboson production is observed and 95% CL up-per bounds on the two graviton and EGM W′ boson
pro-duction cross-sections are determined. Resonance masses below 940 GeV, 710 GeV, and 950 GeV are excluded at 95% CL for the spin-2 RS1 graviton, the spin-2 bulk RS graviton and the spin-1 EGM W′ boson, respectively.
ACKNOWLEDGEMENTS
We thank CERN for the very successful operation of the LHC, as well as the support staff from our institutions without whom ATLAS could not be operated efficiently. We acknowledge the support of ANPCyT, Argentina; YerPhI, Armenia; ARC, Australia; BMWF and FWF, Austria; ANAS, Azerbaijan; SSTC, Belarus; CNPq and FAPESP, Brazil; NSERC, NRC and CFI, Canada; CERN; CONICYT, Chile; CAS, MOST and NSFC, China; COLCIENCIAS, Colombia; MSMT CR, MPO CR and VSC CR, Czech Republic; DNRF, DNSRC and Lundbeck Foundation, Denmark; EPLANET, ERC and NSRF, European Union; IN2P3-CNRS, CEA-DSM/IRFU, France; GNSF, Georgia; BMBF, DFG, HGF, MPG and AvH Foundation, Germany; GSRT and NSRF, Greece; ISF, MINERVA, GIF, DIP and Benoziyo Center, Israel; INFN, Italy; MEXT and JSPS, Japan; CNRST, Morocco; FOM and NWO, Netherlands; BRF and RCN, Norway; MNiSW, Poland; GRICES and FCT, Portugal; MERYS (MECTS), Romania; MES of Rus-sia and ROSATOM, RusRus-sian Federation; JINR; MSTD, Serbia; MSSR, Slovakia; ARRS and MIZˇS, Slovenia; DST/NRF, South Africa; MICINN, Spain; SRC and Wallenberg Foundation, Sweden; SER, SNSF and Can-tons of Bern and Geneva, Switzerland; NSC, Taiwan; TAEK, Turkey; STFC, the Royal Society and Lever-hulme Trust, United Kingdom; DOE and NSF, United States of America.
The crucial computing support from all WLCG part-ners is acknowledged gratefully, in particular from CERN and the ATLAS Tier-1 facilities at TRIUMF (Canada), NDGF (Denmark, Norway, Sweden), CC-IN2P3 (France), KIT/GridKA (Germany), INFN-CNAF (Italy), NL-T1 (Netherlands), PIC (Spain), ASGC (Tai-wan), RAL (UK) and BNL (USA) and in the Tier-2 fa-cilities worldwide.
[1] L. Randall and R. Sundrum, Phys. Rev. Lett. 83, 3370 (1999).
[2] E. Eichten and K. Lane, Phys. Lett. B 669, 235 (2008). [3] F. Bach and T. Ohl, Phys. Rev. D 85, 015002 (2012). [4] K. Agashe, S. Gopalakrishna, T. Han, G.-Y. Huang,
and A. Soni, Phys. Rev. D 80, 075007 (2009). [5] K. Agashe, H. Davoudiasl, S. Gopalakrishna, T. Han,
G.-Y. Huang, G. Perez, Z.-G. Si, and A. Soni, Phys. Rev. D 76, 115015 (2007).
[6] O. Antipin, D. Atwood, and A. Soni, Phys. Lett. B 666, no. 2, 155 (2008). [7] ATLAS Collaboration,
Phys. Lett. B 718, no. 3, 860 (2013).
[8] ATLAS Collaboration, Phys. Rev. D 85, 112012 (2012). [9] ATLAS Collaboration,
Phys. Lett. B 712, no. 4-5, 331 (2012).
[10] S. Chang, J. Hisano, H. Nakano, N. Okada, and
M. Yamaguchi, Phys. Rev. D 62, 084025 (2000). [11] G. Altarelli, B. Mele, and M. Ruiz-Altaba,
Z. Phys. C 45, 109 (1989).
[12] D0 Collaboration Collaboration, V. M. Abazov et al., Phys. Rev. Lett. 107, 011801 (2011).
[13] CMS Collaboration, Phys. Lett. B 718, 1208 (2012). [14] CMS Collaboration,
Phys. Rev. Lett. 109, 141801 (2012).
[15] ATLAS Collaboration, JINST 3, S08003 (2008). [16] ATLAS uses a right-handed coordinate system with its
origin at the nominal interaction point (IP) in the center of the detector and the z-axis along the beam pipe. The x-axis points from the IP to the center of the LHC ring, and the y-axis points upward. Cylindrical coordinates (r, φ) are used in the transverse plane, φ being the azimuthal angle around the beam pipe. The pseudorapidity is defined in terms of the polar angle θ as η = − ln tan(θ/2). The transverse energy ETis defined as E sin θ, where E is the energy associated to the calorimeter cell or energy cluster. Similarly, pTis the momentum component transverse to the beam line. [17] T. Sj¨ostrand, S. Mrenna, and P. Skands,
J. High Energy Phys. 05, 026 (2006). [18] A. Sherstnev and R. Thorne,
arXiv:0807.2132 [hep-ph].
[19] R. Hamberg, W. van Neerven, and T. Matsuura, Nucl. Phys. B 359, 343 (1991).
[20] A. Pukhov, arXiv:hep-ph/0412191 [hep-ph]. [21] J. Pumplin, D. R. Stump, J. Huston, H.-L. Lai,
P. Nadolsky, and W.-K. Tung, J. High Energy Phys. 07, 012 (2002).
[22] T. Skwarnicki,. PhD thesis, Cracow Institute of Nuclear Physics, 1986. DESY F31-86-02.
[23] M. L. Mangano, F. Piccinini, A. D. Polosa, M. Moretti, and R. Pittau, J. High Energy Phys. 07, 001 (2003). [24] G. Corcella, I. G. Knowles, G. Marchesini, S. Moretti,
K. Odagiri, P. Richardson, M. H. Seymour, and B. R. Webber, J. High Energy Phys. 01, 010 (2001). [25] J. Butterworth, J. Forshaw, and M. Seymour,
Z. Phys. C 72, 637 (1996). [26] K. Melnikov and F. Petriello,
Phys. Rev. D 74, 114017 (2006).
[27] R. Gavin, Y. Li, F. Petriello, and S. Quackenbush, Comput. Phys. Commun. 182, no. 11, 2388 (2011). [28] T. Gleisberg, S. H¨oche, F. Krauss, M. Sch¨onherr,
S. Schumann, F. Siegert, and J. Winter, J. High Energy Phys. 09, no. 02, 007 (2009).
[29] ATLAS Collaboration, Phys. Rev. D 85, 012005 (2012). [30] S. Frixione and B. R. Webber,
J. High Energy Phys. 06, 029 (2002).
[31] S. Frixione, E. Laenen, P. Motylinski, and B. R. Webber, J. High Energy Phys. 03, 092 (2006). [32] S. Frixione, E. Laenen, P. Motylinski, C. White, and
B. R. Webber, J. High Energy Phys. 07, 029 (2008). [33] H.-L. Lai, M. Guzzi, J. Huston, Z. Li, P. M. Nadolsky,
J. Pumplin, and C.-P. Yuan, Phys. Rev. D 82, 074024 (2010).
[34] P. Nason, J. High Energy Phys. 11, 040 (2004). [35] S. Frixione, P. Nason, and C. Oleari,
J. High Energy Phys. 11, 070 (2007). [36] S. Alioli, P. Nason, C. Oleari, and E. Re,
J. High Energy Phys. 6, 1 (2010). [37] B. P. Kersevan and E. Richter-Was,
[38] S. Moch and P. Uwer, Phys. Rev. D 78, 034003 (2008). [39] U. Langenfeld, S. Moch, and P. Uwer,
arXiv:0907.2527 [hep-ph].
[40] N. Kidonakis, Phys. Rev. D 81, 054028 (2010). [41] N. Kidonakis, Phys. Rev. D 83, 091503 (2011). [42] J. M. Campbell and R. K. Ellis,
Phys. Rev. D 60, 113006 (1999). [43] J. Campbell, R. Ellis, and C. Williams,
J. High Energy Phys. 07, 018 (2011).
[44] P. Golonka and Z. Was, Eur. Phys. J. C 45, 97 (2006). [45] Z. Was, Nucl. Phys. Proc. Suppl. 98, 96 (2001). [46] S. Agostinelli et al.,
Nucl. Instrum. Meth. 506, no. 3, 250 (2003).
[47] ATLAS Collaboration, Eur. Phys. J. C 70, 823 (2010). [48] ATLAS Collaboration, Eur. Phys. J. C 72, 1849 (2012). [49] ATLAS Collaboration, Eur. Phys. J. C 71, 1630 (2011). [50] ATLAS Collaboration, arXiv:1302.4393 [hep-ex].
Submitted to Eur. Phys. J. C.
[51] ATLAS Collaboration, Eur. Phys. J. C 72, 1960 (2012). [52] ATLAS Collaboration, ATLAS-CONF-2012-042.
http://cdsweb.cern.ch/record/1435196.
[53] ATLAS Collaboration, Eur. Phys. J. C 72, 1909 (2012). [54] ATLAS Collaboration, ATLAS-CONF-2011-063.
http://cdsweb.cern.ch/record/1345743.
[55] ATLAS Collaboration, ATLAS-CONF-2011-021. http://cdsweb.cern.ch/record/1336750.
[56] ATLAS Collaboration, ATLAS-CONF-2011-046. http://cdsweb.cern.ch/record/1338575.
[57] M. Cacciari and G. P. Salam, Phys. Lett. B 641, no. 1, 57 (2006). [58] M. Cacciari, G. P. Salam, and G. Soyez,
J. High Energy Phys. 04, 063 (2008).
[59] ATLAS Collaboration, Eur. Phys. J. C 73, 2304 (2013). [60] ATLAS Collaboration, ATLAS-CONF-2011-102.
http://cdsweb.cern.ch/record/1369219.
[61] ATLAS Collaboration, ATLAS-CONF-2010-091. http://cdsweb.cern.ch/record/1299106.
[62] ATLAS Collaboration, Eur. Phys. J. C 72, 1844 (2012). [63] ATLAS Collaboration,.
http://cdsweb.cern.ch/record/1112035.
[64] ATLAS Collaboration, Eur. Phys. J. C 73, 2306 (2013). [65] T. Junk, Nucl. Instrum. Meth. 434, 435 (1999). [66] A. L. Read,
[GeV] jj ν e m 500 1000 1500 Events / 80 GeV 1 10 2 10 3 10 Data σ 1 ± SM Total W/Z+jets Top Dibosons Fake Lepton WZ → W’ = 1 TeV W’ m -1 Ldt = 4.7 fb
∫
= 7 TeV s ATLAS [GeV] jj ν e m 500 1000 1500 Events / 80 GeV 1 10 2 10 3 10 (a) [GeV] jj ν µ m 500 1000 1500 Events / 80 GeV 1 10 2 10 3 10 Data σ 1 ± SM Total W/Z+jets Top Dibosons Fake Lepton WZ → W’ = 1 TeV W’ m -1 Ldt = 4.7 fb∫
= 7 TeV s ATLAS [GeV] jj ν µ m 500 1000 1500 Events / 80 GeV 1 10 2 10 3 10 (b)FIG. 5: (color online) Observed and predicted mℓνjj distributions shown for all (a) eνjj and (b) µνjj events satisfying the signal selection requirements. Predictions for an EGM W′ boson are shown for a resonance mass of 1 TeV. The right-most bin contains overflow events.
[GeV] G* m 600 800 1000 1200 1400 BR [pb] × σ -1 10 1 10 σ(pp → G*RS1→ WW) Expected Limit σ 1 ± Expected σ 2 ± Expected Observed limit [GeV] G* m 600 800 1000 1200 1400 BR [pb] × σ -1 10 1 10 -1 Ldt = 4.7 fb
∫
ATLAS (a) [GeV] G* m 500 600 700 800 900 1000 1100 1200 BR [pb] × σ -2 10 -1 10 1 10 WW) → Bulk G* → (pp σ Expected Limit σ 1 ± Expected σ 2 ± Expected Observed limit [GeV] G* m 500 600 700 800 900 1000 1100 1200 BR [pb] × σ -2 10 -1 10 1 10 -1 Ldt = 4.7 fb∫
ATLAS (b) [GeV] W’ m 600 800 1000 1200 1400 BR [pb] × σ -2 10 -1 10 1 10 σ(pp → W’EGM→ WZ) Expected Limit σ 1 ± Expected σ 2 ± Expected Observed limit [GeV] W’ m 600 800 1000 1200 1400 BR [pb] × σ -2 10 -1 10 1 10 -1 Ldt = 4.7 fb∫
ATLAS (c)FIG. 6: (color online) Observed and expected 95% CL upper limits on σ(pp → G∗) × BR(G∗
→ W W ) for (a) an RS1 G∗and (b) a bulk RS G∗, and on σ(pp → W′) × BR(W′ → W Z) for (c) an EGM W′boson.
FIG. 7: (color online) The 95% CL observed and expected excluded regions of the EGM coupling strength scaling factor cEGM as a function of mW′. The green and yellow band correspond to the ±1 and ±2σ intervals, respectively.
The ATLAS Collaboration
G. Aad48, T. Abajyan21, B. Abbott111, J. Abdallah12, S. Abdel Khalek115, A.A. Abdelalim49, O. Abdinov11,
R. Aben105, B. Abi112, M. Abolins88, O.S. AbouZeid158, H. Abramowicz153, H. Abreu136, B.S. Acharya164a,164b,a,
L. Adamczyk38, D.L. Adams25, T.N. Addy56, J. Adelman176, S. Adomeit98, P. Adragna75, T. Adye129, S. Aefsky23,
J.A. Aguilar-Saavedra124b,b, M. Agustoni17, M. Aharrouche81, S.P. Ahlen22, F. Ahles48, A. Ahmad148, M. Ahsan41,
G. Aielli133a,133b, T. Akdogan19a, T.P.A. ˚Akesson79, G. Akimoto155, A.V. Akimov94, M.S. Alam2, M.A. Alam76,
J. Albert169, S. Albrand55, M. Aleksa30, I.N. Aleksandrov64, F. Alessandria89a, C. Alexa26a, G. Alexander153,
G. Alexandre49, T. Alexopoulos10, M. Alhroob164a,164c, M. Aliev16, G. Alimonti89a, J. Alison120,
B.M.M. Allbrooke18, P.P. Allport73, S.E. Allwood-Spiers53, J. Almond82, A. Aloisio102a,102b, R. Alon172,
A. Alonso36, F. Alonso70, A. Altheimer35, B. Alvarez Gonzalez88, M.G. Alviggi102a,102b, K. Amako65, C. Amelung23,
V.V. Ammosov128,∗, S.P. Amor Dos Santos124a, A. Amorim124a,c, N. Amram153, C. Anastopoulos30, L.S. Ancu17,
N. Andari115, T. Andeen35, C.F. Anders58b, G. Anders58a, K.J. Anderson31, A. Andreazza89a,89b, V. Andrei58a,
M-L. Andrieux55, X.S. Anduaga70, S. Angelidakis9, P. Anger44, A. Angerami35, F. Anghinolfi30, A. Anisenkov107,
N. Anjos124a, A. Annovi47, A. Antonaki9, M. Antonelli47, A. Antonov96, J. Antos144b, F. Anulli132a, M. Aoki101,
S. Aoun83, L. Aperio Bella5, R. Apolle118,d, G. Arabidze88, I. Aracena143, Y. Arai65, A.T.H. Arce45, S. Arfaoui148,
J-F. Arguin93, E. Arik19a,∗, M. Arik19a, A.J. Armbruster87, O. Arnaez81, V. Arnal80, C. Arnault115,
A. Artamonov95, G. Artoni132a,132b, D. Arutinov21, S. Asai155, S. Ask28, B. ˚Asman146a,146b, L. Asquith6, K. Assamagan25, A. Astbury169, M. Atkinson165, B. Aubert5, E. Auge115, K. Augsten126, M. Aurousseau145a, G. Avolio30, R. Avramidou10, D. Axen168, G. Azuelos93,e, Y. Azuma155, M.A. Baak30, G. Baccaglioni89a, C. Bacci134a,134b, A.M. Bach15, H. Bachacou136, K. Bachas30, M. Backes49, M. Backhaus21, J. Backus Mayes143,
E. Badescu26a, P. Bagnaia132a,132b, S. Bahinipati3, Y. Bai33a, D.C. Bailey158, T. Bain158, J.T. Baines129,
O.K. Baker176, M.D. Baker25, S. Baker77, P. Balek127, E. Banas39, P. Banerjee93, Sw. Banerjee173, D. Banfi30,
A. Bangert150, V. Bansal169, H.S. Bansil18, L. Barak172, S.P. Baranov94, A. Barbaro Galtieri15, T. Barber48,
E.L. Barberio86, D. Barberis50a,50b, M. Barbero21, D.Y. Bardin64, T. Barillari99, M. Barisonzi175, T. Barklow143,
N. Barlow28, B.M. Barnett129, R.M. Barnett15, A. Baroncelli134a, G. Barone49, A.J. Barr118, F. Barreiro80,
J. Barreiro Guimar˜aes da Costa57, P. Barrillon115, R. Bartoldus143, A.E. Barton71, V. Bartsch149, A. Basye165,
R.L. Bates53, L. Batkova144a, J.R. Batley28, A. Battaglia17, M. Battistin30, F. Bauer136, H.S. Bawa143,f, S. Beale98,
T. Beau78, P.H. Beauchemin161, R. Beccherle50a, P. Bechtle21, H.P. Beck17, K. Becker175, S. Becker98,
M. Beckingham138, K.H. Becks175, A.J. Beddall19c, A. Beddall19c, S. Bedikian176, V.A. Bednyakov64, C.P. Bee83,
L.J. Beemster105, M. Begel25, S. Behar Harpaz152, P.K. Behera62, M. Beimforde99, C. Belanger-Champagne85,
P.J. Bell49, W.H. Bell49, G. Bella153, L. Bellagamba20a, M. Bellomo30, A. Belloni57, O. Beloborodova107,g,
K. Belotskiy96, O. Beltramello30, O. Benary153, D. Benchekroun135a, K. Bendtz146a,146b, N. Benekos165,
Y. Benhammou153, E. Benhar Noccioli49, J.A. Benitez Garcia159b, D.P. Benjamin45, M. Benoit115, J.R. Bensinger23,
K. Benslama130, S. Bentvelsen105, D. Berge30, E. Bergeaas Kuutmann42, N. Berger5, F. Berghaus169,
E. Berglund105, J. Beringer15, P. Bernat77, R. Bernhard48, C. Bernius25, T. Berry76, C. Bertella83, A. Bertin20a,20b,
F. Bertolucci122a,122b, M.I. Besana89a,89b, G.J. Besjes104, N. Besson136, S. Bethke99, W. Bhimji46, R.M. Bianchi30,
L. Bianchini23, M. Bianco72a,72b, O. Biebel98, S.P. Bieniek77, K. Bierwagen54, J. Biesiada15, M. Biglietti134a,
H. Bilokon47, M. Bindi20a,20b, S. Binet115, A. Bingul19c, C. Bini132a,132b, C. Biscarat178, B. Bittner99, K.M. Black22,
R.E. Blair6, J.-B. Blanchard136, G. Blanchot30, T. Blazek144a, I. Bloch42, C. Blocker23, J. Blocki39, A. Blondel49,
W. Blum81, U. Blumenschein54, G.J. Bobbink105, V.S. Bobrovnikov107, S.S. Bocchetta79, A. Bocci45,
C.R. Boddy118, M. Boehler48, J. Boek175, T.T. Boek175, N. Boelaert36, J.A. Bogaerts30, A. Bogdanchikov107,
A. Bogouch90,∗, C. Bohm146a, J. Bohm125, V. Boisvert76, T. Bold38, V. Boldea26a, N.M. Bolnet136, M. Bomben78,
M. Bona75, M. Boonekamp136, S. Bordoni78, C. Borer17, A. Borisov128, G. Borissov71, I. Borjanovic13a, M. Borri82,
S. Borroni87, J. Bortfeldt98, V. Bortolotto134a,134b, K. Bos105, D. Boscherini20a, M. Bosman12, H. Boterenbrood105,
J. Bouchami93, J. Boudreau123, E.V. Bouhova-Thacker71, D. Boumediene34, C. Bourdarios115, N. Bousson83,
A. Boveia31, J. Boyd30, I.R. Boyko64, I. Bozovic-Jelisavcic13b, J. Bracinik18, P. Branchini134a, A. Brandt8, G. Brandt118, O. Brandt54, U. Bratzler156, B. Brau84, J.E. Brau114, H.M. Braun175,∗, S.F. Brazzale164a,164c,
B. Brelier158, J. Bremer30, K. Brendlinger120, R. Brenner166, S. Bressler172, D. Britton53, F.M. Brochu28, I. Brock21, R. Brock88, F. Broggi89a, C. Bromberg88, J. Bronner99, G. Brooijmans35, T. Brooks76, W.K. Brooks32b, G. Brown82,
H. Brown8, P.A. Bruckman de Renstrom39, D. Bruncko144b, R. Bruneliere48, S. Brunet60, A. Bruni20a, G. Bruni20a,
M. Bruschi20a, T. Buanes14, Q. Buat55, F. Bucci49, J. Buchanan118, P. Buchholz141, R.M. Buckingham118,
A.G. Buckley46, S.I. Buda26a, I.A. Budagov64, B. Budick108, L. Bugge117, O. Bulekov96, A.C. Bundock73,
M. Bunse43, T. Buran117,∗, H. Burckhart30, S. Burdin73, T. Burgess14, S. Burke129, E. Busato34, V. B¨uscher81,
P. Bussey53, C.P. Buszello166, B. Butler143, J.M. Butler22, C.M. Buttar53, J.M. Butterworth77, W. Buttinger28,
R. Calkins106, L.P. Caloba24a, R. Caloi132a,132b, D. Calvet34, S. Calvet34, R. Camacho Toro34, P. Camarri133a,133b,
D. Cameron117, L.M. Caminada15, R. Caminal Armadans12, S. Campana30, M. Campanelli77, V. Canale102a,102b,
F. Canelli31, A. Canepa159a, J. Cantero80, R. Cantrill76, L. Capasso102a,102b, M.D.M. Capeans Garrido30, I. Caprini26a, M. Caprini26a, D. Capriotti99, M. Capua37a,37b, R. Caputo81, R. Cardarelli133a, T. Carli30, G. Carlino102a, L. Carminati89a,89b, B. Caron85, S. Caron104, E. Carquin32b, G.D. Carrillo-Montoya173,
A.A. Carter75, J.R. Carter28, J. Carvalho124a,h, D. Casadei108, M.P. Casado12, M. Cascella122a,122b, C. Caso50a,50b,∗,
A.M. Castaneda Hernandez173,i, E. Castaneda-Miranda173, V. Castillo Gimenez167, N.F. Castro124a, G. Cataldi72a,
P. Catastini57, A. Catinaccio30, J.R. Catmore30, A. Cattai30, G. Cattani133a,133b, S. Caughron88, V. Cavaliere165,
P. Cavalleri78, D. Cavalli89a, M. Cavalli-Sforza12, V. Cavasinni122a,122b, F. Ceradini134a,134b, A.S. Cerqueira24b,
A. Cerri30, L. Cerrito75, F. Cerutti47, S.A. Cetin19b, A. Chafaq135a, D. Chakraborty106, I. Chalupkova127, K. Chan3,
P. Chang165, B. Chapleau85, J.D. Chapman28, J.W. Chapman87, E. Chareyre78, D.G. Charlton18, V. Chavda82,
C.A. Chavez Barajas30, S. Cheatham85, S. Chekanov6, S.V. Chekulaev159a, G.A. Chelkov64, M.A. Chelstowska104,
C. Chen63, H. Chen25, S. Chen33c, X. Chen173, Y. Chen35, Y. Cheng31, A. Cheplakov64,
R. Cherkaoui El Moursli135e, V. Chernyatin25, E. Cheu7, S.L. Cheung158, L. Chevalier136, G. Chiefari102a,102b,
L. Chikovani51a,∗, J.T. Childers30, A. Chilingarov71, G. Chiodini72a, A.S. Chisholm18, R.T. Chislett77, A. Chitan26a,
M.V. Chizhov64, G. Choudalakis31, S. Chouridou137, I.A. Christidi77, A. Christov48, D. Chromek-Burckhart30,
M.L. Chu151, J. Chudoba125, G. Ciapetti132a,132b, A.K. Ciftci4a, R. Ciftci4a, D. Cinca34, V. Cindro74, A. Ciocio15,
M. Cirilli87, P. Cirkovic13b, Z.H. Citron172, M. Citterio89a, M. Ciubancan26a, A. Clark49, P.J. Clark46,
R.N. Clarke15, W. Cleland123, J.C. Clemens83, B. Clement55, C. Clement146a,146b, Y. Coadou83, M. Cobal164a,164c,
A. Coccaro138, J. Cochran63, L. Coffey23, J.G. Cogan143, J. Coggeshall165, E. Cogneras178, J. Colas5, S. Cole106,
A.P. Colijn105, N.J. Collins18, C. Collins-Tooth53, J. Collot55, T. Colombo119a,119b, G. Colon84, G. Compostella99,
P. Conde Mui˜no124a, E. Coniavitis166, M.C. Conidi12, S.M. Consonni89a,89b, V. Consorti48, S. Constantinescu26a,
C. Conta119a,119b, G. Conti57, F. Conventi102a,j, M. Cooke15, B.D. Cooper77, A.M. Cooper-Sarkar118, K. Copic15,
T. Cornelissen175, M. Corradi20a, F. Corriveau85,k, A. Corso-Radu163, A. Cortes-Gonzalez165, G. Cortiana99,
G. Costa89a, M.J. Costa167, D. Costanzo139, D. Cˆot´e30, L. Courneyea169, G. Cowan76, C. Cowden28, B.E. Cox82,
K. Cranmer108, S. Cr´ep´e-Renaudin55, F. Crescioli78, M. Cristinziani21, G. Crosetti37a,37b, C.-M. Cuciuc26a,
C. Cuenca Almenar176, T. Cuhadar Donszelmann139, J. Cummings176, M. Curatolo47, C.J. Curtis18, C. Cuthbert150,
P. Cwetanski60, H. Czirr141, P. Czodrowski44, Z. Czyczula176, S. D’Auria53, M. D’Onofrio73, A. D’Orazio132a,132b,
M.J. Da Cunha Sargedas De Sousa124a, C. Da Via82, W. Dabrowski38, A. Dafinca118, T. Dai87, C. Dallapiccola84,
M. Dam36, M. Dameri50a,50b, D.S. Damiani137, H.O. Danielsson30, V. Dao49, G. Darbo50a, G.L. Darlea26b,
J.A. Dassoulas42, W. Davey21, T. Davidek127, N. Davidson86, R. Davidson71, E. Davies118,d, M. Davies93,
O. Davignon78, A.R. Davison77, Y. Davygora58a, E. Dawe142, I. Dawson139, R.K. Daya-Ishmukhametova23, K. De8,
R. de Asmundis102a, S. De Castro20a,20b, S. De Cecco78, J. de Graat98, N. De Groot104, P. de Jong105,
C. De La Taille115, H. De la Torre80, F. De Lorenzi63, L. de Mora71, L. De Nooij105, D. De Pedis132a,
A. De Salvo132a, U. De Sanctis164a,164c, A. De Santo149, J.B. De Vivie De Regie115, G. De Zorzi132a,132b,
W.J. Dearnaley71, R. Debbe25, C. Debenedetti46, B. Dechenaux55, D.V. Dedovich64, J. Degenhardt120,
C. Del Papa164a,164c, J. Del Peso80, T. Del Prete122a,122b, T. Delemontex55, M. Deliyergiyev74, A. Dell’Acqua30,
L. Dell’Asta22, M. Della Pietra102a,j, D. della Volpe102a,102b, M. Delmastro5, P.A. Delsart55, C. Deluca105,
S. Demers176, M. Demichev64, B. Demirkoz12,l, J. Deng163, S.P. Denisov128, D. Derendarz39, J.E. Derkaoui135d,
F. Derue78, P. Dervan73, K. Desch21, E. Devetak148, P.O. Deviveiros105, A. Dewhurst129, B. DeWilde148,
S. Dhaliwal158, R. Dhullipudi25 ,m, A. Di Ciaccio133a,133b, L. Di Ciaccio5, C. Di Donato102a,102b, A. Di Girolamo30,
B. Di Girolamo30, S. Di Luise134a,134b, A. Di Mattia173, B. Di Micco30, R. Di Nardo47, A. Di Simone133a,133b,
R. Di Sipio20a,20b, M.A. Diaz32a, E.B. Diehl87, J. Dietrich42, T.A. Dietzsch58a, S. Diglio86, K. Dindar Yagci40,
J. Dingfelder21, F. Dinut26a, C. Dionisi132a,132b, P. Dita26a, S. Dita26a, F. Dittus30, F. Djama83, T. Djobava51b,
M.A.B. do Vale24c, A. Do Valle Wemans124a,n, T.K.O. Doan5, M. Dobbs85, D. Dobos30, E. Dobson30,o, J. Dodd35,
C. Doglioni49, T. Doherty53, T. Dohmae155, Y. Doi65,∗, J. Dolejsi127, I. Dolenc74, Z. Dolezal127, B.A. Dolgoshein96,∗,
M. Donadelli24d, J. Donini34, J. Dopke30, A. Doria102a, A. Dos Anjos173, A. Dotti122a,122b, M.T. Dova70,
A.D. Doxiadis105, A.T. Doyle53, N. Dressnandt120, M. Dris10, J. Dubbert99, S. Dube15, E. Duchovni172,
G. Duckeck98, D. Duda175, A. Dudarev30, F. Dudziak63, I.P. Duerdoth82, L. Duflot115, M-A. Dufour85, L. Duguid76,
M. D¨uhrssen30, M. Dunford58a, H. Duran Yildiz4a, M. D¨uren52, R. Duxfield139, M. Dwuznik38, F. Dydak30,
W.L. Ebenstein45, J. Ebke98, S. Eckweiler81, K. Edmonds81, W. Edson2, C.A. Edwards76, N.C. Edwards53,
W. Ehrenfeld42, T. Eifert143, G. Eigen14, K. Einsweiler15, E. Eisenhandler75, T. Ekelof166, M. El Kacimi135c,
M. Ellert166, S. Elles5, F. Ellinghaus81, K. Ellis75, N. Ellis30, J. Elmsheuser98, M. Elsing30, D. Emeliyanov129,
R. Engelmann148, A. Engl98, B. Epp61, J. Erdmann54, A. Ereditato17, D. Eriksson146a, J. Ernst2, M. Ernst25,
J. Ernwein136, D. Errede165, S. Errede165, E. Ertel81, M. Escalier115, H. Esch43, C. Escobar123, X. Espinal Curull12,