Supplemental Information
ForVariation of the Optical Properties of Soot as a Function of Particle
Mass
Ramin Dastanpoura*, Ali Momenimovahedb, Kevin Thomsonb, Jason Olfertc, Steven Rogaka
a
Department of Mechanical Engineering, University of British Columbia, Vancouver, British Columbia, Canada
b
Measurement Science and Standards, National Research Council, Ottawa, Ontario, Canada
c
Department of Mechanical Engineering, University of Alberta, Edmonton, Alberta, Canada
*
SI.1. Effective density measurements
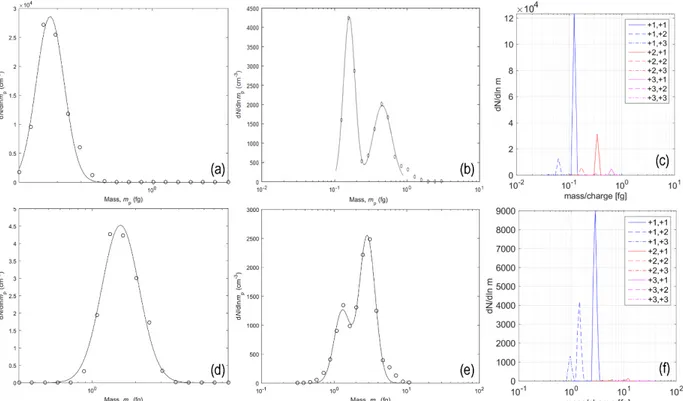
As discussed in section 2.6 of the main article, in order to reduce the influence of the multiple charging probability on the effective density measurements, a tandem-neutralizer configuration was used in this study. Sample mass distributions of the mobility-classified particles measured with CPMA in both single-neutralizer and tandem-neutralizer are illustrated and compared to the predictions of the NNLS program in Figure SI.1. Panels a and d show the CPMA scans for 80 nm and 280 nm mobility-classified particles using single neutralizer configuration, respectively. Panels b and e represent CPMA scans for 80 nm and 280 nm mobility-classified particles using tandem neutralizer configuration, respectively. Finally, panels c and f represent the estimated mass distributions produced by NNLS for 80 nm and 280 nm mobility-classified particles, respectively. These distributions are calculated combining size distribution and effective density results with the application of Fuchs charging probabilities. First and second numbers in the legends of panels c and f correspond to the number of the elementary charges particles carry downstream of the first and second neutralizers, respectively.
Figure SI.1: Mass distribution of size classified particles produced in N2-diluted operating condition using single and tandem neutralizer, and derived from combined size distributions and effective density
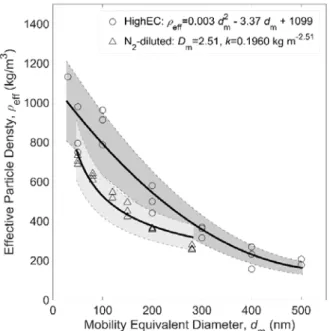
As discussed in section 3.3 of the main article, as an alternative to commonly used power law regression, a second order polynomial equation was fitted to the High EC effective density. The results of this regression are illustrated in Figure SI.2.
Figure SI.2: Effective density versus diameter obtained for High EC and N2-diluted operating conditions SI.2. Size and mass distribution of particles classified based on mass-to-charge ratio
As discussed in sections 2.6 and 3.4 in the main article, size distribution of the particles classified based on their mass-to-charge ratio was measured downstream of the CPMA. Left panel of Figure SI.3 illustrates the size distribution of particles with mass-to-charge ratios of 0.32 (fg/C) and 0.08 (fg/C) produced at High EC operating condition. Combining effective densities and size distribution measurements, mass distributions were calculated for these classified particles (right panel of Figure SI.3). As shown in this figure, changes of the value of mass-to-charge ratio result in considerable change in both mobility and mass distributions downstream of the CPMA. Mass distributions are considerably further separated compared to the mobility distributions.
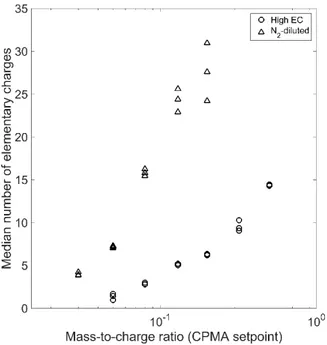
Figure SI.3: Size distribution (left panel) and mass distribution (right panel) of the particles downstream of the CPMA operated at mass-to-charge ratios of 0.32 and 0.08 at HighEC operating condition. Particles passing through UDAC gained high number of charges. The median number of elementary charges particles gain at each operating condition of the CPMA (mass-to-charge ratio) is illustrated in Figure SI.4.
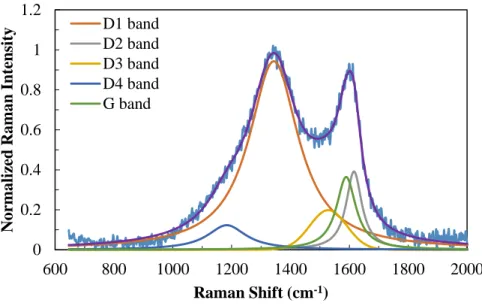
SI.3. Raman Spectrums
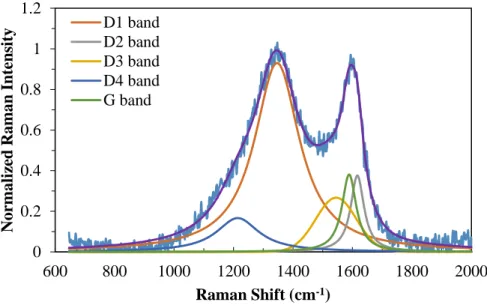
Normalized average Raman spectra and corresponding four Lorentzian- and one Gaussian-shaped fitted bands of the size classified particles produced at High EC operating condition are illustrated in Figures SI.5 to SI.7.
Figure SI.5: Normalized average Raman spectra and 5 band fits for High EC particles of 𝑑𝑑m=125 nm
Figure SI.6: Normalized average Raman spectra and 5 band fits for High EC particles of 𝑑𝑑m=250 nm 0 0.2 0.4 0.6 0.8 1 1.2 600 800 1000 1200 1400 1600 1800 2000 N o rm a li zed R a m a n In ten si ty Raman Shift (cm-1) D1 band D2 band D3 band D4 band G band 0 0.2 0.4 0.6 0.8 1 1.2 600 800 1000 1200 1400 1600 1800 2000 N o rm a li zed R a m a n In ten si ty Raman Shift (cm-1) D1 band D2 band D3 band D4 band G band
Figure SI.7: Normalized average Raman spectra and 5 band fits for High EC particles of 𝑑𝑑m=300 nm 0 0.2 0.4 0.6 0.8 1 1.2 600 800 1000 1200 1400 1600 1800 2000 N o rm a li zed R a m a n In ten si ty Raman Shift (cm-1) D1 band D2 band D3 band D4 band G band