HAL Id: hal-00298992
https://hal.archives-ouvertes.fr/hal-00298992
Submitted on 1 Jan 2002
HAL is a multi-disciplinary open access
archive for the deposit and dissemination of
sci-entific research documents, whether they are
pub-lished or not. The documents may come from
teaching and research institutions in France or
abroad, or from public or private research centers.
L’archive ouverte pluridisciplinaire HAL, est
destinée au dépôt et à la diffusion de documents
scientifiques de niveau recherche, publiés ou non,
émanant des établissements d’enseignement et de
recherche français ou étrangers, des laboratoires
publics ou privés.
Nearest neighbour models for local and regional
avalanche forecasting
M. Gassner, B. Brabec
To cite this version:
M. Gassner, B. Brabec. Nearest neighbour models for local and regional avalanche forecasting. Natural
Hazards and Earth System Science, Copernicus Publications on behalf of the European Geosciences
Union, 2002, 2 (3/4), pp.247-253. �hal-00298992�
Natural Hazards and Earth System Sciences (2002) 2: 247–253 c
European Geosciences Union 2002
Natural Hazards
and Earth
System Sciences
Nearest neighbour models for local and regional avalanche
forecasting
M. Gassner and B. Brabec
WSL, Swiss Federal Institute for Snow and Avalanche Research, SLF Fl¨uelastr. 11, CH-7260 Davos, Switzerland Received: 20 September 2001 – Accepted: 10 January 2002
Abstract. This paper presents two avalanche forecasting
ap-plications NXD2000 and NXD-REG which were developed at the Swiss Federal Institute for Snow and Avalanche Re-search (SLF). Even both are based on the nearest neighbour method they are targeted to different scales. NXD2000 is used to forecast avalanches on a local scale. It is operated by avalanche forecasters responsible for snow safety at snow sport areas, villages or cross country roads. The area covered ranges from 10 km2up to 100 km2depending on the climato-logical homogeneity. It provides the forecaster with ten most similar days to a given situation. The observed avalanches of these days are an indication of the actual avalanche dan-ger. NXD-REG is used operationally by the Swiss avalanche warning service for regional avalanche forecasting. The Nearest Neighbour approach is applied to the data sets of 60 observer stations. The results of each station are then compiled into a map of current and future avalanche hazard. Evaluation of the model by cross-validation has shown that the model can reproduce the official SLF avalanche forecasts in about 52% of the days.
1 Introduction
Avalanche Warning has been a key task of the Swiss Federal Institute for Snow and Avalanche Research in Davos (SLF) since it was founded over half a century ago. Thus, it was a key task to develop computer tools to support avalanche fore-casters. Two forecasting tools will be presented here which are both based on the nearest neighbour method.
In the early 1980s Buser (1983) developed NXD, an avalanche forecasting program based on the nearest neigh-bour method. Using NXD, avalanche forecasters see what happened on similar days, i.e., how many avalanches have been observed. The detailed information available helps for planning avalanche reduction work. Further, the program helps to transfer the historical knowledge of an avalanche Correspondence to: M. Gassner ([email protected])
forecaster to his successor. Because of its success (Buser, 1989) NXD was used and further developed at the SLF and at other places (Bolognesi, et al., 1992; Kristensen and Lar-son, 1994; McClung and Tweedy, 1994; Bolognesi and Buser 1995; Kleemayr and Moser, 1998; Bolognesi, 1998). With the increased power of personal computers, we needed a ver-sion based on Windows95. While the method did not change, the technology allowed increased flexibility and statistical analyses. This version, which is based on the old NXD, is called NXD2000. It is now used at several avalanche warn-ing services all over the world.
Another approach of the nearest neighbour method was to use the avalanche warning level instead of the observed avalanches. This allowed one to work up the hazard levels of the ten neighbours and compile the results of each of the 60 observer stations into a map of current and future avalanche hazard. The program based on this method is called NXD-REG and is now part of the program group used operationally at the SLF.
In the first part of this paper the structure of NXD2000, the methods behind it and the rules to properly configure it are presented. The second part explains NXD-REG.
2 NXD2000
NXD2000 has essentially the same functionality as NXD developed by Buser (1983). It searches a database for the nearest neighbours and provides the user with comprehen-sive information about those neighbours. It does not evaluate a warning level.
Flexibility is the main goal of the new program. It is adapt-able to any region and to different uses, such as in a snow sport area, for road safety, or village protection. It can even be applied to different subjects besides avalanches, such as forest fires, debris flow or ski gliding research. NXD2000 is a database program and features queries. For example, the user can query the database for any kind of information about explosives use, avalanche types, or avalanche
charac-248 M. Gassner and B. Brabec: Nearest neighbour models for avalanche forecasting
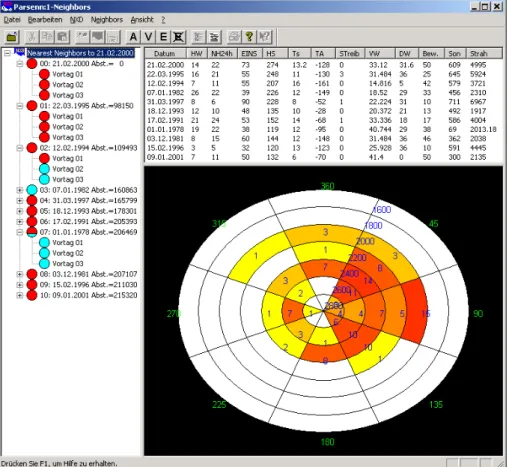
Fig. 1. Representation of the nearest
neighbors in NXD2000. On the left part the ten nearest neighbors with some of their previous days are shown, on the right top their variables and on the right bottom the aspect altitude diagram of the observed avalanches.
teristics. Results are easily copied into other programs like Word or Excel. Persons familiar with Windows95 can easily use the program because it has a similar interface. Figure 1 shows the representation of the nearest neighbours with com-prehensive information of the observed avalanches.
2.1 Methods 2.1.1 Variables
The set of variables used is primarily the one Obled and Good (1980) selected for their test at the snow sport area Parsenn, Davos, Switzerland, because they are crucially con-nected with avalanche occurrence. However, not all of these variables are measured at every site. From the available vari-ables we primarily chose those which describe or influence the snow pack. McClung and Tweedy (1993) correlated in-dividual variables with an avalanche-occurrence index, and Boyne and Williams (1992) analyzed the influence of mete-orological variables on avalanche formation, and their work forms a basis for the selection of the variables.
2.1.2 Elaborate variables
The concept of elaborate or explanatory variables was first described by Obled and Good (1980) and has been expanded since more functionality is currently available. Variables from previous days (so-called “predays”) are used to
calcu-late “elaborate” variables. They constitute an attempt to in-troduce physical knowledge about the assumed underlying phenomena and the experience of the forecaster. Changing from raw data to evaluated variables should involve a sub-stantial increase of information. For instance, a day is char-acterized by its daily amount of precipitation. However, the quantity of fresh snow accumulated during a storm sequence is not redundant. As another example, Settlement (St ), an important factor to snow stability, is hard to measure but easy to calculate using snow height (H S0for the actual day, H S−1
for the first preday) and fresh snow (N S0):
St0=H S0−H S−1+N H0. (1)
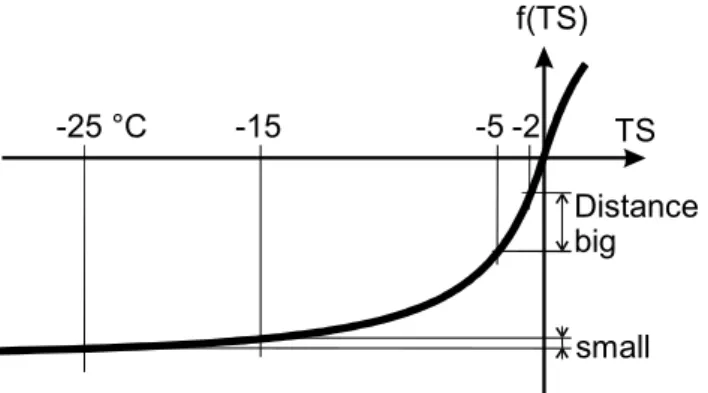
It is clear that derived or threshold variables may also rep-resent non-linear effects rather than linear phenomena. Kris-tensen (1994) noted that some variables have critical transi-tions, such as temperature, wind speed and snow height. Due to the increased functionality of the new program, variables can be transformed such that small differences of values in critical transitions lead to large distances, whereas large dif-ferences of values outside lead to small distances. For exam-ple, snow temperature (T S) is important in the range right below the freezing point, but not at very low temperatures. The desired transformation can be calculated using a hyper-bolic tangent function (see Fig. 2):
M. Gassner and B. Brabec: Nearest neighbour models for avalanche forecasting 249
TS
f(TS)
-2
-5
-15
-25 °C
Distance
big
small
Fig. 2. Snow temperature is more heavily weighted right belowfreezing point than at very low temperatures.
A similar function applies to air temperature and snow height. If snow height (H S) is low, no avalanches will oc-cur even during large snowfalls because terrain roughness anchors the snow. Therefore a function is used to calculate a transformed snow height (H S0), which follows the snow height as long as it is below surface roughness (Sr) but does not become larger than this value. Days with snow height well above surface roughness will almost get equal whereas days with snow height below surface roughness can be sepa-rated:
H S0=tanh((H S − Sr) · sp) + 1. (3) The constant sp defines the sharpness of the separation, and is arbitrarily chosen to be 0.03. Snow drift is a key fac-tor in avalanche formation. Lacking a simple equation for a snow drift index, we used the following formula, where the subscript −i represents the preday:
Sd−i =V−i2 ·(1 + N S−i). (4)
The equation is based on our knowledge that the force of the wind increases by the square of the speed, and the more it snows the bigger is the snow drift. If it does not snow, at high wind speeds still there will still be snow drift. The total snow drift index (Sd) is the sum of the indices from the current day and the two predays weighted by 0.1 and 0.01:
Sd = Sd0+0.1 · Sd−1+0.01 · Sd−2. (5)
Some observers have found a dependency of the snow drift to the 3rdpower of wind speed, with a threshold wind speed of 5 m/s (Dyunin and Kotlyakov, 1980). However, changing the relation to the 3rd power of wind speed did not improve
the quality of the nearest neighbours, so we used the original equation. Still, there is a need for a more physically based formula.
All elaborate variables are multiplied by constants so their standard deviations are similar. This ensured that elaborate variables with small variations have the same effect on the re-sults as those with large variations when the variable weights are changed.
2.1.3 Nearest neighbours
The elaborate variables span an n-dimensional space, in which each day is represented by a point. To find the neigh-bours we have to define a measure, that the distance between two points (days) can be calculated. We use the weighted measure: d = s X i≤n pi1xi2, (6)
where pi is the weight of the elaborate variable i. Usually
1means the difference, except when the elaborate variable represents a direction. In this case the difference between day l and day m is calculated as follows:
1 =min (|xil−xim|,360 − |xil−xim|) . (7)
The elaborate variables are not orthogonal. If two elabo-rate variables are correlated, we can take care of this using the weighting vector.
Like Buser (1983), we chose the model to select ten near-est neighbours. The theoretical optimal number of neigh-bours ranges from 8 to 30, depending on the number of days in the data file and the number of elaborate variables. 2.1.4 Observations
Avalanche forecasters want to know whether avalanches are likely on a certain slope, and, the size and type of the slides. Therefore, avalanche observations should contain informa-tion on size, locainforma-tion, type and damage, as well as acinforma-tions of avalanche control. Such classifications are important since they allow the forecaster to get comprehensive information about the nearest neighbours. Besides the detailed mation about what happened on a certain day, such infor-mation facilitates statistical analyses of the avalanche activ-ity and explosive control work in the area over several sea-sons. In Switzerland the avalanche information recorded in NXD2000 follows the standard reporting form used by the SLF. In the USA avalanche data follows the standard U.S. avalanche classification for size, type, areal extent, and other characteristics (Perla and Martinelli, 1978; McClung and Schaerer, 1993).
2.2 Problems
There are several problems that restrict the use of the nearest neighbour method:
– Missing observations: Calculations of elaborate
vari-ables require several predays, so missing measurements lead to gaps. For example, if there are no measurements on Sunday, no nearest neighbour search is possible until Wednesday, when fresh snow accumulated during the three predays is used as an elaborate variable.
– Sharp changes of variables within time period of
250 M. Gassner and B. Brabec: Nearest neighbour models for avalanche forecasting
are used. However, conditions connected with snow sta-bility can change dramatically within a few hours. This may result in a false impression of the avalanche prob-ability (Kristensen, 1994). Shorter periods cannot be used, because the length of the period is determined by practical considerations like to what degree it is possible to monitor avalanche occurrences continuously. With automatic observation stations snow and weather data are available more frequently, which may in the future allow us to extract trends from these time series.
– Missing or imprecise avalanche observations: To ensure
the quality of the nearest neighbour search, avalanche observations must be reliable and complete. Days with-out observation should be marked, so neighbours are not misinterpreted as good days. This also should be kept in mind when interpreting the neighbours. There may be days without avalanches simply because nobody recorded them, such as New Years Eve or foggy and stormy days. Other problems are days at the beginning of the snow sport season when no avalanche control was performed. Finally, any wrong or imprecise inputs may lead to misinterpretation of the neighbour day found.
– Homogeneity of data and observations: Changes in the
location or the method of weather and snow measure-ments might interrupt the time series or lead to data inconsistencies to which the model is sensitive. If the changes are too large, the older data cannot be used. In the best case the old and the new series overlap, and multiple regression analyses can be used to derive a cor-rection function.
Over the years there are changes in the avalanche con-trol. This changes the time and quantity of the avalanche activity, which has to be considered when analyzing the neighbours.
– Definition of an avalanche day: One of the main
ques-tions is: What makes an avalanche day? It is not clear whether an avalanche 400 m long is twice as danger-ous as one 200 m long or if a day with ten observed avalanches is twice as dangerous as one with only five. It could also be argued that, in a tourist area, one avalanche on a clear day is potentially more dangerous than several avalanches during stormy weather. Here it is defined as at least one avalanche per day. No distinc-tion is made between catastrophic avalanches and harm-less small snow glides. However, the danger depends on the site: in a snow sport area one small slab might be fa-tal, whereas the same slab along a mountain pass road would not be noticed.
– Avalanche control work performed on the previous
days: During snowfall periods the avalanche danger increases with the amount of fresh snow. Launching avalanches reduces the danger that cross country roads or snow sport areas can be open. The program does not take into account avalanche control work on previous
days. The avalanche forecaster has to check the neigh-bour days found for such situations and adjust the rating (Gassner et al., 2000).
2.3 Optimization
When installing NXD2000 at a new site, it is important to se-lect the elaborate variables and set their weights. Depending on the available variables, the elaborate variables are cho-sen as described above. The formulas need to be adjusted because the location of the measuring station relative to the starting zones is different at each site. Initially, weights need to be set according to their correlation to avalanche days. In a second step the experience of the local avalanche expert is introduced, i.e. if wind is the dominant cause for avalanches, then wind variables should be weighted more. Currently, there is no method to optimize the weights other than trial and error, where the local avalanche expert suggests which weight to increase or decrease when looking at days with a suspicious number of avalanche neighbours. Occasionally, there might be the need to add a new elaborate variable, when some of the suspicious neighbours have similar characteris-tics.
NXD2000 can search the neighbours for all days in the database at once. This enables a calculation of overall model performance by determining the following values:
1. For all the days in the database that have avalanches, the mean number of neighbours that have avalanches, the range (maximum and minimum number of neighbours with avalanches), and the standard deviation.
2. For all days in the database without avalanches, the mean number of neighbours with avalanches, the range, and the standard deviation.
With this analysis there are two primary goals. First, for days with avalanches we want to maximize the number of neigh-bour days that also have avalanches. Likewise, for days with-out avalanches, we want to minimize the number of neigh-bours with avalanches. After trying new weights the user can quickly evaluate changes in model performance. Sec-ond, we want to give the avalanche worker an idea of how many neighbours would tend to indicate that a particular day would have avalanches. For example, we can tell the model user that, on average, a day with avalanches usually has four or more neighbours with avalanches. However, the user still must be aware of that some days with avalanches have no neighbours with avalanches.
At the snow sport area Parsenn, Davos Switzerland, where data of 32 winters is stored, in the mean NXD shows 4.1 neighbour days with avalanches for a day with avalanches and 1.6 neighbour days with avalanches for a day without avalanches. The median is 4 neighbours for a day with and 1 for a day without avalanches. The latter number is high. One of the reasons might be that in the records there are days before the start of the season on which no avalanche control was performed but weather data was inserted. At the snow
M. Gassner and B. Brabec: Nearest neighbour models for avalanche forecasting 251
0 1
0 2 4 6 8 10
number of avalanche days
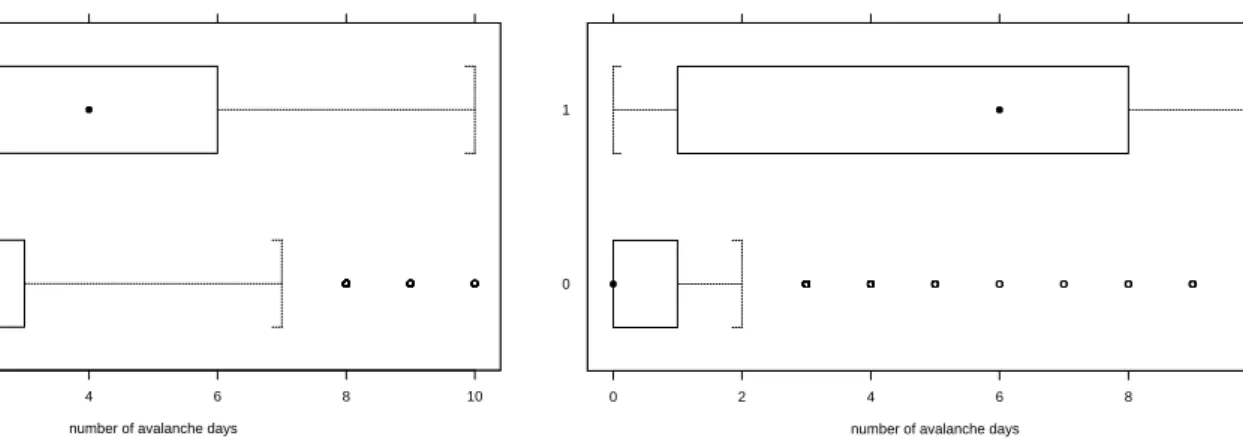
Fig. 3. Box plots of the number of avalanche days in the
near-est neighbors at Parsenn, Davos, Switzerland. The upper is for avalanche days, the lower for days without avalanches.
sport area Snowbasin, Utah, USA where data of 15 win-ters is stored, NXD shows in the mean 4.9 neighbour days with avalanches for a day with avalanches and 0.8 neighbour days with avalanches for a day without avalanches. The me-dian is 6 neighbours for a day with and 0 for a day without avalanches. The corresponding box plots are shown in Figs. 3 and 4. These results are encouraging. However, the many outliers have to be investigated. A first look at these days indicates that the definition of an avalanche day has to be revised since only one or two small slabs were observed on most of the days with avalanches that have almost no neigh-bours with avalanches.
3 NXD-REG
NXD-REG is targeted to calculate a avalanche hazard map for the whole area of the Swiss alps. Since long records of avalanche observations are only available at some sites but not throughout Switzerland NXD-REG uses the avalanche hazard forecasted at the SLF. According to verification stud-ies (Fhn and Schweizer, 1996; Brabec and Stucki, 1998; Har-vey, unpublished) we can assume the hazard estimations to be correct for about 70% of the days. This allows us to apply NXD-Reg for each of the weather stations in Switzerland. The database for the development of our regional model consists of measurements and observations from ten winters (1987/88 to 1996/97) for 59 stations of the Swiss observa-tion network. The selecobserva-tion of the staobserva-tions has been done in cooperation with the SLF avalanche warning service: only stations with a complete 10-year dataset and no important change in measurement location were selected. This ensures the homogeneity of the dataset. In contrast to many other avalanche forecasting models we use the official, convention-ally estimated hazard levels as dependent variable. We refer to the description of Meister (1994) for the conventional es-timation of hazard levels.
0 1
0 2 4 6 8 10
number of avalanche days
Fig. 4. Box plots of the number of avalanche days in the nearest
neighbors at Snowbasin, Utah, USA. The upper is for avalanche days, the lower for days without avalanches.
3.1 Architecture
The calculation of an avalanche hazard map is handled in two steps: First for each station a local nearest neighbour model similar to NXD2000 is applied. From the conventionally es-timated hazard levels at the most similar days a continuous hazard value and a hazard level are produced. Second be-tween the local estimations a regional interpolation is done. Finally the final hazard level is estimated for each of about 100 sub-areas of Switzerland.
3.1.1 Local nearest neighbour model: NXD-VG
Because of the success of nearest neighbour models in local avalanche forecasting, we have decided to adopt the nearest neighbour approach for our dataset. We adapted the NXD model as suggested by Buser (1983) for regional avalanche forecasting and called it NXD-VG. Swiss observational data (e.g. Gliott and F¨ohn, 1989) are used operationally. We added two elaborated parameters: the 3-day-sum of new snow and a 1-day difference of air temperature. No fur-ther transformations are used. Model output is the estimated hazard level according to the European avalanche hazard scale. The hazard level is calculated by averaging results from the 10 nearest neighbours and applying decision bound-aries. The distance is calculated using a Euclidean weighted distance metric. The weights have been estimated by the SLF avalanche warning service.
The result of NXD-VG is given in table-form for each station: meteo and snow parameters, date of the 10 nearest neighbours, result of the distance calculation and the original avalanche bulletins are presented to the avalanche forecaster. 3.1.2 Regional interpolation
Between the stations inverse distance weighted interpolation is used for the calculation of hazard levels on a 1 km grid. This method allows one to calculate hazard levels even in areas with no stations or at the border. However, climatolog-ical boundaries are not taken into account. The result of the
252 M. Gassner and B. Brabec: Nearest neighbour models for avalanche forecasting
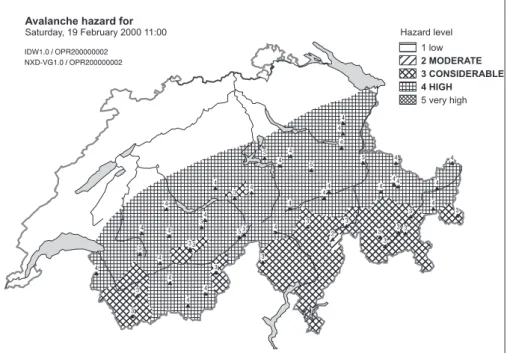
Fig. 5. Result of NXD-REG for 19 February 2000.
spatial interpolation is shown together with the local, aver-aged hazard values and the decision boundaries on a map. For constructing daily maps of the avalanche hazard, the avalanche warners get an individual avalanche hazard esti-mation for each of 100 subareas of Switzerland. NXD-REG estimates the hazard level for each subarea by averaging all pixels within the area and applying the same decision bound-aries as locally. Figure 5 shows a typical result of NXD-REG as it can be used for constructing a new avalanche bulletin. On a map of Switzerland the avalanche hazard calculated for each station as well as each subarea is shown.
3.2 Evaluation
For the stations Davos Weissfluhjoch and Davos Fl¨uelastrasse, a complete cross-validation for the 10 winters has been calculated. Each winter has been excluded from the historic database and then forecasted by the rest of the data.
In 52% of the days the cross-validated hazard levels were in agreement with the conventionally estimated hazard lev-els. In 96%, the difference was within one hazard level. The error distribution is fairly symmetric. For different winters the performance of NXD-VG varies between 49% and 61%.
4 Conclusions and outlook
The nearest neighbour method has proven to be a useful method to support the forecasting of avalanche danger. The different scales of NXD2000 and NXD-REG demonstrate that it can be widely applied.
NXD2000 is a very useful tool for local avalanche fore-casters. It provides them with detailed information about the
neighbour days. The forecaster can compare his own inves-tigation with the situations shown in the nearest neighbour days. This helps him to verify his own analyses and, if nec-essary, complete or revise the planned avalanche reduction work. Since NXD2000 is easily adaptable to new sites and to the needs of the forecasters it already gained popularity all over the world and is operational at more than 25 sites. The calculation of elaborate variables makes it easy to de-rive functions which describe avalanche formation more pre-cisely than the raw variables. They allow the user to intro-duce physical knowledge and the experience of the avalanche forecaster into the nearest neighbour search. Together with improved optimization methods it might be possible to verify and in a very optimistic view to find new rules on avalanche formation. However, NXD2000 provides good support to the avalanche forecaster only when sufficient and continuous data records are available. It can not provide any help at sites which start data recording. In this situation, using NXD2000 in combination with a rule based system will be helpful. The hazard maps calculated with NXD-REG allow the avalanche warning team at the SLF to build the avalanche bulletins be-cause its analyses and forecasts are rather precise. It will be extended by input data from automatic weather stations, snow cover stability and output from NXD2000. Further-more, several other approaches for statistical models will be applied to the task of regional avalanche forecasting.
References
Boyne, H. S. and Williams, K.: Analyses of avalanche prediction from meteorological data at Berthoud Pass, Colorado, in: Pro-ceedings of the international snow science workshop, Brecken-ridge USA, 229–235, 1992.
M. Gassner and B. Brabec: Nearest neighbour models for avalanche forecasting 253
Bolognesi, R., Buser, O., and Good, W.: The NX-LOG project, in: Proceedings of the international snow science workshop, Beck-enridge USA, 1992.
Bolognesi, R. and Buser, O.: Merging data analysis and symbolic calculation into a diagnostic system for natural hazards, in: Pro-ceedings of the international emerging management and engi-neering conference, San Diego, USA, 1995.
Bolognesi, R.: NivoLogTM: an avalanche forecast system, in: Pro-ceedings of the international snow science workshop, Sunriver, USA, 412–418, 1998.
Brabec, B. and Stucki, Th.: Verification of avalanche bulletins by questionaires, in: Hestnes, E., (ed.), 25 Years of snow avalanche research, Voss 12–16 May 1998, Proceedings, Oslo, Norwegian Geotechnical Institute, 79–83 (NGI Publication 203), 1998. Buser, O.: Avalanche forecast with the method of nearest
neigh-bours: an interactive approach, Cold Reg. Sci. Technol., 8, 155– 163, 1983.
Buser, O.: Two years experience of operational avalanche forecast-ing usforecast-ing the nearest neighbours method, Ann. Glaciol., 13, 31– 34, 1989.
Dyunin, A. K. and Kotlyakov, V. M.: Redistribution of snow in the mountains under the effect of heavy snow-storms, Cold Reg. Sci. Technol., 3, 4, 287–294, 1980.
Gassner, M., Birkeland, K., Etter, H. J., and Leonard, T.: NXD2000: an improved avalanche forecasting program based on the nearest neighbour method, in: Proceedings of the international snow sci-ence workshop, Big Sky USA, 52–59, 2000.
Gliott, S. and F¨ohn, P.: Handbuch f¨ur beobachter, Interner Bericht 637, Eidg. Institut f¨ur Schnee- und Lawinenforschung, 1989. Kleemayr, K. and Moser, A.: NAFT new avalanche
forecast-ing technologies (neue lawinenprognosemodelle), Forschung im Verbund 40, 1998.
Kristensen, K. and Larsson Ch.: An avalanche forecasting program based on a modified nearest neighbour method, in: Proceedings of the international snow science workshop, Snowbird USA, 22– 30, 1994.
McClung, D. M. and Schaerer, P.: The avalanche handbook, Seatle, WA, The mountaineers, 1993.
McClung, D. M. and Tweedy, J.: Characteristics of avalanching: Kootenay Pass, British Columbia, Canada, J. Glaciol., 39, 132, 316–322, 1993.
McClung, D. M. and Tweedy, J.: Numerical avalanche prediction: Kootenay Pass, British Columbia, Canada, J. Glaciol., 40, 135, 350–358, 1994.
Meister, R.: Country-wide avalanche warning in Switzerland, ISSW’94 proceedings, 58–71, 1994.
Obled, Ch. and Good, W.: Recent developments of avalanche fore-casting by discriminant analyses techniques: a methodologi-cal review and some applications to the parsenn area (Davos, Switzerland), J. Glaciol., 25, 92, 315–346, 1980.
Perla, R. I. and Martinelli, M. M.: The avalanche handbook, USDA Forest Service Handbook, 489, 1978.
Schweizer J. and F¨ohn, P.: Avalanche forecasting – an expert system approach, J. Glaciol., 42, 141, 318–332, 1996.