HAL Id: hal-01082857
https://hal.sorbonne-universite.fr/hal-01082857
Submitted on 18 Nov 2014
HAL is a multi-disciplinary open access
archive for the deposit and dissemination of
sci-entific research documents, whether they are
pub-lished or not. The documents may come from
L’archive ouverte pluridisciplinaire HAL, est
destinée au dépôt et à la diffusion de documents
scientifiques de niveau recherche, publiés ou non,
émanant des établissements d’enseignement et de
Determination of resistivity profiles in anti-corrosion
coatings from constant-phase-element parameters
Marco Musiani, Mark E. Orazem, Nadine Pébère, Bernard Tribollet, Vincent
Vivier
To cite this version:
Marco Musiani, Mark E. Orazem, Nadine Pébère, Bernard Tribollet, Vincent Vivier. Determination
of resistivity profiles in anti-corrosion coatings from constant-phase-element parameters. Progress
in Organic Coatings, Elsevier, 2014, 77 (12), pp.2076-2083. �10.1016/j.porgcoat.2013.12.013�.
�hal-01082857�
Determination of Resistivity Profiles in Anti‐Corrosion Coatings from Constant‐Phase‐Element Parameters
M. Musiania, M. E. Orazemb, N. Pébèrec, *, B. Tribolletd, V. Vivierd
a Istituto per l’Energetica e le Interfasi, Consiglio Nazionale delle Ricerche,35127 Padova, Italy b Department of Chemical Engineering, University of Florida, Florida 32611, USA c Université de Toulouse, CIRIMAT, UPS / INPT / CNRS, ENSIACET, 4, allée Emile Monso – BP 44362, 31030 Toulouse cedex 4, France d Laboratoire Interfaces et Systèmes Electrochimiques, UPR 15 du CNRS, Université Pierre et Marie Curie, 75252, Paris cedex 05, France Abstract A recently proposed model which explains the CPE response exhibited by metal/coating/electrolyte systems as the result of power‐law dependences of the coating resistivity and permittivity along their thickness is revisited and applied to three different coating/electrolyte combinations. It is shown that resistivity profiles may be determined, and their evolution with the time of exposure may be followed. The effect of the assumptions made on coating and electrolyte resistivity on the regressed parameters is discussed and the factors which affect the reliability of the measured water uptake are highlighted. It is shown that both the composition of the coating and that of the test solutions influence the time dependence of the coating performance. Keywords: CPE; electrolyte uptake; impedance modeling; pores. * Corresponding author. Phone: 00 33 5 34 32 34 23 Fax: 00 33 5 34 32 34 99 E‐mail: [email protected] (Nadine Pébère)
1. Introduction Electrochemical impedance spectroscopy is a popular technique for the assessment of the corrosion protection performance of organic coatings. The analysis of impedance data is often based on the equivalent circuit proposed by Beaunier et al. [1] in which the coating capacity and the double layer capacity are replaced by constant phase elements (CPE), the impedance of which is Z = 1/(j)Q. Substitution of CPEs for capacities may strongly improve the quality of the fitting between the experimental data and the equivalent circuit, but creates ambiguities in the physical interpretation of the results, since Q cannot be simply identified with the coating capacity [2] and cannot be directly used to calculate the water uptake in the coating through the Brasher and Kingsbury [3] approach. Various formulas have been proposed for the calculation of the effective capacity from CPE parameters [4,5], but their application requires knowledge of the physical origin of the CPE behavior [2,6]. In a recent paper [7], our group has shown that the CPE behavior observed in the impedance of a coated system may be explained by an inhomogeneous electrolyte uptake if (i) the electrolyte volume fraction decreases from the coating/electrolyte interface to the metal/coating interface according to a power‐law and (ii) the resistivity and permittivity of the system are calculated using effective medium theory formulas corresponding to a parallel combination of coating material and electrolyte. This model, henceforth briefly called “power‐law model” was compared to experimental data obtained with a hybrid sol‐gel coating exposed to a 0.5 M NaCl solution. It was concluded that, as a result of the progressive electrolyte uptake for increasing exposure time, the resistivity of the coating markedly decreased (after one week, the decrease at the coating/electrolyte interface attained ca. 6 orders of magnitude, with respect to the dry coating), while its permittivity remained practically unchanged. Furthermore, it was shown that the number and/or section of the through pores, i.e. pores as deep as the whole coating thickness, directly connecting the electrolyte with the metal underneath the coating through a low‐resistance path, increased with exposure time. These results allowed the extension of a previously derived model [8,9] applied so far to passive oxides and human skin [10], to anti‐corrosion coatings. The present paper aims at extending the investigation described in [7], focusing mainly on three issues: (i) the effect of the assumptions made on coating and electrolyte resistivity on the regressed parameters; (ii) the analysis of the relative amounts of electrolyte within through and short pores; (iii) the analysis of experimental
data relevant to other coating/electrolyte combinations, based on the power‐law model, and a discussion of the different behavior of different systems. 2. Experimental A description of the coatings, their method of preparation, and the electrochemical techniques used for their characterization are presented in this section. 2.1. Hybrid sol‐gel coatings Two coatings were prepared. For both systems, the organosiloxane sol was prepared by using 3‐ glycidoxypropylethoxysilane (GLYEO), tetraethylorthosilicate (TEOS) and butanol. A first solution was made by adding a polyaminoamide (PAA) to the sol, with a GLYEO/TEOS/PAA mass ratio of 3:1:2. The solution was prepared with an excess of organosilane, therefore the resulting coating was called O. The process takes advantage of the two moieties of the organosilane molecule (GLYEO). The organic part of the GLYEO reacts with the amine functions of the PAA to develop the organic part of the hybrid coating, while the silane part undergoes the usual hydrolysis and condensation steps of sol‐gel synthesis, to form a silicon‐based network. TEOS was added to increase the coating density. In the second solution, an epoxy compound was added to the first solution, with a GLYEO/TEOS/PAA/Epoxy ratio of 1:1:10:8. Due to the presence of an epoxy in the solution, the resulting coating was called sample E. The addition of the epoxy compound in the liquid sol‐gel resin required a different procedure for mixing together the compounds. For this reason, sample E is not comparable, from a chemical point of view, with sample O. The sol‐gel films did not contain any pigments or fillers. The coatings were deposited onto a 2024 T3 aluminium alloy currently used in the aerospace industry. The specimens consisted of 125 mm × 80 mm × 1.6 mm plates machined from rolled plate. Before painting, the samples were degreased at 60°C (pH = 9) for 15 min, rinsed twice with distilled water, then etched in an acid bath at 52 °C for 10 min, and rinsed again with distilled water. The liquid paints were applied by air spraying and cured at 100°C for 1 h. The coatings thickness was measured at several locations from the observation of the cross‐sections of the samples by SEM and found to have an average value of 20 ± 2 µm. 2.2. Electrochemical impedance measurements
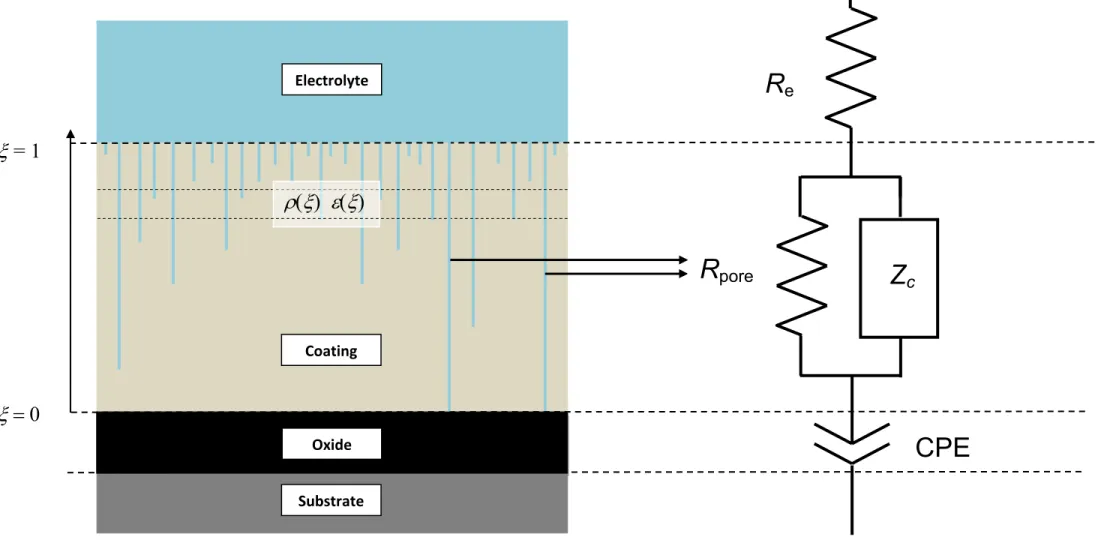
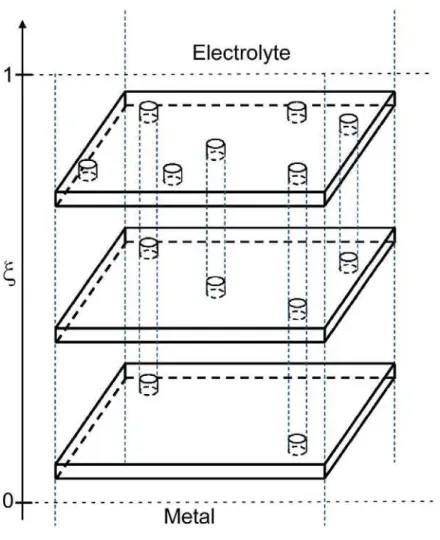
A three‐electrode electrochemical cell was used in which the coated specimen served as the working electrode. A cylindrical Plexiglas tube was assembled on top of the coated sample, exposing a surface area of 24 cm². A large platinum sheet was used as counter‐electrode. A saturated mercury/mercurous sulphate reference electrode was used for electrolytes containing Na2SO4, and a saturated calomel reference electrode was used in electrolytes containing NaCl. The electrochemical cell was open to air and was kept at room temperature with an average value of 17°C and which may have undergone fluctuations by ±2°C. Following our previous work, the resulting variations in the dielectric constant of water were unlikely to have significant effects on the experimental impedance response [9]. Electrochemical impedance measurements were carried out using a Biologic VSP apparatus. The impedance diagrams were obtained under potentiostatic conditions at the corrosion potential over a frequency range of 60 kHz to 10 mHz with 6 points per decade, using a 20 mV peak‐ to‐peak sinusoidal voltage. The electrochemical behaviour of the coatings was characterized in either 0.5 M Na2SO4 or 0.5 M NaCl, for exposure times ranging from 2 h to 168 h. The Na2SO4 solution was used to achieve a better knowledge of the intrinsic properties of the coatings because the evolution of the system was slower than in NaCl solution. The results concerning sample E in the NaCl solution were previously reported in [7]. 3. Model for data analysis The model employed for the data analysis has been previously described [7]; only a brief summary is reported here. A scheme of a substrate/oxide/coating/electrolyte system, and its equivalent circuit, are presented in Fig. 1. The impedance is assumed to consist of three components connected in series: i. the uncompensated electrolyte resistance; ii. the impedance of the coating, discussed below; iii. the impedance of the oxide covering the Al 2024 alloy; this impedance is accounted for by a constant phase element (CPE) and is no longer discussed in the following. The coating is assumed to be penetrated by the electrolyte which fills its pores. These pores are represented in Fig. 1 as being straight, although they may be tortuous and have variable lateral dimension. All pores have a mouth at the coating/electrolyte interface, but only a few (henceforth called “through pores”) are as deep as the coating and reach the coating/oxide interface, providing a low‐resistivity path, with resistance Rpore, between the electrolyte and the oxide. The other pores (henceforth called “short pores”) are less deep than the coating thickness , and thus different planes parallel to the interfaces, located within the coating at different positions x, cross different numbers of pores (see sketch in Fig. 2), and different elemental layers
Mise en forme : Puces et
of the coating, d thick, have different local electrolyte volume fractions (). Such a representation of the electrolyte‐penetrated coating is in agreement with the one proposed by Mišković‐Stanković et al. [11,12] on the basis of optical microscopy coupled with image analysis. The electrolyte volume fraction affects the local resistivity and permittivity of the coating, which are expressed through effective medium theory formulas as 1 1 1 w c ( ) ( ) [1 ( )]
(1) and
( ) w ( ) c[1
( )] (2) where the subscripts w and c refer to the electrolyte and the coating material, respectively. Equations (1) and (2) take into account that, in each elemental layer parallel to the interfaces, each position is occupied by either the coating material or the electrolyte, and so these two media are in parallel to each other. In this approximation it is unimportant whether () is the result of the presence of a large number of smaller pores or a small number of larger pores. However, () does not take into account the water present within the coating as individual molecules interacting with polymeric network and not forming aggregates big enough to allow dissolution of salts and generate a conductive medium. Such polymer‐bounded water has been reported to be a very significant fraction of the total water uptaken by epoxy coatings [11] and to cause strong plasticization of an epoxy/polyamidoamine coating [13]. Therefore, the water uptake determined through the analysis of experimental data by comparison with the model proposed in [7] is likely to be underestimated. In a following section (see 4.1.3), it will be discussed how a lower resistivity of the electrolyte within the pores, as compared to that of the external solution, may be a further cause for underestimating the water uptake. Under assumption that each elemental layer may be represented by a parallel combination of a resistance d and a capacitance d, the impedance of the electrolyte‐penetrated coating (Zc) is calculated as1 c 1 0 0 1 ( ) d ( ) j ( ) Z
(3) The contribution of pores that extend to the oxide surface is included separately from the development of equation (3). The overall impedance Z() of the coating is thereby given by the pore resistance Rpore in parallelwith Zc , i.e. 1 1 1 c pore ( ) ( ) Z
Z
R (4) To account for the progressive variation in the number of pores along the coating thickness, the hypothesis is made that () changes from (0) = 0 at = 0 to () at = 1 according to a power‐law, i.e.,) 1 )( ( 1 ) ( ) (
(5) The coating part corresponding to the impedance Zc contains only "short pores", meaning that no electrolyte reaches the interface between the coating and the oxide and, as a consequence,
0
0
.In reference [7], calculated impedance plots were presented with () and Rpore as parameters. It was shown
that, according to a more general theory reported in [8], Z() corresponded to a CPE behavior, with a CPE
exponent linked to the power‐law exponent by the equation
1 (6)It was shown in [7] that fitting the above described model to experimental data allowed determination of , (), and Rpore, by assuming known or reasonable values for w, c, w and c. The profiles were
calculated by entering the fitted and () values into equation (5); hence, profiles corresponding to different immersion times were obtained through equation (1). These profiles, presented in [7], neglected the through pores, and, therefore, at all immersion times, (0) was identical to c. In the present paper, the
electrolyte content in the through pores is calculated as
pore pore w
pore
film film pore film
V A
V A R A
(7)where V denotes a volume, and A is a surface area (with Rpore normalized to unit surface area and Afilm= 1 cm2).
This allows estimation of the fraction of the uptaken electrolyte that is contained in the through pores and calculation of profiles, taking into account all pores. Owing to the assumed cylindrical geometry of the through pores, Rpore is not a function of position .
The above development retains the meaning of (0) as the resistance of the dry coating, c. As may be seen in
the subsequent discussion of experimental results, the power‐law model does not account adequately for the high‐frequency response. The origin of this discrepancy is, as yet, unknown. A tentative explanation might invoke capacitive interactions between adjacent pores. The regression analysis was therefore performed for frequencies up to an upper limit which, for different systems, varied from 0.5 to 5 kHz (see Figures 3 and 6). 4. Results and Discussion
The results are presented in terms of the influence of assumed values for parameters w, c, w and c on the
fitted parameters, the relative amounts of electrolyte within through and short pores, and the influence of coating formulation and electrolyte composition.
4.1. Effect of w, c, w and c on fitted parameters
Coated samples were prepared, and impedance measurements were performed as described in the
experimental section. For each combination of coating/electrolytic solution/immersion time the experimental data were compared with the model shown in Fig. 1, using a non‐commercial software developed at the LISE CNRS, Paris. This software allowed regression of the model consisting of a combination of passive circuit elements, like Rpore, the electrolyte resistance and the CPE parameters relevant to the oxide film, and the
analytical expression of Zc(), but did not provide confidence intervals for the best fitted parameters. In our previous work [7], it was explained that, owing to the quasi‐capacitive blocking behavior observed at low frequency, the oxide film resistance could be assumed to be very large and therefore its inclusion in the equivalent circuit, in parallel with the CPE, was not necessary. Equally unnecessary were circuit elements accounting for the corrosion reactions, because no sign of corrosion was observed for the immersion times explored in the present investigation.
In the regression procedure, , and Rpore were the only adjustable parameters for the coating; whereas, w,
c, w and c were given fixed values (w = 2.22 × 101 cm, c = 2 × 10 11 cm, w = 82 and c = 8). In our previous paper [7] the effect of the assumed values on the fitted parameters was not discussed. New data and a more detailed discussion are presented below. 4.1.1 Parameters w and c
The permittivities (w and c) are known with rather good precision; furthermore, it has been shown that the
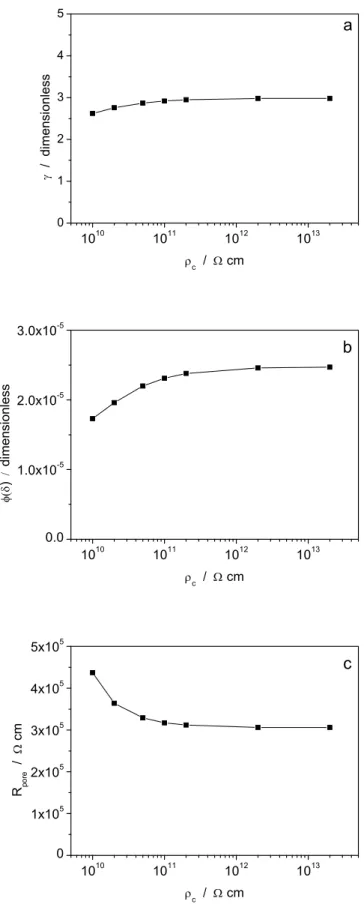
profiles are quite flat and therefore do not affect the impedance of the system in a significant way [9]. 4.1.2 Parameter c The resistivity of the dry coating c is less well‐known. Thus, recognizing that it is important to assess the magnitude of its effect, the model was regressed to the same set of data by assuming in each run a different c value, covering a rather wide range. Figure 3 shows, as an example, an experimental impedance plot, obtained with sample E immersed in 0.5 M NaCl after a 48‐hour immersion time, compared with 7 best fitted diagrams corresponding to c values varying from 1010 cm to 2 × 1013 cm. In all cases, the agreement between
experimental and calculated curves is good at all frequencies (with some differences at frequencies above 5 kHz where, as discussed above, the model is not fully satisfactory). Fig. 4 shows that the fitted parameters ,
and Rpore do not depend on c in a significant way, so long as c > 5 × 10 10 cm. Many polymeric materials have a resistivity higher than this threshold value [14], possibly by some orders of magnitude. For example, a resistivity of 1 × 1015 cm has been reported for a dry nylon film [15]. All the results presented in the following sections were obtained by assuming c = 2 × 10 11 cm, as in our previous study [7] and in other studies [16]. 4.1.3 Parameter w The most obvious assumption about w, made by ourselves in [7] and in the present study and by other authors, e.g. [11], is that it is identical to the resistivity of the electrolytic solution used in the impedance measurement. This implies that the composition of the electrolyte inside the pores should be the same as its bulk composition or, in other words that the water and the ions dissolved in it be incorporated into the coating without any selectivity. Results presented in the literature show that such an assumption might not be correct for all systems. For example, Castela and Simoes [17] mention that the diffusivity of ions is lower than that of water; Hu et al. [18] report that the diffusivity of chloride ion in epoxy coatings is ca. 3 orders of magnitude lower than the diffusivity of water; and, according to Mišković‐Stanković et al. [11], the ratio between the diffusivities of water and chloride ion is slightly higher than 10. Thus, water uptake may precede ions uptake [11,12] , and, so long as equilibrium is not yet reached, the solution in the pores is likely to be less concentrated than the outer solution. It is also quite possible that the composition of the electrolyte within the pores would be a function of immersion time. The chemical nature of the electrolyte, especially its anion, may have important effects on the coating behavior. Duarte et al. [19], using negative‐feedback scanning electrochemical microscope, have observed various topographic changes in coatings due to the water uptake and the ingress of dissolved ions depending on the electrolyte composition. It is noteworthy that the permselective uptake of a solution less concentrated than the bulk solution would have significant consequences on (i) the determination of the values and (ii) the comparison of different electrolytes. Since c is typically 8 to 10 orders of magnitude larger than w, equation (1) reduces to
(
)1
w1
(
) (8)already for very low values. If an incorrectly low w is assumed, the water uptake is underestimated by the
same factor, because larger amounts of less concentrated electrolytic solution are required to achieve a fixed value. The permselectivity effects may be more or less marked for different salts and, thus, may affect the estimated water uptake to a different extent. Mišković‐Stanković et al.[12] reported that the water diffusivity in epoxy coatings did not depend on nature of the anion (chloride, sulfate, naphtol‐3,6‐disulphonate). Since these anions have themselves different diffusivities, different electrolyte concentrations should be found in the
pores of coatings immersed in electrolytes of the same molarity, but with different anions. In turn, different electrolyte concentrations would cause different resistivity profiles and different impedance responses.
4.2. Electrolyte in short and through pores
The volume fraction of the electrolyte within the through pores, henceforth denotedpore, was determined for
different coating/electrolyte combinations and various immersion times using equation (7) and the fitted Rpore
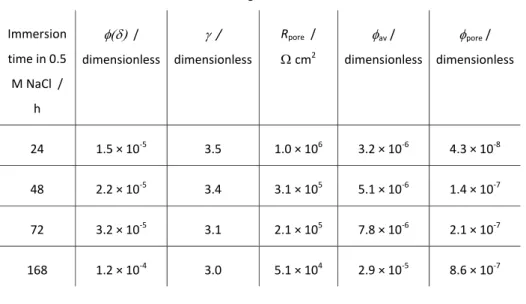
values. Table 1 reports, as an example, data relevant to coating E in 0.5 M NaCl. The same table reports also the fitted parameters , and Rpore and the volume fraction of the electrolyte in the short pores, averaged
along the coating thickness , henceforth denoted av. It must be emphasized that, if w is underestimated, for
the reasons discussed in the previous section, both pore and av will be underestimated by the same factor,
and their ratio will be correctly assessed. Inspection of Table 1 shows that, for all immersion times, av >pore, and therefore most of the electrolyte is contained in pores that do not reach the metal. However, the pore/av ratio increases as the immersion time increases. This suggests that, for this system, as the immersion time is prolonged and the water uptake progresses, (i) the number and/or diameter of the pores increases and (ii) the pore depth increases, such that a number of short pores become through pores at longer immersion time. All these conclusions agree with those drawn by Mišković‐Stanković et al. [11] from the analysis of results of liquid sorption and thermogravimetric experiments. It is worth pointing out that the calculation was made for cylindrical pores, perpendicular to the interfaces, which allows the volume ratio in equation (7) to be replaced by the surface area ratio. Clearly, real pores must be tortuous. Considering their tortuosity would affect pore (because a higher tortuosity would correspond to a
higher apparent and therefore a higher pore), but not av (because Eq. (1) and (2) hold for any pore
geometry). Unless tortuosity values are much higher than a few units, the conclusion that av >pore still holds.
Once pore is known, resistivity profiles taking into account the electrolyte in all pores may be calculated
according to equation (1), in which is replaced by ’ defined as
) 1 )( ( 1 ) ( ) ( '
pore (9) Fig. 5 compares these new profiles (empty symbols) with those reported in Fig. 10 of reference [7] (full symbols), which were calculated by directly using the fitted and values and neglecting the electrolyte in the through pores. Clearly, taking pore into account affects only marginally, thus the lower resistivity limitthe resistivity at = 0 calculated according to equations (1) and (9) and based on ’ is markedly lower than
that calculated according to equations (1) and (5) and based on .
Additional differences caused by using ’instead of are: (i) a more extended region where is
independent of , next to the coating/oxide interface, and (ii) a progressive decrease of (0) with increasing immersion time The presence of inner and outer layers in organic films was experimentally shown by Kittel et al. [20] who highlighted the heterogeneity of the properties of coatings along their thickness.
Inspection of Table 1 shows that the total water uptake (averaged along the coating thickness), given by av +
pore, remains below 10‐4, i.e. below 0.01 %, even after 168 h of immersion. Such a value is significantly lower
than values often reported in the literature for various coatings materials (typically between 0.1 and 10%, see e.g. [11‐13, 19‐22]). Direct and reliable gravimetric data for our samples are not available. In previous sections we discussed reasons why the water uptake data in table 1 may be significantly underestimated. However, it must be stressed that, although the results of the fitting procedure are reported in part in terms of water uptake, e.g. , what really matters is the conductivity, given by equation (1), and, with very good approximation by equation (8). In the development of the power‐law model (referred to electrolyte‐penetrated coatings), was assumed to be distributed along the thickness according to a power law, and the corresponding resistivity and permittivity distributions were calculated accordingly. It must be realized that is just an intermediate in the calculation. The model might be directly described in terms of and , both assumed to undergo a power‐law variation, over a large and a small (essentially negligible) range, respectively.
Regression would then directly provide and values, allowing the calculation of profiles identical to those shown in the present paper. In other words, the determined profiles, e.g. those in Fig. 5, are reliable, whereas the may be or not reliable, depending on permselectivity effects and on the presence/absence of significant amounts of polymer‐bounded water. Analyses of the water uptake based on the evolution of the coating capacitance with immersion time often lead to its overestimation, by a small factor, as compared with gravimetric methods. Since the permittivity of water does not change dramatically with the concentration of ions dissolved in it, estimates based on capacitance are intrinsically less sensitive to selective uptake of water/ions than our approach relying on resistivity variations. 4.3. Effect of coating formulation and electrolyte composition
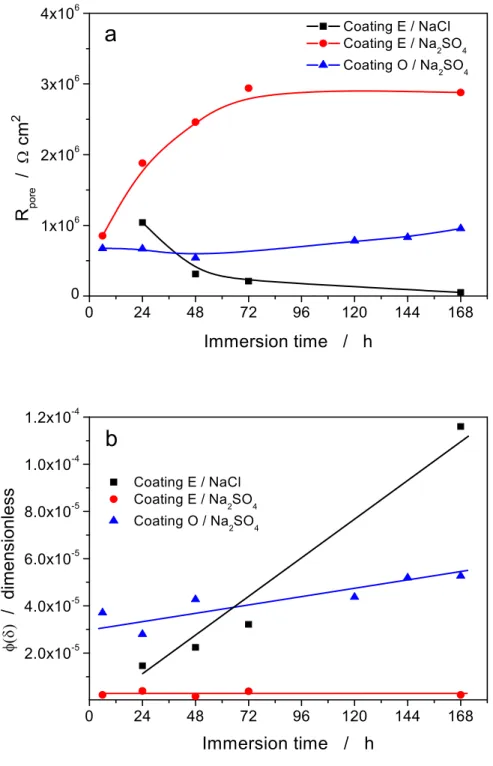
The impedance of coatings E and O was measured during immersion in 0.5 M Na2SO4, during 168 h, and analyzed using the model described in [7], with the same approach as described above for coating E exposed to 0.5 M NaCl. Coating O, less protective than coating E, was not studied in NaCl solution because signs of corrosion appeared rather soon and, to account for the corrosion process, the proposed model would need to be completed by including either additional circuit elements or an appropriate analytical expression. The agreement between experiments and model was good for all immersion times, although, as discussed before, divergences appeared at frequencies higher than 1 kHz (which were therefore not taken into account in the fitting), as shown in Fig. 6. Tables 2 and 3 summarize the fitting results, which are compared to those for the coating E/NaCl system in Fig. 7. Clearly, the different coating/solution combinations show significantly different time dependencies of both Rpore and . For coating E, upon increasing the immersion time, Rpore
decreases in NaCl solution, but increases in Na2SO4 solution. For coating O in Na2SO4 solution, Rpore undergoes
only small variations, initially decreasing and then slightly increasing. For coating E, upon increasing the immersion time, increases rapidly in NaCl solution and remains roughly constant at a much lower value in Na2SO4 solution. For coating O in Na2SO4 solution, is initially much higher than for coating E and then
increases slowly when immersion time increases.
These results suggest that coating E is intrinsically less defective than coating O, hence its lower water uptake and somewhat higher Rpore value at short immersion time. Coating O undergoes then only minor changes, i.e. it
does not uptake much additional water, nor significant amounts of sulfate ions diffuse from the external solution to the solution in the pores. Coating E shows diverging behavior, depending on the anion in the test solution. Supposing that the amount of water uptaken by the coating is not dramatically different in the two cases [12], the Rpore decrease and decrease might actually be the result of the progressive increase in the
chloride concentration in the pores (with a resulting decrease in resistivity). Such an effect would not be observed in sulfate solution, due to a much slower diffusion of this anion. The increase in Rpore values with
exposure time, observed in Na2SO4 solution, is not a common phenomenon, but increasing impedances have been observed in other studies [13, 23]. To explain the experimental observations, either a further water‐ induced cross‐linking of the coating material or, less probably, a pore shrinking as a consequence of coating swelling may be hypothesized. Independent evidence allowing to assess which phenomenon predominates is not available. 5. Conclusions
The “power law model”, whose application to anti‐corrosion coatings had been proposed in [7], has been revisited and employed to analyze new experimental data.
It has been shown that an inaccurate knowledge of the resistivity of the dry coating material c is unlikely to
affect the quality of the agreement between model and experimental data, nor the values of the regressed parameters, at least as long as c is large. Instead, an erroneous assumption about the resistivity of the
electrolyte (w) within the coating pores has a major impact on the estimated water uptake . If, as it has been
often reported, the diffusion of ions into the coating is slower that water diffusion, then w and will be
respectively overestimated and underestimated, possibly by a large factor. The effect of “through pores” and “short pores” has been taken simultaneously into account to calculate resistivity profiles. Finally, it was shown that the evolution of the coating properties with immersion time depends both on the coating material, e.g. on its microstructure, and on the electrolyte, e.g. the ability of its anions to diffuse into the coating. Acknowledgments The experimental data were obtained in the framework of the SMILE project (Surface Mono Innovative Layer for Environment), with the financial support of the DGCIS (Direction Générale de la Compétitivité, de l’Industrie et des Services). N. Pébère thanks the partners of the project: Mapaero (Pamiers), Rescoll (Bordeaux), Airbus (Toulouse), Dassault (Paris), EADS IW (Suresnes), l’Electrolyse (Bordeaux), and the laboratories LCPO and US2B (Université de Bordeaux).
References [1] L. Beaunier, I. Epelboin, J.C. Lestrade, H. Takenouti, Etude électrochimique et par microscopie électronique a balayage du fer recouvert de peinture, Surf. Technol. 4 (1976) 237. [2] M.E. Orazem, I. Frateur, B. Tribollet, V. Vivier, S. Marcelin, N.Pébère, A.L. Bunge, E.A. White, D.P. Riemer, M. Musiani, Dielectric Properties of Materials Showing Constant‐Phase‐Element (CPE) Impedance Response, J. Electrochem. Soc. 160 (2013) C215. [3] D.M. Brasher, A.H. Kingsbury, Electrical measurements in the study of immersed paint coatings on metal. I. Comparison between capacitance and gravimetric methods of estimating water‐uptake, J. Appl. Chem. 4 (1954) 62. [4] G.J. Brug, A.L.G. van den Eeden, M. Sluyters‐Rehbach, J.H. Sluyters, The analysis of electrode impedances complicated by the presence of a constant phase element, J. Electroanal. Chem., 176 (1984) 275. [5] C. H. Hsu, F. Mansfeld, Concerning the conversion of the constant phase element parameter Y‐0 into a capacitance, Corrosion, 57, (2001) 747. [6] B. Hirschorn, M.E. Orazem, B. Tribollet, V. Vivier, I. Frateur, M. Musiani, Determination of effective capacitance and film thickness from constant‐phase‐element parameters, Electrochim. Acta, 55 (2010) 6218. [7] S. Amand, M. Musiani, M.E. Orazem, N. Pébère, B. Tribollet, V. Vivier, Constant‐Phase‐Element Behavior Caused by Inhomogeneous Water Uptake in Anti‐Corrosion Coatings, Electrochim. Acta 87 (2013) 693. [8] B. Hirschorn, M.E. Orazem, B. Tribollet, V. Vivier, I. Frateur, M. Musiani, Constant‐Phase‐Element Behavior Caused by Resistivity Distributions in Films: 1. Theory, J. Electrochem. Soc. 157 (2010) C452. [9] M. Musiani, M.E. Orazem, N. Pébère, B. Tribollet, V. Vivier, Constant‐Phase‐Element Behavior Caused by Coupled Resistivity and Permittivity Distributions in Films, J. Electrochem. Soc. 158 (2011) C424.
[10] B. Hirschorn, M.E. Orazem, B. Tribollet, V. Vivier, I. Frateur, M. Musiani, Constant‐Phase‐Element Behavior Caused by Resistivity Distributions in Films: 2. Applications, J. Electrochem. Soc. 157 (2010) C458. [11] V.B. Mišković‐Stanković, D.M. Dražić, M.J. Teodorović, Electrolyte penetration through epoxy coatings electrodeposited on steel, Corros. Sci. 37 (1995) 241. [12] V.B. Mišković‐Stanković, D.M. Dražić, Z. Kačarević‐Popović, The sorption characteristics of epoxy coatings electrodeposited on steel during exposure to different corrosive agents, Corros. Sci. 38 (1996) 1513. [13] C. Le Pen, C. Lacabanne, N. Pébère, Characterisation of water‐based coatings by electrochemical impedance spectroscopy, Prog. Org. Coat. 46 (2003) 77. [14] A. R. Blythe, Electrical Resistivity Measurements of Polymer Materials, Polymer Testing 4 (1984) 195. [15] M.E. Baird, Nature of DC conductivity in polyamides, J. Polymer Sci. A‐2 8 (1970) 739. [16] B.R. Hinderliter, S.G. Croll, D.E. Tallman, Q. Su, G.P. Bierwagen, Interpretation of EIS data from accelerated exposure of coated metals based on modeling of coating physical properties, Electrochim. Acta 51 (2006) 4505. [17] A.S. Castela, A.M. Simoes, Assessment of water uptake in coil coatings by capacitance measurements, Prog. Org. Coat. 46 (2003) 55. [18] J.M. Hu, J.Q. Zhang, C.N. Cao, Determination of water uptake and diffusion of Cl− ion in epoxy primer on aluminum alloys in NaCl solution by electrochemical impedance spectroscopy, Prog. Org. Coat. 46 (2003) 273. [19] R.G. Duarte, S. González, A.S. Castela, M.G.S. Ferreira, R.M. Souto, Sensing polymer inhomogeneity in coated metals during the early stages of coating degradation, Prog. Org. Coat. 74 (2012) 365. [20] J. Kittel, N. Celati, M. Keddam, H. Takenouti, New methods for the study of organic coatings by EIS: New insights into attached and free films, Prog. Org. Coat. 41 (2001) 93. [21] J.H. Park, G.D. Lee, H. Ooshige, A. Nishikata, T. Tsuru, Monitoring of water uptake in organic coatings under cyclic wet–dry condition, Corros. Sci. 45 (2003) 1881.
[22] R.G. Duarte, A.S. Castela, M.G.S. Ferreira, A new model for estimation of water uptake of an organic coating by EIS: the tortuosity pore model, Prog. Org. Coat. 65 (2009) 197. [23] M.C.S.S. Macedo, I.C.P. Margarit‐Mattos, F.L. Fragata, J.‐B. Jorcin, N. Pébère, O.R. Mattos, Contribution to a better understanding of different behaviour patterns observed with organic coatings evaluated by electrochemical impedance spectroscopy, Corros. Sci. 51 (2009) 1322.
Table 1. Dependence of the fitted parameters and Rpore and of the calculated quantities av and pore on the immersion time in 0.5 M NaCl for coating E. Immersion time in 0.5 M NaCl / h / dimensionless / dimensionless Rpore / cm2 av / dimensionless pore / dimensionless 24 1.5 × 10‐5 3.5 1.0 × 10⁶ 3.2 × 10‐6 4.3 × 10‐8 48 2.2 × 10‐5 3.4 3.1 × 10⁵ 5.1 × 10‐6 1.4 × 10‐7 72 3.2 × 10‐5 3.1 2.1 × 10⁵ 7.8 × 10‐6 2.1 × 10‐7 168 1.2 × 10‐4 3.0 5.1 × 10⁴ 2.9 × 10‐5 8.6 × 10‐7
Table 2. Dependence of the fitted parameters and Rpore and of the calculated quantities av and pore on
the immersion time in 0.5 M Na2SO4 for coating E. Immersion time in 0.5 M Na2SO4 / h / dimensionless / dimensionless Rpore / cm2 av / dimensionless pore / dimensionless 6 2.3 × 10‐6 3.6 8.5 × 10⁵ 5.3 × 10‐7 3.9 × 10‐8 24 3.9 × 10‐6 4.0 1.9 × 10⁶ 8.0 × 10‐7 1.8 × 10‐8 48 1.6 × 10‐6 3.9 2.5 × 10⁶ 3.5 × 10‐7 1.3 × 10‐8 72 3.8 × 10‐6 4.2 2.9 × 10⁶ 7.9 × 10‐7 1.1 × 10‐8 168 2.2 × 10‐6 4.2 2.9 × 10⁶ 4.4 × 10‐7 1.1 × 10‐8
Table 3. Dependence of the fitted parameters and Rpore and of the calculated quantities av and pore on
the immersion time in 0.5 M Na2SO4 for coating O. Immersion time in 0.5 M Na2SO4 / h / dimensionless / dimensionless Rpore / cm2 av / dimensionless pore / dimensionless 6 3.7 × 10‐5 3.9 6.7 × 10⁵ 7.7 × 10‐6 4.9 × 10‐8 24 2.8 × 10‐5 3.4 6.7 × 10⁵ 6.5 × 10‐6 5.0 × 10‐8 48 4.3 × 10‐5 3.4 5.4 × 10⁵ 9.8 × 10‐6 6.2 × 10‐8 120 4.4 × 10‐5 3.2 7.8 × 10⁵ 1.0 × 10‐5 4.3 × 10‐8 144 5.2 × 10‐5 3.3 8.3 × 10⁵ 1.2 × 10‐5 4.0 × 10‐8 168 5.3 × 10‐5 3.3 9.5 × 10⁵ 1.2 × 10‐5 3.5 × 10‐8