For Peer Review Only
Role of the geomorphic setting in controlling groundwater-surface
6
water exchanges in riverine wetlands – A case study from two southern
7
Québec rivers (Canada)
8
Marie Larocque1*, Pascale M. Biron2, Thomas Buffin-Bélanger3, Michael Needelman1, 9
Claude-André Cloutier3 and Jeffrey M. McKenzie4 10
11
1
Centre de recherche GÉOTOP, département des sciences de la Terre et de 12
l’atmosphère, Université du Québec à Montréal, Montréal, Québec H2C 3P8 13
2
Department of Geography, Planning and Environment, Concordia University, 14
Montréal, Québec, Canada 15
3
Département de biologie, chimie et géographie, Université du Québec à Rimouski, 16
Rimouski, Québec, Canada 17
4
Department of Earth and Planetary Sciences, McGill University, Montréal 18
* Corresponding author 19
20
For the use of the editors
Paper #: Submitted on: Accepted on:
Application - Research – Commentary – Book Review: Copyright Held by:
T2012
21
Abstract
22
There is great interest worldwide to reconnect floodplain wetlands to their rivers. Whilst 23
the surface water connection between rivers and wetlands is fairly well understood, the 24
linkages via groundwater are not well known. In this study, it is hypothesized that the 25
significance of the groundwater pathways between rivers and wetlands is largely 26
determined by the geomorphic setting of the riverine corridor. This was tested by 27
measuring the response of water levels and temperatures in floodplain groundwater and 28
in wetlands to river pulses in two geomorphologically-distinct riverine corridors in 29
For Peer Review Only
Southern Québec. In the De la Roche River (DLR; 145 km2), the floodplain is narrow and 30
the alluvial sediments consist of sandy silt (wetland A; abandoned meander) or clayey silt 31
(wetland B; stable floodplain), depending on the location. During within-channel floods, 32
exchanges of water between the river and the floodplain are limited to some bank 33
recharge where the alluvial sediments are permeable, and over-bank storage where the 34
sediments are finer. Water levels in the DLR floodplain wetlands were controlled by a 35
combination of over-bank flow and groundwater discharge from adjacent uplands. In the 36
Matane River (1678 km2), the floodplain substrate is coarser, and the floodplain is wider 37
and has a meandering planform geometry. The response of the Matane River wetland 38
during floods shows storage of water due to a groundwater flood wave. This response of 39
the wetland to within-channel flood pulses could play a role in downstream flood 40
attenuation. In this river, the presence of river infiltration in this floodplain was also 41
illustrated by the warming of floodplain groundwater during flood pulses. This study has 42
shown with three distinct examples how riverine wetlands can be connected to their 43
rivers via either a surface or subsurface pathway depending on the geomorphic setting of 44
the riverine corridor. 45
Keywords: geomorphic setting, wetland, aquifer, river, Québec (Canada)
46
Résumé
47
Il existe un intérêt croissant pour reconnecter les milieux humides riverains aux rivières. 48
Même si les échanges entre les rivières et les milieux humides sont relativement bien 49
compris, les liens avec les eaux souterraines demeurent méconnus. Cette étude visait à 50
montrer que l’importance des connexions souterraines entre rivières et milieu humides est 51
déterminée par le contexte géomorphologique du corridor riverain. La réponse de la 52
nappe des milieux humides dans la plaine inondable aux variations de niveaux dans la 53
rivière a été étudiée dans deux corridors riverains de contextes géomorphologiques 54
distincts du Québec méridional. Dans la rivière De la Roche (DLR; 145 km2), la plaine 55
inondable est étroite et composée de silts sableux (milieu humide A; méandre abandonné) 56
ou de silts argileux (milieu humide B; plaine inondable stable). La plaine inondable 57
emmagasine un certain volume d’eau aux endroits où les sédiments sont perméables et 58
stocke l’eau en surface où les sédiments sont plus fins. Les niveaux dans les milieux 59
For Peer Review Only
humides de la rivière DLR sont contrôlés par une combinaison de stockage de surface et 60
par des apports d’eau de l’aquifère adjacent. Sur la rivière Matane (1678 km2), les 61
sédiments sont plus grossiers, la plaine inondable est plus large et montre une géométrie 62
complexe d’anciens méandres. La réponse du milieu humide de la rivière Matane aux 63
crues traduit un emmagasinement engendré par une vague souterraine qui pourrait jouer 64
un rôle important dans l’atténuation des crues en aval. L’infiltration de l’eau de rivière 65
dans la plaine inondable de la rivière Matane a été mise en évidence par le réchauffement 66
de l’eau souterraine à proximité de la rivière lors des crues. Cette étude a montré 67
comment les milieux humides riverains peuvent être connectés aux cours d’eau par 68
l’emmagasinement en surface ou par des connexions souterraines, en fonction du 69
contexte géomorphologique du corridor riverain. 70
For Peer Review Only
Introduction
72
Integrated watershed management is increasingly recognizing that rivers are not linear 73
features confined in a channel, but that their spatial and temporal dynamics define a 74
larger and variable space that needs to be determined for adequate river management. The 75
river corridor (Kline and Cahoon 2010), the fluvial territory (Ollero 2010), and the 76
freedom space for rivers (Biron et al. 2014; Buffin-Bélanger et al. 2015) are examples of 77
river space concepts guided by the analysis of geomorphological and hydrological 78
processes occurring on the floodplain. However, these river space concepts pay less 79
attention to hydrogeological processes occurring within the floodplain. To develop a 80
comprehensive river corridor management approach, there is a need to better consider the 81
connections between the river and the alluvial aquifer, notably through wetlands which 82
can contribute to flood mitigation (Bullock and Acreman 2003; Piégay et al. 2005; 83
Arnaud-Fassetta et al. 2009), lessen the severity of low flows, filter underground 84
contaminants (Emmett et al. 1994; Verhoeven et al. 2006) and provide healthy 85
ecosystems. 86
Hydrological connections between aquifers, wetlands and rivers can be defined using 87
response time and bank storage, both of which are influenced by the hydraulic 88
conductivity of the deposits and by the morphological features of the floodplain. As 89
residence time is directly influenced by connectivity, it may affect the wetland potential 90
for nitrogen removal via denitrification (Racchetti et al. 2011; Roley et al. 2012). Aquatic 91
and wetland biodiversity are also often related to hydrological connections (Phillips 92
2013) with groundwater-connected wetlands offering relatively constant humidity and 93
temperature conditions, due to more stable water levels (Lowry et al. 2007). Connectivity 94
is also strongly related to abandoned channel water bodies such as meander loops 95
(Phillips 2013), and there is often strong hydrological connection between these two 96
entities. As such, it is a dynamic system which can evolve over time following 97
geomorphic evolution of the river channel (Amoros and Bornette 2002; Phillips 2013). 98
New oxbow lakes tend to vary in stage in a similar way to the river channel. However, 99
older oxbow lakes, even if located very close to the channel, can be essentially isolated 100
from it, at least in terms of surface water (Hudson 2010). Channel-floodplain connections 101
are thus complex and cannot simply be determined by variables such as distance from 102
For Peer Review Only
channel and differences in elevation between the channel and the wetland (Phillips 2013). 103
More research is needed to define a general typology that would include the geomorphic 104
setting. 105
Although river-aquifer connections through baseflows have been increasingly studied in 106
the last decade, there is a lack of literature on how these connections occur in the 107
presence of wetlands, particularly when wetlands are formed through meander cut-off 108
(Džubáková et al. 2015). A key question concerns the drivers of the surface water level 109
regime of floodplain wetlands, as it is not clear if these are dominated by rainfall, surface 110
runoff (i.e. over-bank flow), a local river-derived groundwater system, a regional 111
groundwater system or some combination thereof. How important these different sources 112
of water will be for a particular wetland will depend on climate, aquifer properties and 113
geomorphic setting. Most studies so far have either focused on a single wetland, or have 114
assumed a similar hydrologic connectivity for all riverine wetlands. Significant efforts 115
have been made towards developing such a typology for wetlands in general (e.g.: 116
Acreman 2004; Ramsar 2005). However, the significance of the groundwater pathway 117
between rivers and wetlands being largely determined by the geomorphic setting of the 118
riverine corridor, it is necessary to include geomorphology in refining the typology of 119
river-wetland-aquifer connections. 120
The objective of this research was to provide a better understanding of the role of 121
geomorphology in controlling groundwater-surface water exchanges in riverine wetlands. 122
The study areas were set in two southern Québec rivers with contrasting 123
geomorphological context, the De la Roche River and the Matane River. These contrasted 124
rivers were the focus of a recent hydrogeomorphological study on the implementation of 125
the freedom space approach in river corridors (Biron et al. 2014; Buffin-Bélanger et al. 126
2015). The De la Roche River is a small river (catchment area 145 km2) flowing locally 127
on deep-water marine sediments with local abandoned meanders, in an agricultural 128
setting. The Matane River (catchment area 1678 km2) has a large gravelly floodplain and 129
an irregular meandering planform geometry. To address the research objective, a variety 130
of data were used including river levels, groundwater levels, and water temperature. For 131
the Matane River, this work builds on recent advances on the understanding of the 132
For Peer Review Only
floodwave propagation in the floodplain acquired by Cloutier et al. (2014) and Buffin-133 Bélanger et al. (2015). 134 Study sites 135 Geomorphic settings 136
The De la Roche (hereafter DLR) River is a fourth-order river located in the Montérégie 137
region, 80 km southeast of Montréal (Canada), close to the state of Vermont, USA 138
(Figure 1). Most of the drainage area is located in Vermont, with only 55 km2 (out of 145 139
km2) in Québec. The highest elevations in the watershed, at 260 m.a.s.l., are located in 140
the upper reaches of the watershed in Vermont. The Québec portion of the longitudinal 141
river profile lies between elevations of approximately 62 to 32 m.a.s.l. at its outlet. The 142
DLR River is located in the St. Lawrence Lowlands, except for the upstream part of the 143
reach which is in the Appalachian plateau. The watershed geology is composed of shale 144
and slate-fractured shale, and to a lesser extent dolomite, sandstone and limestone 145
(Dennis 1964; Stewart 1974; Mehrtens and Dorsey 1987). The surface deposits of the 146
area consist primarily of deep-water marine sediments, till blanket, thin till, reworked till 147
and many sections of exposed rock. There are few areas of alluvium from ancient river 148
terraces due to meandering of the river over the past century. Till covers much of the 149
watershed due to the regional glacial history. The fine, silty and clayey glaciolacustrine 150
deposits resulted from the presence of glacial and proglacial lakes during the deglaciation 151
that began about 13,000 years BP (Dubois et al. 2011). There are also marine sediments 152
reflecting the intrusion of the Champlain Sea about 12,800 to 10,200 years BP (Stewart 153
and McClintock 1969; Cronin 1977). The downstream portion of the DLR River flows 154
mainly on marine sediments. The study reach is much more sinuous than in the upstream 155
portion where it flows directly on till or on the bedrock. The DLR River has an average 156
bankfull width of approximately 12 m and a mean bankfull depth of 1.2 m. 157
The Matane River is sixth-order river located at the edge of the Gaspésie region, 630 km 158
northeast of Montreal (Figure 1). It is considerably larger than the DLR River (catchment 159
area of 1678 km2) and much more dynamic. The highest elevations at 1068 m.a.s.l. are 160
located in the eastern part of the watershed. The lowest elevations at the outlet are in the 161
St. Lawrence estuary in the city of Matane. The Matane River watershed is located in the 162
For Peer Review Only
Appalachian region and is considered semi-alluvial with several bedrock outcrops 163
through its course. The lithology of the Matane valley is deformed sedimentary rock 164
associated with the Appalachian orogenesis from the Cambro-Ordovician period. The 165
Matane River has irregular meandering planform geometry and it flows into a wide semi-166
alluvial valley cut into quaternary deposits and recent fluvial deposits (Lebuis 1973, 167
Marchand et al. 2014). The floodplain of the Matane River is constructed by the 168
evolution of meander loops, laterally shifting over time. The mean channel width and 169
valley width are 55 m and 475 m, respectively and the bankfull depth in the vicinity of 170
the wetland is 2.8 m. According to borehole data from the valley floor, the average 171
unconsolidated sediment thickness is 49 m. The entire alluvial aquifer of the Matane 172
valley is an unconfined coarse sand/gravel and pebble aquifer with a mean saturated 173
thickness of 46 m, except in the downstream part of the valley, where the alluvial aquifer 174
is overlaid by a 30 m thick silty/clay marine deposit. The presence of a confined aquifer 175
only in the downstream part of the valley suggests that the valley was lately hosted by a 176
glacial tongue connected with a regional ice cap during the latest deglaciation (Marchand 177
et al. 2014). The alluvial aquifer is overtopped by an over-bank sand/silt deposit layer of 178
variable thickness ranging from 0.30 m for the highest topographic forms to 0.75 m 179
within abandoned channels. 180
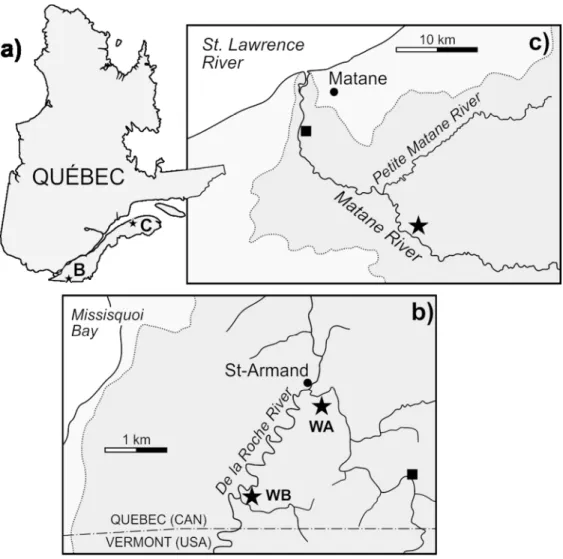
Figure 1. a) Québec Province map with location of the two study sites, b) close-up
181
map of the Matane River site (star), and c) close-up view of the two wetlands (WA
182
and WB) of the De la Roche River. The black square in b) and c) indicates the
183
closest gauging station and the darker-grey area represents the watershed area.
184
Hydrology and hydrogeology
185
The land use within the DLR watershed is mainly agricultural (mix of crops and 186
feedlots), particularly in the downstream reach, with forested areas upstream. It is one of 187
the main tributaries of the Missisquoi Bay in Lake Champlain. A gauging station is 188
located at the upstream limit of the study reach, downstream of the border with Vermont 189
(CEHQ station 030425; see Figure 1b for location). The mean annual river discharge is 190
1.1 m3/s (2001-2012). The maximum observed flow rate is 34.3 m3/s, while minimum 191
For Peer Review Only
1971-2000 indicate an average daily temperature of 6.8 °C and total annual precipitation 193
of 1096 mm (Environment Canada 2013). 194
The main aquifer associated with the DLR River is unconfined for a large portion of the 195
study area with the exception of the downstream portion of the river where the clayey 196
silts of the Champlain Sea occupy the riverbed. Water table level elevations (height of the 197
water table) vary from approximately 30 m in the downstream meandering portion of the 198
river to over 70 m on the small hilltops that surround the study area (Needelman, 2014; 199
all elevations given as m.a.s.l.). The DLR River drains the aquifer over the entire length 200
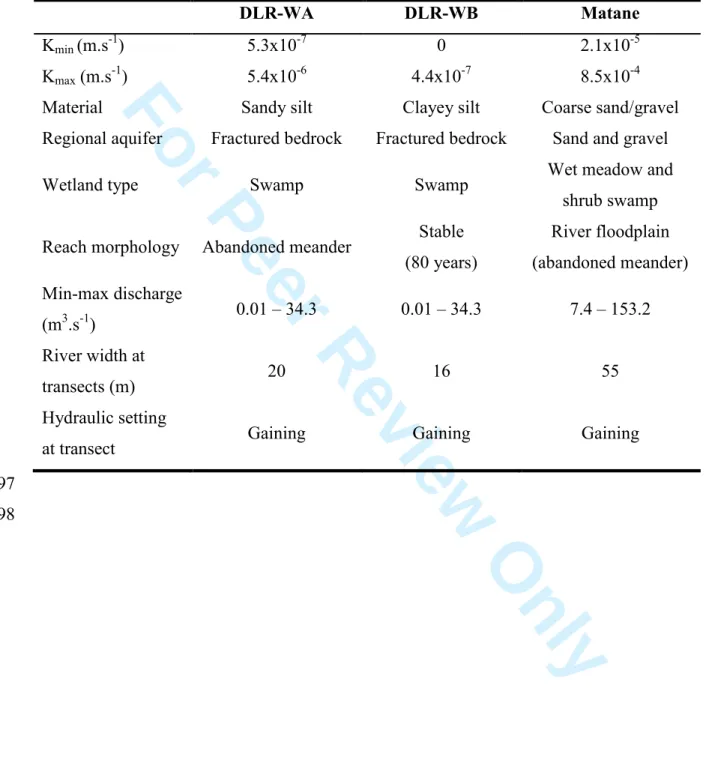
of its course in the study area. Results from slug tests indicate that hydraulic 201
conductivities (K) in WB varies from being too low to be measurable to 5.7x10⁻⁷ m/s, 202
whereas K is somewhat larger in WA with values between 5.3x10⁻⁷ and 4x10⁻⁶ m/s (See 203
Fig. 1b for locations; Table 1; Needelman 2014). These values correspond to sandy silt 204
(WA) and to clayey silt (WB) (Freeze and Cherry 1979). 205
The Matane watershed is mainly forested and the river is known for its iconic Atlantic 206
salmon (Salmo salar) population. There is a gauging station located near the mouth of the 207
river (CEHQ station 021601, Figure 1c). The mean annual river discharge is 39 m3/s 208
(1929–2009), and the bankfull discharge is estimated at 350 m3/s. Minimum flow rates 209
(considered as baseflows) are on the order of 5 m3/s. The climate normals for the period 210
1971-2000 indicate an average daily temperature of 2 °C and total annual precipitation of 211
1032 mm (Environment Canada, 2013). 212
A borehole next to the Matane site revealed that the unconfined alluvial aquifer thickness 213
is 47 m. The annual mean water table level at the study site is 58.8 m, whereas the mean 214
floodplain surface elevation is 60.4 m, leaving an unsaturated zone of about 1.6 m (Clout-215
ier et al. 2014). Beyond the floodplain, groundwater levels rapidly increase to 65 m and 216
up to 125 m, 1 km upgradient from the river (MDDELCC, 2014). In the alluvial aquifer 217
within the study site, the general groundwater flow gradient follows the river gradient at 218
low flows. At high flows, however, hydraulic gradients can temporarily be from the river 219
towards the valley wall (Cloutier et al. 2014). At the regional scale, equipotential lines 220
follow that of the topographic settings so that the Matane River is draining the regional 221
For Peer Review Only
aquifer. Results from slug tests indicate that hydraulic conductivities are relatively homo-222
geneous with values ranging from 8.5 x 10⁻⁴ to 2.1 x 10⁻⁵ m.s-1 (Table 1; Cloutier et al. 223
2014), which are representative of coarse sand to gravel deposits (Freeze and Cherry 224
1979). 225
Table 1. Site hydrogeomorphological conditions
226
Wetlands
227
On the DLR River, two riverine wetlands - WA (upgradient) and WB (downgradient) - 228
were studied, covering areas of 3.7 and 3.4 ha respectively (Figures 2a, 2b; see Table 1 229
for site summary). The two wetlands are classified as swamps and have similar 230
vegetation. Dominant common tree species are red ash (Fraxinus pennsylvanica), sugar 231
maple (Acer saccharum), white and black ash (Fraxinus americana and Fraxinus nigra), 232
very few shrubs and herbaceous species such as jumpseed (Persicaria virginiana), 233
creeping jenny (Lysimachia struthiopteris) and shuttlecock fern (Matteucia 234
struthiopteris) (Moisan 2011). WA has an elongated shape and runs parallel to the stream
235
which has a slope of about 0.4% in this area; it corresponds to an old meander loop 236
(oxbow lake) visible on 1930 aerial photographs (cf. Figure 2). In contrast, WB is more 237
rounded in shape and is connected to the river at two bends in a meander loop. The river 238
path around this wetland has not changed significantly in the last 85 years. The river has 239
a very low slope of approximately 0.055% in this area. 240
On the Matane River, the riverine wetland is located 28 km upstream from the estuary of 241
the St. Lawrence estuary (Figure 2c; see Table 1 for site summary). The wetland is classified 242
as a wet meadow with a shrub swamp in the portion closest to the Matane River. Dominant trees 243
species are silver poplar (Populus tremuloides), swamp cedar (Thuja occidentalis), white spruce 244
(Picea glauca) and balsam willow (Salix pyrifolia). Shrubs are also present with red osier dogwood 245
(Cornus stolonifera) and swamp rose (Rosa palustris), along with herbaceous species such as 246
spotted Joe-Pye weed (Eupatorium maculatum var. maculatum) and reed canarygrass (Phalaris 247
arundinacea). The wetland covers an area of 0.062 km2 in a zone with a channel slope of 0.25%. It 248
occupies an elongated depression (oxbow) and a few overflow channels (Figure 2c) and is flooded 249
For Peer Review Only
regularly when groundwater levels rise in the floodplain, even when water level in the river remains 250
below bankfull stage (Cloutier et al. 2014). 251
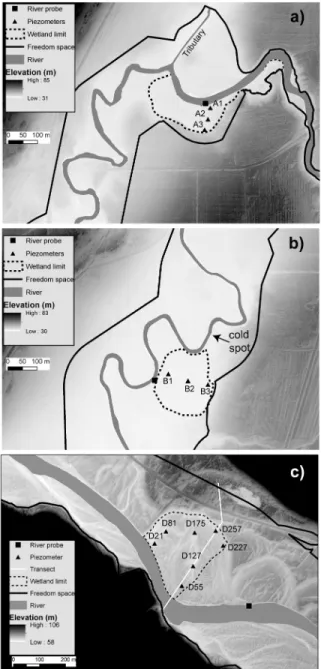
Figure 2. Field site instrumentation: a) Wetland A of the De la Roche River (flow is
252
from right to left), b) Wetland B of the De la Roche River (flow is from top to
253
bottom) also showing the presence of a cold spot (localized groundwater
254
contribution) and c) Wetland on the Matane River (flow is from bottom right to top
255
left). Note the former meander loops which are visible in the LiDAR DEM in c). The
256
freedom space limits (defined in Biron et al. 2014) are indicated in each case with a
257
solid black line.
258
Constantine et al. (2010) have shown that fine alluvium deposits can appear relatively quickly after 259
the cutoff of a side channel, which can lead to the development of riverine wetlands. There is no 260
evidence of such a clogging layer at the bottom of the three studied wetlands. In the Matane River, 261
the soil is closely associated with the coarse sand/gravel that cover the floodplain. The presence of 262
surface water is caused by groundwater flooding. In the DLR River, WB lies on low permeability 263
clayey silt which limits water infiltration. In WA, the sediments have relatively low permeability 264
and there was no evidence of the presence of a clogging layer. 265
Methods
266
Wetland instrumentation and monitoring
267
On the DLR River, three piezometer nests were hand drilled with an auger along a 268
transect perpendicular to the river in the two wetlands (Figures 2a and 2b). Each transect 269
position and elevation was accurately determined using a differential global positioning 270
system (DGPS; Trimble R8GNN, vertical accuracy 10 mm) to produce a digital elevation 271
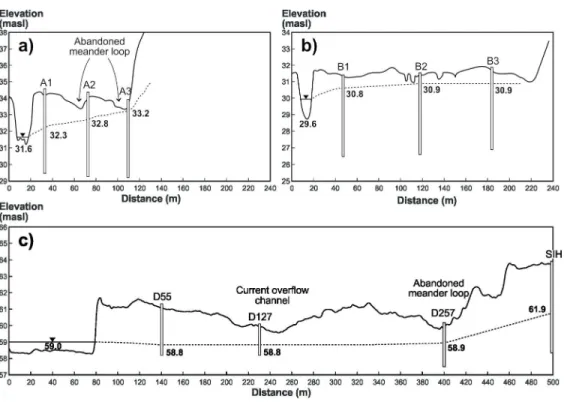
model of each wetland. WA topography has values ranging from 33 to 38 m close to the 272
piezometers (Figure 3a). WB is flatter with an elevation of approximately 31 m 273
throughout the entire area (Figure 3b). The transects have a length of 110 and 190 m for 274
WA and WB, respectively. Piezometers were made of 25.4 mm ID PVC pipes sealed at 275
the base and equipped with 0.30 m screens at the bottom end, reaching a total depth of 276
3.15 m (Figure 3). A river stage gauge was installed at the riverbed, adjacent to each 277
wetland transect (Figures 2a and 2b). Within each shallow piezometer, a Solinst pressure 278
For Peer Review Only
transducer (LTC Levelogger Junior) was installed to measure the water level and 279
temperature every 15 min. Water level and temperature were also measured in the DLR 280
River at 15 min intervals (LTC Levelogger Junior, accuracy of 10 mm). The time period 281
analyzed in this paper is between June and October 2012 (data acquisition began before 282
and continued after this period). The exact positions of the Solinst sensors were obtained 283
with the DGPS. The water level time-series were corrected for barometric pressure 284
recorded with a Solinst Barologger located at WB. 285
On the Matane River, an array of 11 piezometers was installed in the floodplain and 286
wetland by Cloutier et al. (2014). A subset of seven of these piezometers were used in the 287
current study (Figure 2c; piezometer names correspond to distance from the river, as in 288
Cloutier et al. 2014). Piezometer locations were measured using a Magellan ProMark III 289
DGPS (vertical accuracy 10 mm). A LIDAR survey (33 mm vertical accuracy) was used 290
to obtain a high resolution map of topography. Piezometers are made from 38 mm ID 291
PVC pipes sealed at the base and equipped with a 0.3 m screens at the bottom end. At 292
every location, piezometers reached 3 m below the surface so that the bottom end would 293
always be at or below the elevation of the river bed. However, because of the surface 294
microtopography, the piezometers extended to various depths within the alluvial aquifer 295
(Figure 3c). A river stage gauge was installed on the riverbed, near the study site to 296
monitor water levels in the Matane River at 15 min intervals (Figure 2c). The 297
piezometers and the river gauges were equipped with automated loggers (Hobo U20-001, 298
accuracy of 10 mm) for water level and water temperature measurements at 15 min 299
intervals. The time period analyzed in this paper is between June and October 2011 (data 300
acquisition continued after this period). The time-series were corrected for barometric 301
pressure from a Barologger located at the study site. 302
Figure 3. Piezometer transects showing water table elevation (masl) for a) for the De
303
la Roche River with wetland A (DLR-WA), b) for the De la Roche River wetland B
304
(DLR-WB), and c) for the Matane River. The water levels are average values from
305
the study periods on the two rivers.
For Peer Review Only
Between June and October 2012, total precipitation was 558 mm at the Philipsburg 307
weather station located near the DLR River. During the same period in 2011, total 308
precipitation was 356 mm at the Saint-Rene weather station located near the Matane 309
River experimental site. Air temperature measured at the Philipsburg weather station 310
between June 20th and October 25th 2012 varied from -2.6oC (October 13) and 34.6oC 311
(August 4), with an average of temperature of 17.1oC. During the same period in 2011, 312
air temperature measured at the Saint-René weather station varied from -6.1oC (October 313
7) and 29.8oC (July 4), with an average of 14.9oC. 314
Time series analyses
315
On the two rivers, water level and temperature fluctuations in the river and in the 316
piezometers were analyzed through cross-correlation analyses using the software PAST 317
(Hammer et al. 2001). This analysis provides information on the causal relationship 318
between the input and output time series, and can thus be used to determine the influence 319
of one series on the other based on the lag time between the two series and on the 320
intensity of the correlation. The analyses were used to determine autocorrelations of the 321
time series, and the level of correlation between 1) water level in rivers and in 322
piezometers and 2) water level in rivers and water temperature in piezometer. The entire 323
times series were considered for the computation of the analyses. Cross-correlations 324
performed on time series for each flood event of these time series are described for the 325
Matane River by Cloutier et al. (2014) and on a longer time period in Buffin-Bélanger et 326
al. (2015). 327
Storage calculation
328
To provide a quantitative estimate of wetland storage during a rain event, a simple 329
calculation was performed where recharge (w; precipitation + river) is the product of 330
change in water level (∆htot; measured value) and effective porosity of the sediments (ne;
331
estimated) (Equation 1). The change in water level from precipitation (∆hrain; not
332
measured directly) can be estimated from the ratio between the volume of precipitation 333
(Prec; measured) and the effective porosity (Equation 2). The change in water level 334
resulting from the river (∆hriv) is the difference between the total water level variation
335
and that from precipitation alone (Equation 3). The river contribution to water levels 336
For Peer Review Only
(Riv; not measured) is the product of ∆hriv and the effective porosity (Equation 4). The
337
supplementary storage from the river per millimeter of rain is thus calculated using 338 Equation 5. 339 w = ∆htot x ne (1) 340 ∆hrain = Prec / ne (2) 341
∆hriv = ∆htot - ∆hrain (3)
342
Riv = ∆hriv x ne (4)
343
Sriv = Riv / Prec (5)
344 345 Results 346 Water levels 347
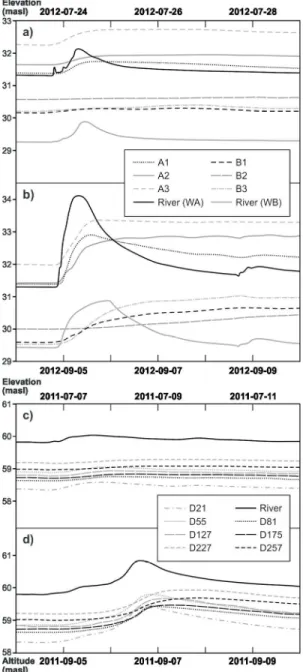
On the DLR River near WA, the water table fluctuated synchronously with the river level 348
(Figure 4a). The river was generally gaining compared to the entire wetland. Starting 349
with the 59 mm event of July 23 (flow rate of 2 m3/s) and during the summer, major 350
rainfall events created a temporary increase in the river level beyond the elevation of the 351
piezometers A1 and A2. For the July 23 event, the precipitation had a non-negligible 352
impact on water levels in the three piezometers at WA (e.g. 0.33 m in 14 h for A1), 353
considering the low river stages at that time (Figure 4a). The inversion of the river-354
piezometer hydraulic gradient was more marked during the fall rain events, starting with 355
the 61 mm precipitation event of September 5, where the river levels then sometimes 356
exceed the elevation of the water level in piezometer A3. After this event, the water level 357
in the WA piezometers rose more markedly (1.5 m in 15 h for A1), and then decreased 358
very gradually. This difference in reaction for a rain event of similar amplitude was not 359
explained by rainfall intensity (8.4 mm/h in July and 5.1 mm/h in September). It could be 360
explained by the maximum flow rate reached during the flood which was much lower in 361
July (2 m3/s) than in September (16 m3/s). 362
Figure 4. Water level variations a) for the De la Roche River with wetland A (WA),
363
b) for the De la Roche River with wetland B (WB), and c) for the Matane River
364
(modified from Cloutier et al. 2014). Water levels in the Matane River are higher
For Peer Review Only
than piezometer levels because the gauging station is located upstream from the
366
piezometers. The arrows indicate the rain events illustrated in Figure 5.
367
In WB, the river water levels were much lower than those of the three piezometers for the 368
early part of the summer and the aquifer response to rise in river stage was very limited. 369
The groundwater levels gradually declined throughout the summer until the September 5 370
event, which induced a considerable rise in WB piezometers (with a 16 m3/s flow rate). 371
For this event and for the 26 mm precipitation event on October 6, levels in the river 372
temporarily exceeded the levels in the three piezometers. Water levels in piezometer B2 373
reacted very little to increases in river levels. During the July 23 event, the change in 374
piezometer levels at WB was smaller and slower than at WA (0.15 m in 50 h for B1). 375
During the September event, the water level in the WB piezometers (Figure 5a) rose even 376
more slowly (1.1 m in 98 h for B1). 377
At WB, the difference in reaction for two rain events of similar amplitude can also be 378
explained by the presence of over-bank flow (which occurs at a river stage of 31.5 m) 379
during the September event (WA over-bank occurs at a river stage of 34.5 m which did 380
not occur during the summer 2012). The flood hydrograph for the September event at 381
WB (and all the flood events in the fall of 2012) had a distinct shark fin shape (Figure 382
5b), even though the peak level at the gauging station located at the end of the piezometer 383
transect (see Figure 2b) is below bankfull. The analysis of aerial photographs indicated 384
the presence of a log jam upstream from the WB transect at the same time as the shark fin 385
shaped hydrograph. 386
In contrast, on the Matane River, the water levels on the D55-D127-D257 transect (cf. 387
Figure 3c) were approximately equal to those in the river. This was maintained 388
throughout the 2011 summer period (on Figure 4c water levels in the Matane River were 389
higher than piezometer levels because the gauging station is located upstream from the 390
piezometers). Groundwater levels in the regional aquifer were higher than those in the 391
floodplain, indicating the presence of groundwater inflow towards the river. It is not 392
uncommon for the water table to be lowest in the floodplain in regionally gaining rivers 393
because of high evapotranspiration rates by floodplain vegetation (Jolly 1996; Burt et al. 394
For Peer Review Only
2002). The small water level fluctuations in the river following the July 5-7 rain event 395
(34 mm) generated limited changes (0.22 m in 22 h for D21) in the water level of all 396
piezometers (Figure 5c). During the 58 mm event of September 4-5 (Figure 5d), the 397
piezometer water levels increased more considerably (e.g. 1.1 m in 53 h. In all cases, the 398
piezometer water levels decrease rapidly following the flood peak in the river. Cloutier et 399
al. (2014) have attributed this short rapid decrease to the passage of an underground 400
floodwave which is further analyzed by Buffin-Bélanger et al. (2015). 401
Figure 5. Changes in river and piezometer water levels (masl) for both wetlands in
402
the DLR following rain events occurring on a) July 23 2012 (59 mm), and b)
403
September 5 2012 (61 mm); changes in river and piezometer water levels in the
404
Matane River following rain events occurring on c) July 5-7 2011 (34 mm), and d)
405
September 4-5 2011 (58 mm).
406
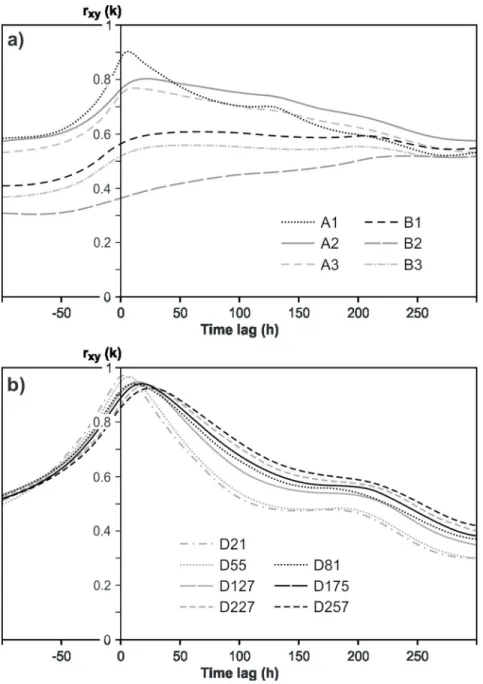
The contrast in hydrological connections between the three studied wetlands appears 407
clearly in the cross-correlation analysis of the river levels and piezometer levels 408
(Figure 6). The cross-correlation coefficients rxy(k) are higher in the Matane River
409
(Figure 6b, followed by WA and WB on the DLR River (Figure 6a). The time lags are 410
considerably different between WA and WB on the DLR River (Figure 6a). The time lag 411
between the peak in the river and in the piezometers is the shortest for WA (6 hours), 412
with a high rxy(k) value of 0.90. The maximum correlation for WB is 0.61, with a time
413
lag of 74 hours. The time lags in WA are similar to those of the Matane River which vary 414
from 3 to 26 hours from the closest (D55) to one of the farthest (D175) piezometers. 415
Finally, on the Matane River, the lag time increases as the distance between the river and 416
a given piezometer increases for the Matane River (Figure 6b). 417
Figure 6. Cross-correlation functions (rxy(k)) of river water levels as input and 418
piezometer water levels as output a) for the De la Roche River, and b) for the
419
Matane River
420
Water temperature
421
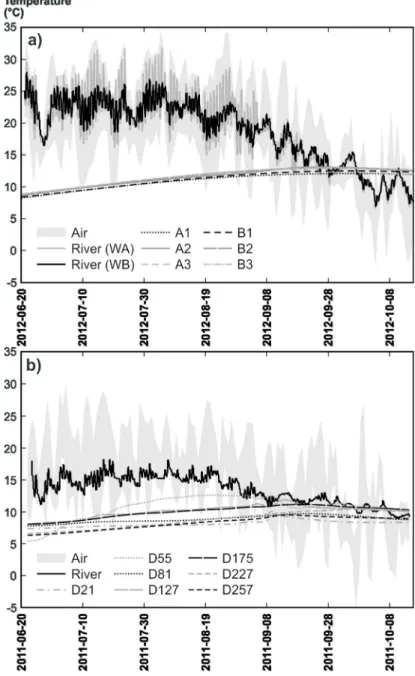
Between the end of June and the end of August (considered as the summer period), the 422
For Peer Review Only
DLR River and 11.3oC on the Matane River (maximum of 19.5 °C). This amplitude was 424
attenuated in the river at all three sites, with average values of 6.9, 3.4 and 0.8 °C (max 425
values of 11.6, 5.2 and 2.3oC) for WA, WB and in the Matane River respectively 426
(Figure 7). The larger attenuation in WB compared to WA was due to the presence of a 427
localized groundwater contribution immediately upgradient from WB (identified as “cold 428
spot” in Figure 2b). This groundwater inflow was confirmed by Distributed Temperature 429
Sensor (DTS) measurements and 222Rn analyses not shown here (Biron et al. 2013; 430
Needelman 2014). Interestingly, at all three sites, the amplitude of water temperature was 431
reduced considerably from mid-September, with maximum daily amplitudes of 3, 2.5 and 432
1.1oC for WA, WB and the Matane River, respectively. Later in the fall, the water 433
temperature in the river near both WA and WB was nearly identical (Figure 7a). The 434
simultaneous attenuation was probably due to a reduction in solar radiation at that time of 435
year, and to an increase in river flow and groundwater flow. Water temperature in the 436
DLR River piezometers was very similar throughout the study period, i.e. it did not 437
change with distance to the river or between WA and WB. It progressively increased 438
throughout the summer and early fall (Figure 7a). There is less temporal variability in the 439
river temperature in the Matane River than in the DLR River, but more variability 440
between piezometers due to the floodplain micro-topography and to screen depths 441
(Figure 7b). 442
Figure 7. Water temperature a) for the De la Roche River near wetlands A and B
443
along with the temperatures in the piezometers of wetland A (wetland B piezometers
444
show the same pattern), and b) for the Matane River and the piezometers.
445
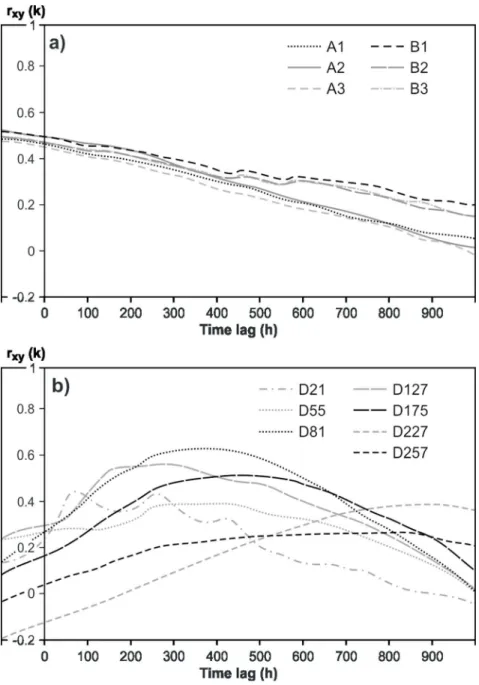
There is no peak in cross-correlation with the DLR River wetlands where correlation 446
between levels in the river and piezometer temperature decreases linearly with time 447
(Figure 8a). The cross-correlation analysis between river water levels and temperature in 448
the piezometers reveal a clear peak for all piezometers in the Matane River, with time 449
lags ranging from 75 hours for the closest piezometer (D21), to 258-446 hours for those 450
at intermediate distances (D55, D81, D127, D175), and up to 829 and 849 hours for the 451
longer distances (D223 and D257) (Figure 8b). 452
For Peer Review Only
Figure 8. Cross-correlation functions of river water levels as input and piezometer
453
water temperature as output a) for the De la Roche River, and b) for the Matane
454
River
455
Wetland storage
456
Wetland storage is first estimated qualitatively using the autocorrelation function of the 457
water level time series (Figure 9), in analogy to the memory effect used in karst 458
hydrology (cf. Larocque et al. 1998). The memory effect is a qualitative assessment of 459
the capacity of the system to keep trace of a given event through time in its hydraulic 460
response. The longer it takes the autocorrelation function to cross the abscissa, the larger 461
the system memory effect. The autocorrelation functions of the river at the two DLR 462
wetlands are very similar, crossing r(k)=0 between 1200 and 1400 h (Figure 9a). The 463
memory effect of WA is similar to that of the river, albeit with stronger r(k) for short time 464
lags. At WB, the memory effect is shorter with r(k)=0 between 600 and 800 h. The 465
autocorrelation functions of the Matane River (Figure 9b) are in sharp contrast to those of 466
the DLR River. All the time series exhibit very similar r(k) throughout the time lag 467
interval, with the piezometers closest to the river (D21 and D55) following the river 468
autocorrelation the closest. 469
Figure 9. Autocorrelation functions of river and piezometer water levels a) for the
470
De la Roche River, and b) for the Matane River.
471
Wetland storage was estimated for the DLR WB and for the Matane River. The DLR WB 472
was excluded from this exercise because results from this work show that the storage 473
capacity of WB is from surface depressions, the volume of which was not quantified in 474
this work. Effective porosity (ne) of the coarse sand/gravel of the Matane River wetland is
475
estimated to be 0.25 (Cloutier et al. 2014) while that of the sandy silt of WA is estimated 476
to be 0.1 (Freeze and Cherry 1979). The calculation was performed for all piezometers on 477
the two wetlands for the September rain events (2012 on the De la Roche River, and 2011 478
on the Matane River). 479
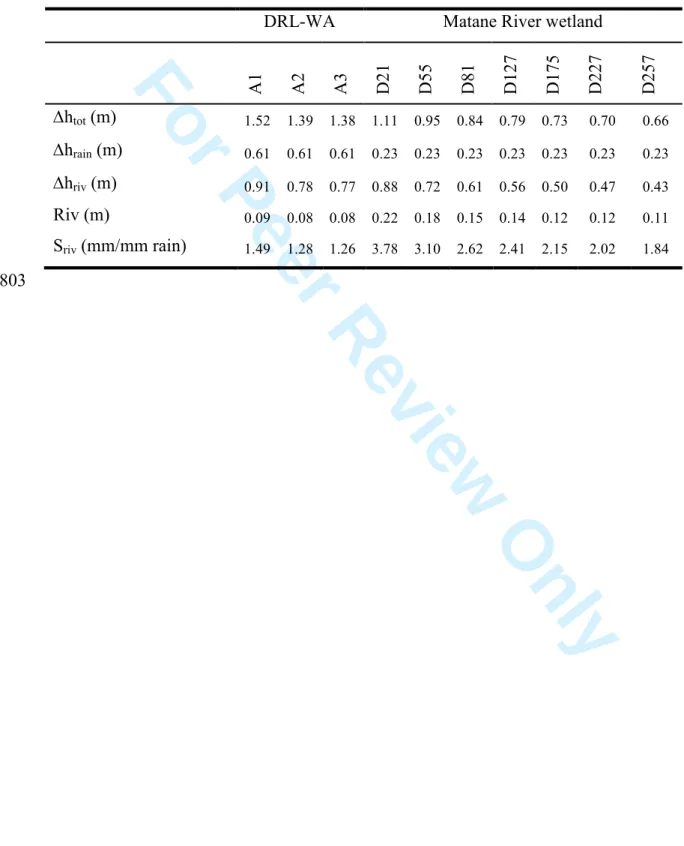
The increase in wate storage due to a rain (∆hrain) event is 0.61 m for the DLR WA and is
480
0.23 m for the Matane River. The increased heads after a flood event (∆hmes) are
For Peer Review Only
considerably larger in WA on the DLR River and in the Matane River, as it varies from 482
1.38 (A3) to 1.52 m (A1) on the DLR, and from 0.66 (D257) to 1.11 m (D21) on the 483
Matane River. The storage capacity of the DLR WA varies from 1.26 (A3) to 1.49 (A1) 484
mm of storage per mm of rain, and smaller than that of the Matane River wetland which 485
varies from 1.84 (D257) to 3.78 mm (D21). 486
Table 2. Storage capacity on the De la Roche River for Wetland A, and on the
487
Matane River wetland. The calculation is for the September rain events (2012 on the
488
De la Roche River, and 2011 on the Matane River)
489 490 491
For Peer Review Only
Discussion
492
Response time
493
The lower cross-correlation coefficients for the DLR River reveal the more limited 494
response of the aquifer to the rising river stages. However, because the piezometer 495
reaction during flood events varies between the summer and the fall with markedly 496
different flow rates induced by similar rain events, a shorter period cross-correlation 497
analysis (e.g. event-based, not performed here) is considered to better reflect differences 498
in exchanges during a season (cf. Buffin-Bélanger et al. 2015). 499
To explain the different time lags in the three wetlands, it is important to note that flood 500
events are very different in the two rivers. It is hypothesized that this difference is mainly 501
due to the difference in the size of the watershed, but this could not be verified due to the 502
limited number of sites. The rising limb of a flood lasted between 13 and 25 hours in the 503
DLR River, and lasted on average 74 hours in the Matane River. The shorter time lags 504
observed for WA and for the Matane River are explained by the coarser sediments that 505
facilitate the transfer of the pressure wave in the riparian zone. The longer time lags for 506
WB can be related to the longer residence times evidenced by Helton et al. (2014) during 507
over-bank flow events. In WB, log jams probably induce an increase in water levels 508
locally, beyond the bankfull level, resulting in over-bank flow towards the wetland. 509
Evidence of such over-bank flow to the wetland was repeatedly observed in the upstream 510
bend of the river which is in contact with WB. Once in the wetland, water can be stored 511
for a period of time ranging from a few days to weeks. According to Cloutier et al. 512
(2014), this is due to the propagation of a groundwater floodwave throughout the Matane 513
floodplain. This is not observed in the DLR River study sites, probably because of the 514
smaller size sediments and, for WA, because of the piezometer position relative to 515
hydrostratigraphic pathways from the abandoned meander. 516
The duration of standing water within a wetland is called the hydroperiod (Hayashi and 517
Rosenberry 2002). The hydroperiod concept is closely linked to the response time of the 518
wetland when the river levels increase. A long response time to a rain event reflects a 519
considerable wetland storage capacity, as well as delayed and less important downstream 520
floods. If long response times are repeated throughout the year, it can be hypothesized 521
For Peer Review Only
that they could be associated with a long hydroperiod. The latter have been associated 522
with increased species richness within a wetland (e.g. Snodgrass et al. 2000; Chessman 523
and Hardwick 2014). 524
The cross-correlation between river water levels and temperature in the piezometers is 525
considered as an indication of the transfer of water from the river towards the alluvial 526
aquifer (Figure 8). The positive rxy(k) observed for all piezometers indicates that as the
527
river water level increases, groundwater temperature in the floodplain also increases, and 528
vice-versa. Because river water temperature is higher than that of the floodplain 529
groundwater during most of the season and for most of the piezometers, this can be 530
interpreted as an actual displacement of river water through the highly permeable 531
floodplain when river water levels increase and when hydraulic gradients are reversed 532
due to momentarily increased river water levels. The absence of a peak in cross-533
correlation in the DLR River wetlands indicates that the brief flow reversals observed 534
after a rain event do not result in the displacement of significant water volumes from the 535
DLR River to the river bank. 536
On the Matane River wetland, the average water velocity estimated from the time lag to 537
distance relationship is similar for all the piezometers and varies from 0.23 to 0.49 m/h. 538
This is one order of magnitude lower than the floodwave propagation velocity of 6.7-539
11.5 m/h and one order of magnitude higher than the estimated Darcy velocity (Cloutier 540
et al. 2014). This could be due to a smaller effective porosity or an underestimation of the 541
floodplain hydraulic conductivity. It could also indicate that floodwave propagation and 542
groundwater displacement are superimposed in the floodplain. 543
Wetland storage
544
Water storage is often cited as an important hydrologic function of different wetlands 545
types (McKillop et al. 1999; Shook et al. 2013). Landscape position is considered to 546
influence wetland storage and floodplain wetlands generally have a greater potential than 547
headwater wetlands to store water and reduce flooding (Acreman and Holden 2013). 548
Quantifying the volume of stored water within a floodplain or riverine wetland during a 549
flood event is nevertheless a challenge. Considering autocorrelations of the water level 550
For Peer Review Only
time series and memory effects provide a qualitative assessment of the type of river-551
wetland-aquifer connections. On the DLR, the memory effect at WA is similar to that of 552
the river, which can be interpreted as reflecting a bank storage. The shorter memory in 553
WB compared to that of the river indicates a disconnection between the river and its 554
wetland. In the Matane River, the similarity between the autocorrelation functions of all 555
the wetland piezometers and that of the river itself reflects the fact that the highly 556
permeable floodplain and its associated wetland have a strong hydraulic connection. The 557
river and its wetland are strongly connected hydraulically, and during rain events the 558
floodplain acts as a prolongation of the river bed. 559
The measured water level variation (∆hmes) is higher than the one expected only from
560
precipitation (∆hrain) on the two wetlands (Table 2). This is considered to represent the
561
additional input of water from the river to the floodplain during a flood event and reflects 562
the hydrologic storage of the Matane River floodplain as an extension of the river during 563
flood events. Although a floodwave was not observed in WA, the storage calculations 564
could indicate that this process also occurs in WA, to a more limited extent. It is assumed 565
that a single value of effective porosity is sufficient to describe each wetland. This 566
parameter could vary considerably in the floodplain due to the presence of the wetlands. 567
Here, it is considered that most of the head variations occur in the inorganic sediments, 568
but this was not measured in situ. 569
The two connected wetlands (WA and Matane River) thus play distinct hydrological roles 570
in storing flood water. Removing WA would probably not change in a significant way the 571
DLR River flow rates which already react very rapidly to rain events. However, limiting 572
activities within the river corridor could enhance wetland development and water storage, 573
as well as contribute to attenuate floods and reduce sediment transport. Because of its 574
larger storage capacity, removing the Matane River wetland could have a larger impact 575
on downgradient flow rates, but this cannot be quantified with the available data. 576
Riverine wetland typology
577
Although they are of similar size, results from this study indicate that the three wetlands 578
have distinct hydrological connections to the aquifer and to the river. During high flows, 579
For Peer Review Only
is very limited (due to low K sediments) and overland storage dominates. In the Matane 581
River wetland, floodwave propagation occurs essentially through the floodplain, as the 582
flood energy is partly dissipated within the coarse sediments. Storage of flood water per 583
millimeter of rain is largest at this site. Figure 10 is derived from the typology suggested 584
in Ramsar (2005) for bank storage and overland storage conditions, and complemented 585
with the floodwave attenuation conditions from the Matane River. It summarizes the 586
three exchange types observed in this study for southern Québec geological and 587
climatologic conditions, in contrast to other attempts to establish a typology of floodplain 588
connected channels (e.g. Riquier et al. 2015), where the focus is more on grain size than 589
on hydrological connections. As underlined in Ramsar (2005), any given wetland may 590
not fit exactly in a given type of connections and many wetlands can exhibit 591
characteristics of more than one type. The typology presented here is expected to reflect 592
end-members in a wide range of possible conditions. 593
Figure 10. Typical river-wetland-aquifer connections with a) bank storage, b)
594
overland storage, and c) flood wave attenuation (adapted from Ramsar 2005). P is
595
precipitation, E is evaporation, L is lateral inflow, D is drainage, OB is over-bank
596
flow, GS is groundwater seepage, GD is groundwater discharge, and GR is
597
groundwater recharge
598
This contrast between wetlands raises questions about whether or not the role of riverine 599
wetlands can be generalized when managing rivers. Hydraulic conductivity is clearly a 600
key variable regulating river-wetland-aquifer exchanges, as illustrated by the close 601
connection between piezometer and river level in the Matane River highly permeable 602
coarse sand/gravel floodplain, and the quasi-absence of connection in the DLR WB 603
where clayey silts are present. Reach geomorphology appears linked with material 604
permeability, with more flow exchanges in the DLR WA and in the Matane River where 605
abandoned meanders loops have deposited permeable material (cf. Figure 2). The stable 606
reach of the DLR WB is characterized by lower permeability materials which greatly 607
limit hydraulic connections. In the DLR WA and Matane River reaches, meandering 608
lateral migration and avulsion processes have contributed to deposit permeable material 609
which, by sustaining river-aquifer exchanges, have resulted in the input of mineralized 610
For Peer Review Only
groundwater and have therefore contributed to the onset of wetland type vegetation. 611
Locally, different states of connection between groundwater and surface water are 612
recognized in the scientific literature and can be assessed with hydraulic conductivity and 613
water table position (e.g.Brunner et al. 2009). At the landscape scale, the hydrologic 614
exchanges are also controlled by the geometry and position of the stream channel within 615
the alluvial plain (Woessner 2000). Results from this study suggest that fluvial 616
meandering processes may play a larger role than previously acknowledged in 617
determining the connections between rivers, wetlands and aquifers in the riverine 618
corridor. The geometric position of the wetland relative to the river and the specific 619
meandering dynamics in a variety of geological and climatic contexts are probably also 620
important factors that drive riverine wetland-aquifer connections, but this could not be 621
identified in the current study. 622
Conclusion
623
The objective of this research was to better understand what drives the surface water level 624
regime in riverine wetlands. The study was performed on two southern Québec rivers of 625
contrasted geomorphological contexts, the De la Roche River and the Matane River. 626
Results from this work highlight the importance of the geomorphic setting in 627
understanding similarities and differences between wetlands. The two wetlands on the De 628
la Roche River exhibit marked contrast in hydrological connection despite similar size 629
and geomorphic position relative to the river. This suggests that conducting a 630
hydrogeomorphological assessment of a study zone is an essential step to understand the 631
full extent of flow connectivity variations within riverine wetlands. 632
Reconnecting rivers to their floodplains and associated wetlands is a rising consideration 633
in river management, but ecosystem services rendered by riverine wetlands may vary 634
greatly. There is clearly a need to derive a typology of river-wetland-aquifer connectivity 635
that goes beyond the site-specific case. This study is a first step in that direction, setting 636
the baseline for a broadly applicable framework. 637
For Peer Review Only
Acknowledgements
639
This project was funded by the Ouranos consortium on regional climatology and adapta-640
tion to climate change, as part of the ‘‘Fonds vert’’ for the implementation of the Québec 641
Government Action Plan 2006–2012 on climate change and its measure 26 (Grant 642
#510014-101). The authors thank three anonymous reviewers and the Associate Editor 643
for constructive comments that helped improving significantly the overall quality of the 644
paper. 645
For Peer Review Only
References
647
Acreman, M.C. and J. Holden. 2013. How wetlands affect floods. Wetlands, 33:773-786. 648
Acreman, M.C. 2004. Impact assessment of wetlands: focus on hydrological and hydro-649
geological issues. Phase 2 report. Center for Ecology and Hydrology, Wallingford, 650
U.K. 651
Amoros C. and G. Bornette. 2002. Connectivity and biocomplexity in waterbodies of 652
riverine floodplains. Freshwater Biology 47:761-776. 653
Arnaud-Fassetta G., L. Astrade, É. Bardou, J. Corbonnois, D. Delahaye, M. Fort, E. Gau-654
tier, N. Jacob, J. Peiry, H. Piégay and M. Penven. 2009. Fluvial geomorphology and 655
flood-risk management. Géomorphologie : relief, processus, environnement 2:109-656
128. 657
Biron, P.M., T. Buffin-Bélanger, M. Larocque, G. Choné, C.A. Cloutier, M.A. Ouellet, S. 658
Demers, T. Olsen, C. Desjarlais, J. Eyquem, J. 2014. Freedom space for rivers: a sus-659
tainable management approach to enhance river resilience. Environmental Manage-660
ment doi 10.1007/s00267-014-0366-z
661
Biron, P.M., T. Buffin-Bélanger, M. Larocque, S. Demers, T. Olsen, M.A. Ouellet, G. 662
Choné, C.A. Cloutier, M. Needelman. 2013. Espace de liberté: un cadre de gestion in-663
tégrée pour la conservation des cours d’eau dans un contexte de changements clima-664
tiques. Rapport présenté au Consortium Ouranos dans le cadre du PACC-26. 170 p. 665
Brunner, P., P.G. Cook and C.T. Simmons. 2009. Hydrogeologic controls on disconnec-666
tion between surface water and groundwater. Water Resources Research. 45, W01422 667
Bullock, A. and M. Acreman. 2003. The role of wetlands in the hydrological cycle. Hy-668
drology and Earth System Sciences 7(3): 358-389.
669
Buffin-Bélanger, T., P. Biron, M. Larocque, S. Taylor, G. Choné, M.A. Ouellet, C.A. 670
Cloutier, C. Desjarlais, J. Eyquem. 2015. Freedom space for rivers: an economically 671
viable river management concept in a changing climate. Geomorphology doi: 672
10.1016/j.geomorph.2015.05.013. 673
Buffin-Bélanger, T., C.A. Cloutier, C. Tremblay, G. Chaillou, M. Larocque. 2015. Dy-674
namics of groundwater floodwaves and floodings in an alluvial aquifer. Canadian Wa-675
ter Resources Journal.
For Peer Review Only
Burt, T.P., G. Pinay, F.E. Matheson, N.E. Haycock, A. Butturini, J.C. Clement, S. Dan-677
ielscu, D.J. Dowrick, M.M. Hefting, A. Hillbricht-Ilkowska and V. Maitre. 2002. Wa-678
ter table fluctuations in the riparian zone: comparative results from a pan-European 679
experiment. Journal of Hydrology 265: 129-148. 680
Chessman, B.C. and L. Hardwick. 2014. Water regimes and macroinvertebrate assem-681
blages in floodplain wetlands of the Murrumbidgee River, Australia. Wetlands, 682
34:661-672. 683
Cloutier, C.A., T. Buffin-Belanger and M. Larocque. 2014. Controls of groundwater 684
floodwave propagation in a gravelly floodplain. Journal of Hydrology 511: 423-431. 685
Constantine JA, Dunne T, Piégay H, Kondolf GM. 2010. Controls on the alluviation of 686
oxbow lakes by bed-material load along the Sacramento River, California. Sedimen-687
tology 57(2): 389–407.
688
Cronin, C.M. 1977. Late-Wisconsin marine environments of the Champlain Valley (New 689
York, Québec). Quaternary Research 7: 238-253. 690
Dennis, J.G. 1964. The geology of the Enosburg Area, Vermont. Vermont Geological 691
Survey Bulletin No. 23. Montpelier, VT, Vermont Development Department. 692
Dubois, M., J.F. Martel, C. D'Auteuil, G.P. Prichonnet and M. Laithier. 2011. Le portrait 693
du bassin versant de la baie Missisquoi. Document 3 du Plan directeur de l'eau. 694
Organisme de bassin versant de la baie Missisquoi, 180 p. 695
Džubáková, K., H. Piégay, J. Riquier and M. Trizna. 2015. Multi-scale assessment of 696
overflow-driven lateral connectivity in floodplain and backwater channels using 697
LiDAR imagery. Hydrological Processes 29: 2315-2330. 698
Emmett, B.A., J.A. Hudson, P.A. Coward and B. Reynolds, 1994. The impact of a 699
riparian wetland on streamwater quality in a recently afforested upland catchment. 700
Journal of Hydrology 162: 337-353.
701
Environment Canada. 2013. «Canadian Climate Normals 1971-2000 Philipsburg 702 Station». Online. 703 <http://www.climate.weatheroffice.gc.ca/climate_normals/results_e.html?stnID=5431 704 &lang=e&dCode=1&province=QUE&provBut=Search&month1=0&month2=12>. 705 Consulted on May 7, 2013. 706
Freeze, R.A. and J.A. Cherry. 1979. Groundwater. Prentice Hall, Englewood Cliff. 707
For Peer Review Only
Hammer, Ø, D.A.T. Harper and P.D. Ryan. 2001. Past: Paleontological statistics software 708
package for education and data analysis. Palaeontologia Electronica 4(1), 9. 709
Hayashi, M. and D.O. Rosenberry. 2002. Effects of Ground Water Exchange on the Hy-710
drology and Ecology of Surface Water. Ground Water 40(3): 309-316. 711
Helton, A.M., G.C. Poole, R.A. Payn, C. Izurieta and J.A. Stanford. 2014. Relative influ-712
ences of the river channel, floodplain surface, and alluvial aquifer on simulated hydro-713
logic residence time in a montane river floodplain. Geomorphology 205:17-26. 714
Hudson P.F. 2010. Floodplain Lake Formation and Dynamics in the Lower Reaches of 715
the Large Texas Coastal Plain Rivers: Brazos, Guadalupe, and San Antonio Rivers. 716
Austin: Texas Water Development Board, report no. 0600010583. Online. 717
http://www.twdb.texas.gov/publications/reports/contracted_reports/doc/0600010583/t 718
wdb-hudson-final-report_without-appen.pdf 719
Hudson, P.F., F.T. Heitmuller and M.B. Leitch. 2012. Hydrologic connectivity of oxbow 720
lakes along the lower Guadalupe River, Texas: The influence of geomorphic and cli-721
matic controls on the ‘‘flood pulse concept’’. Journal of Hydrology 414:174-183. 722
Jolly, I.D. 1996. The effects of river management on the hydrology and hydroecology of 723
arid and semi-arid floodplains, In “The effects of river management on the hydrology 724
and hydroecology of arid and semi-arid floodplains”. Anderson, M.G., S.E. Walling 725
and P.D. Bates [Eds.] pp. 577-609. Wiley, New York. 726
Kline M. and B. Cahoon. 2010. Protecting river corridors in Vermont. Journal of the 727
American Water Resources Association 46(2):227-236.
728
Larocque, M., A. Mangin, O. Banton M. Razack and O. Banton. 1998. Contribution of 729
correlation and spectral analyses to the regional study of a large karst aquifer. Journal 730
of Hydrology 205: 217-231.
731
Lebuis, J., 1973. Geologie du Quaternaire de la region de Matane-Amqui- Comtes de 732
Matane et de Matapedia. Rapport DPV-216, Ministère des Richesses naturelles, Direc-733
tion générale des Mines, Gouvernement du Québec, Québec, Canada. 18 p. 734
Lowry, C.S., J.F. Walker, R.J. Hunt and M.P. Anderson, 2007. Identifying spatial varia-735
bility of groundwater discharge in a wetland stream using a distributed temperature 736
sensor. Water Resources Research 43, W10408, doi:10.1029/2007WR006145. 737
For Peer Review Only
Marchand, P., T. Buffin-Bélanger, B. Hétu, G. St-Onge. 2014. Holocene stratigraphy and 738
implications for fjord valley-fill models of the Lower Matane River valley, Eastern 739
Québec, Canada. Canadian Journal of Earth Sciences doi: 10.1139/cjes-2013-0054 740
McKillop, R., N. Kouwen and E.D. Soulis. 1999. Modeling the rainfall-runoff response 741
of a headwater wetland. Water Resources Research 35(4): 1165-1177. 742
MDDELCC (Ministère du Développement durable, de l’Environnement et de la Lutte 743
contre les changements climatiques – Québec). 2014. 744
www.mddep.gouv.qc.ca/eau/souterraines/sih/index.htm. 745
Mehrtens, C.M. and R.J. Dorsey. 1987. Stratigraphy and bedrock geology of the North-746
western portion of the St. Albans quadrangle and the adjacent Highgate Center quad-747
rangle, Vermont. Vermont Geological Survey Special Bulletin No 9, 28 p. 748
Moisan, C. 2011. Végétation des milieux humides de la rivière de la Roche. Rapport 749
soumis à Marie Larocque, dans le cadre du projet Espace de liberté. Institut de re-750
cherche en biologie végétale (IRBV): 19 p. 751
Needelman, M. 2014. Assessing the role of wetlands in the river corridor through 752
groundwater and stream interactions. MSc thesis, Université du Québec à Montréal, 753
64 p. 754
Ollero A. 2010. Channel changes and floodplain management in the meandering middle 755
Ebro River, Spain. Geomorphology 117(3-4):247-260. 756
Piégay H., S. E. Darby, E. Mosselman and N. Surian. 2005. A review of techniques 757
available for delimiting the erodible river corridor: A sustainable approach to manag-758
ing bank erosion. River Research and Applications 21(7) : 773-89 759
Phillips, J.D. 2008. Geomorphic controls and transition zones in the lower Sabine River. 760
Hydrological Processes 22: 2424-2437.
761
Phillips, J.D. 2013. Hydrological connectivity of abandoned channel water bodies on a 762
coastal plain river. River Research and Applications 29: 149-160. 763
Racchetti, E., M. Bartoli, E. Soana, D. Longhi, R.R. Christian, M. Pinardi and P. Viaroli. 764
2011. Influence of hydrological connectivity of riverine wetlands on nitrogen removal 765
via denitrification. Biogeochemistry 103: 335-354. 766
Ramsar. 2005. Guidelines for the management of groundwater to maintain wetland eco-767
logical character. 9th Meeting of the Conference of the Parties to the Convention on 768