The Design of a HSMM-Based Operator State Modeling Display
The MIT Faculty has made this article openly available.
Please share
how this access benefits you. Your story matters.
Citation
Castonia, Ryan, Yves Boussemart, and Mary Cummings. “The
Design of a HSMM-Based Operator State Modeling Display.” In AIAA
Infotech@Aerospace 2010. American Institute of Aeronautics and
Astronautics, 2010.
As Published
http://dx.doi.org/10.2514/6.2010-3527
Publisher
American Institute of Aeronautics and Astronautics
Version
Author's final manuscript
Citable link
http://hdl.handle.net/1721.1/81868
Terms of Use
Creative Commons Attribution-Noncommercial-Share Alike 3.0
1
The Design of a HSMM-based Operator State Modeling
Display
Ryan W. Castonia*, Yves Boussemart†, and Mary L. Cummings‡
Humans and Automation Lab, Massachusetts Institute of Technology, Cambridge, MA, 02139
This paper presents the findings from the design, development, and evaluation of a hidden semi-Markov model based operator state monitoring display. This operator state monitoring display is designed to function as a decision support tool for the supervisor of a small team of operators (2-4) that are each monitoring and controlling multiple highly autonomous, heterogeneous unmanned vehicles. After a cognitive task analysis was conducted to determine the functional and information requirements of the decision support tool, a human subject experiment was conducted to validate the design. Preliminary results show that the decision support tool improves team supervisor performance in terms of increased decision accuracy and decreased non-necessary interventions in single alert scenarios. In scenarios where the supervisor faced multiple simultaneous alerts, the decision support tool was shown to decrease non-necessary interventions and have no affect on supervisor decision accuracy. Additionally, the decision support tool was not shown to effect mental workload as measured by a secondary task. These initial results suggest that hidden semi-Markov operator state modeling can be effectively utilized in a real-time decision support tool for team supervisors.
I. Introduction
HE movement toward single operators controlling multiple unmanned vehicles (UVs) is gaining momentum throughout academia and industry as a whole.1-3 As this transition occurs, multiple operators will likely work together, under the leadership of a team supervisor, to carry out coordinated tasks, similar to present-day air traffic control (ATC) settings. There are many ways in which multiple operators and a supervisor could interact in these futuristic scenarios, one of which places the supervisor in a human supervisory control (HSC) role over the operators. This creates a complex HSC system in which decision support tools (DSTs) are needed to aid supervisors who must keep track of multiple complex automated systems, as well as multiple human operators.4
While there has been much effort in designing and developing displays for individual operators in charge of multiple UVs, there has been little research into what type of displays a team supervisor requires to most efficiently supervise the team,5 even though it is recognized that the role of the team commander is critical.6-7 Of the little research that begins to address the issue of team supervisor display, supervisors in human operator-unmanned vehicle teaming environments are typically only provided with situational awareness tools capable of identifying
current problems. Supervisory DSTs that attempt to predict the onset of possible future problems have not been
explored.8 This research is focused on developing a DST that utilizes the predictive capabilities of hidden semi-Markov models (HSMMs) for a supervisor of multiple, independent operators, i.e., operators are assigned their own areas of responsibility which do not significantly overlap. A brief overview of the underlying HSMM-based operator model is discussed in the next section. Then, our design and evaluation method is described. Next, the preliminary results are discussed. We then conclude and list possible future work.
* M.S. Candidate, Dept. of Aeronautics and Astronautics, 77 Mass. Ave. 33-407, Cambridge, MA, 02139, Student
Member.
†
Ph.D. Candidate, Engineering Systems Division, 77 Mass. Ave. 33-407, Cambridge, MA, 02139.
‡ Associate Professor, Dept. of Aeronautics and Astronautics, 77 Mass. Ave. 33-311, Cambridge, MA, 02139,
Associate Fellow.
2
II. HSMM-Based Operator Model
This research focuses on providing a team supervisor of multiple, independent operators with a DST in order to best maintain and improve team performance in a HSC setting. In order to accomplish this task, we have investigated multiple methods used to model human behavior as a time series such as neural networks, algorithmic data mining, exploratory sequential data analysis, partially observable Markov decision processes, hidden Markov models, and HSMMs. Most have drawbacks such as having little to no predictive power or requiring supervised learning techniques.9 However, research has shown that the structure of HSMMs makes them well suited for modeling human behavior in this HSC realm.10 Structurally, HSMMs consist of a set of hidden states, observable events, sojourn times, and transition probabilities. In Fig. 1, each is a hidden state, each is a transition probability between hidden states, the observable probability density functions link the state and the observable events each hidden state emits, and the sojourn probability density functions, , describe the amount of time an operator is likely to stay in each state.
Each hidden state emits observable events through a certain probability density function. Just as the hidden states in HSMMs must be inferred from observable events,
cognitive states of an operator are not directly visible and must be inferred from his or her actions. Therefore, operator cognitive states can be likened to the hidden states in an HSMM, and operator interface interactions (i.e., mouse clicks) can be likened to the HSMM observable events. This structure allows for the prediction of future operator behavior but is limited by the semi-Markov assumption§. Other limitations include the need for accurate training data in order to ensure the model accurately recognizes the correct patterns and decreased confidence in future predictions as the prediction window increases. Moreover, such models cannot detect whether an abnormal pattern is good or bad, only that it is different, which is why the supervisor’s judgment is needed. Thus, full automation is not feasible; the human must remain part of the system. Additionally, the complex probabilistic nature of the outputs from HSMMs, indeed all Markov-based models, results in difficulty in designing a decision support interface for a team supervisor unlikely to possess the background required to understand them.
Recent advances in operator modeling through HSMM-based behavioral pattern recognition and prediction have shown that these algorithms can drive a real-time supervisor’s predictive display.10 However, the difficulty lies in the effective display of the probabilistic output from the HSMM-based
operator model since humans have difficulty interpreting and acting on probabilities.11 The next section addresses the design of the HSMM-based operator state modeling display and the human subject trial used to validate the design.
III. Method
A. Decision Support Tool Design
First, a cognitive task analysis (CTA) was performed in order to generate display requirements, both functional and information requirements, for the task of team supervision of 2-4 operators, each independently controlling a set
§ The semi-Markov assumption states that the transition to the next state is only based on the current state and the
amount of time that has been spent in that state.
3
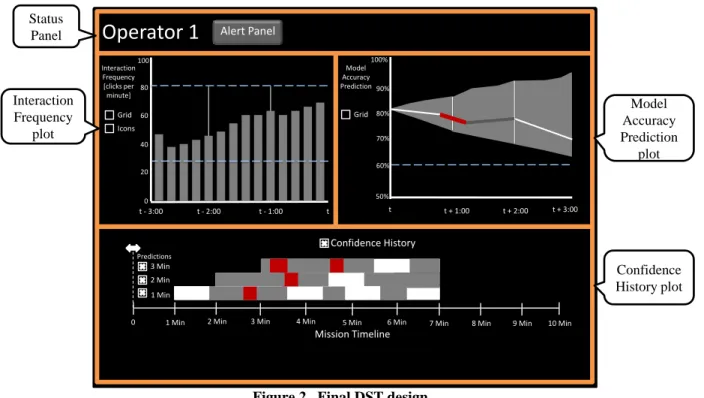
of highly autonomous unmanned vehicles (UVs).12 This team size is consistent with literature defining small groups as consisting of 3-7 personnel.13 The final DST design is shown in Fig 2. See Ref. 12 for a detailed walkthrough of the CTA and design process.
t t - 1:00 t - 2:00 t - 3:00 0 20 40 60 80 100 t + 1:00 60% 50% 80% 90% 100% 70% t t + 2:00 t + 3:00 Alert Panel 1 Min 2 Min 3 Min
1 Min 2 Min 3 Min 4 Min 5 Min 6 Min 7 Min 8 Min 9 Min 10 Min 0 Predictions Mission Timeline
Operator 1
Interaction Frequency [clicks per minute] Model Accuracy Prediction Grid Icons Confidence History Grid Model Accuracy Prediction plot Status Panel Interaction Frequency plot Confidence History plotFigure 2. Final DST design
As annotated in Fig. 2, the DST consists of four different components: the status panel, interaction frequency plot, model accuracy prediction plot, and confidence history plot. The status panel provides the supervisor with the operator name, access to an alert panel, alerts, and provides a control interface for supervisor interaction. The interaction frequency plot shows historical data for operator clicks per minute in order to give the supervisor an unprocessed way to infer operator workload.14
The model accuracy prediction plot is the portion of the display that most utilizes the HSMM-based operator model. The HSMM-based model generates transition probabilities between different system states for each instance in time and utilizes those likelihoods, combined with the observed operator actions, to predict the future accuracy of the model as well as to predict the likelihood of future operator behavior being “normal.” The HSMM-based model also provides the most likely inference regarding which operator behavior was deemed to be anomalous by identifying the discrepancies between the expected state transitions and the observed operator actions. This provides the team supervisor with information about how “normal” the operator behavior is predicted to be as well as the predicted cause of any alerts that arise from “abnormal” behavior.
Lastly, the DST includes a confidence history plot, where the historical model accuracy predictions are compared to the observed model accuracy for each point in time for the entire mission. This allows the supervisor to quickly and confidently identify how accurate the model has been at making predictions over the course of the entire mission, influencing the decision of whether to trust the model’s predictions and actually intervene when there is an alert, or to ignore it.
B. Experimental Evaluation
After the completion of the design process, a human subject experiment was designed to test the effectiveness of the resulting DST. Specifically, the experiment was designed to determine whether team supervisors with an HSMM-based DST perform better than supervisors without the DST in terms of correctly identifying current and future problems, solving current problems efficiently and accurately, correctly preventing future problems from occurring, and limiting non-necessary interventions. The experiment involved a supervisor whose job it was to monitor three simulated operators. The operators and all of the operator interactions with the UVs and targets were simulated. This was done to ensure consistency of results and control the variability in the data. Thus, the only actual humans in this experiment were team supervisors.
4
Operator 3
Operator 2
Operator 1
Secondary
Task
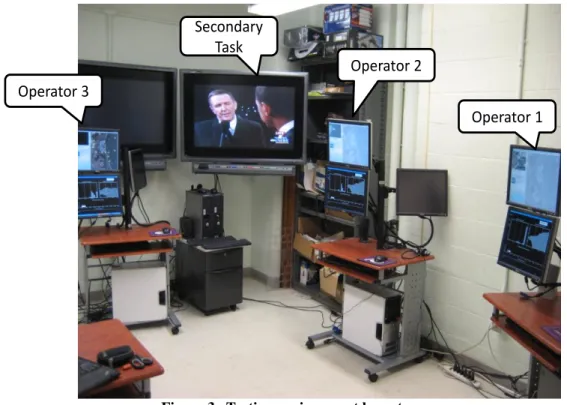
Figure 3. Testing environment layout
Each simulated operator had an independent area of responsibility over which he/she directed UVs to monitor pre-set and emergent targets, while avoiding dynamic threat areas. The team supervisor oversaw the mission which, for the purposes of this experiment, was assumed to occur from a remote location. This simulated a supervisor in a command and control center possibly thousands of miles away from the operators, such as the current way that several US Air Force personnel oversee UAVs in Iraq and Afghanistan from control stations in Nevada. In this setting, the supervisor was able to view all three operator interfaces remotely and made decisions of when to intervene in the different scenarios presented to him/her.
Participants were recruited via email and word of mouth. Of 30 total participants, 21 were male and 9 were female with an average age of 19.73 years, and a standard deviation of 2.18 years. Of the 30 participants, 29 were MIT students (27 undergraduate, 2 graduate) and one participant was an independent consultant.
The experimental environment consisted of three different displays: three operator interfaces, three team supervisor interfaces, and the secondary task display. Each operator interface and team supervisor interface were displayed on 17-inch Dell TFT LCD monitors connected to a Dell Dimension tower containing a Pentium D 2.80GHz CPU and 2.00 GB ram. The secondary task was shown on a 42-inch (1024x768 pixels) wall-mounted plasma screen. The overall testing environment layout will now be described, followed by the operator interface, team supervisor interface, and secondary task display.
The testing environment can be seen in Fig. 3. The three operator workstations were located so that it was easy for the experimenter to identify which operator the subject was focused on at any given moment. Each operator station was configured as seen in Fig. 3, with the operator interface displayed on the top monitor and the DST displayed on the bottom monitor. For the 15 subjects that were randomly selected to conduct the experiment without the DST, the bottom monitor was turned off.
1. Operator Interface: RESCHU
The Research Environment for Supervisory Control of Heterogeneous Unmanned Vehicles (RESCHU) was chosen as the operator interface because of its functionality of allowing a single operator to control multiple, heterogeneous UVs in simulated intelligence, surveillance, and reconnaissance tasks.15 In RESCHU (Fig. 4), it is the goal of each operator to visit as many targets as possible in order to correctly complete visual search tasks.
5
As annotated in Fig. 4, RESCHU consists of five different components: a large map view, payload camera view, message pane, UV health and status view, and a timeline. The map view shows the locations of threat areas (yellow circles), UVs (blue bullet icons), unknown targets (gray diamonds), targets that need to be searched (red diamonds), as well as the current paths of the UVs (blue lines). The message pane logs system messages, such as when UVs arrive at targets or what the operator needs to search for in the payload camera view, for quick reference by the operator.
The payload camera view is engaged when a UV arrives at a target area that needs to be searched. This view simulates the operator searching for an object, such as a white car, in the target area. At the completion of the visual search task, the target disappears and the operator may once again guide the UVs to remaining targets. The UV health and status view provides information such as how much damage the UV has taken and whether or not the UV is waiting for an input from the operator. The timeline shows the estimated time it will take each UV to arrive at its next target.
For this experiment, the operators were simulated by having a subject matter expert play through RESCHU according to a script that dictated the behavior needed for each operator in each scenario.
2. Team Supervisor Interface: HSMM-based Operator State Decision Support Tool
A few changes were made to the DST design in order to provide greater experimental control by reducing the number of uncontrolled variables and degrees of interaction freedom. A test bed DST screenshot is shown in Fig. 5. Changes were minor, such as not allowing the grid to be toggled on/off for the interaction frequency and model accuracy prediction plots, not allowing the supervisor to control the portion of the model performance history that he/she viewed, not having alert threshold lines present on the interaction frequency plot, and not having an alert panel for the subjects to set customizable thresholds. These changes did not impact the ability to take the measures needed for the experiment.
Payload
Camera
View
Message
Pane
UV
Health
and
Status
Timeline
Map
View
Figure 4. Annotated screenshot of the operator display – Research Environment for Supervisory Control
6
3. Secondary Task Display
In order to determine if the DST had an effect on mental workload, a secondary task was used to measure each supervisor’s spare mental capacity.16 The large wall screen display, shown in Fig. 3, was used to play a different video clip during each scenario. The subjects were instructed to listen for a certain target utterance, such as “health care” or “debt”, and report to the examiner the number of occurrences of that utterance at the end of the scenario. The number of missed occurrences of the target utterance was used as an indication of the supervisor’s spare mental capacity and thus a higher level of missed occurrences was seen as indicative of a higher level of mental workload.
C. Experimental Design
The experiment was a 2x2x2 mixed design with the following three factors: Operator Situation (true positive and false positive), Number of Operators Causing an Alert (single and multiple), Assistance Type (with DST or without DST). The experimental design repeated on the Operator Situation and Number of Operators Causing an Alert independent variables, while the Assistance Type is a between subjects factor.
The Operator Situation refers to the behavior that causes the DST alert. All alerts are theoretically caused by anomalous behavior. However, true positive alerts are caused by detrimental anomalous behavior and require intervention. False positive alerts are caused by benign anomalous behavior, and thus while the HSMM model may predict an anomaly that triggers an alert, due to unforeseen environmental factors, no true alert condition exists. In this case, the supervisor should reset or ignore the alarm.
The Number of Operators Causing an Alert corresponds to the number simultaneous alerts that the supervisor receives (one or multiple). In the multiple alert scenarios, one alert is caused by true positive behavior, while the other alert is caused by false positive or true positive behavior based on the Operator Situation factor level.
The Assistance Type factor was the primary independent variable of interest, so the two levels of assistance type are with and without the DST.
Several dependent variables were measured, including Decision Accuracy which is a binary yes/no value of whether the subject correctly identified the need to intervene or not intervene for each operator situation that caused an alert. Non-Necessary Interventions were recorded if a subject chose to intervene in a situation when the simulated operator was acting normally and an intervention was not necessary. Lastly, the Secondary Task Ratio measured the difference between the reported total number of occurrences of the target utterance in the secondary task video and the actual total number of occurrences of the target utterance in the video, normalized by the actual total number of occurrences.
7
D. Procedure
After being welcomed and thanked for participating in the experiment, each subject read and signed a consent form and filled out a demographic survey. The experimental task was then explained in detail through a self-paced presentation of the applicable training slides. Each subject completed two practice trials.
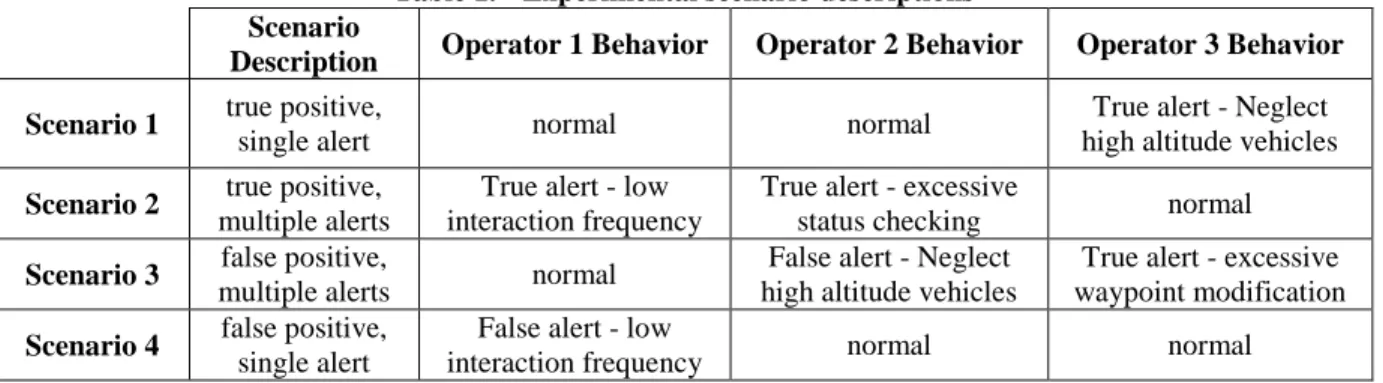
Table 1. Experimental scenario descriptions Scenario
Description Operator 1 Behavior Operator 2 Behavior Operator 3 Behavior
Scenario 1 true positive,
single alert normal normal
True alert - Neglect high altitude vehicles
Scenario 2 true positive,
multiple alerts
True alert - low interaction frequency
True alert - excessive
status checking normal
Scenario 3 false positive,
multiple alerts normal
False alert - Neglect high altitude vehicles
True alert - excessive waypoint modification
Scenario 4 false positive,
single alert
False alert - low
interaction frequency normal normal
Each subject experienced the four experimental trials shown in Table 1. These trials lasted approximately five minutes each and were presented in a counterbalanced order. After each trial, the experimenter conducted a verbal retrospective protocol during which the subjects explained their thought processes throughout the scenario. The experimenter also asked questions in an open-ended interview format in order to gain more insight such as what portions of the displays most helped the subject in making intervention decisions. After the experimental trials were completed, DST subjects filled out the post-experiment questionnaire. All subjects were then paid a nominal fee and thanked for their participation. In order to encourage subjects to perform their best, they were instructed before the experiment began that the top performer would receive a $200 gift card.
IV. Preliminary Results
The Decision Accuracy, Non-Necessary Interventions, and Secondary Task Ratio dependent variables were analyzed using non-parametric tests because the parametric assumptions of normality and/or homogeneity of variance were not met. An α value of 0.10 was used for all statistical tests.
A. Decision Accuracy
Decision Accuracy was analyzed by comparing the correct response to each alert with the decision each subject made. The number of correct decisions for DST users was then compared with the number of correct decisions for non-DST users with Mann-Whitney U tests (Table 2).
Table 2. Decision Accuracy results (* denotes statistically significant differences between with and without DST)
With DST Without DST Correct Decision Incorrect Decision Correct Decision Incorrect Decision All Scenarios 83% 17% 80% 20%
Single Alert Scenarios (1 and 4)* 100% 0% 70% 30%
Multiple Alert Scenarios (2 and 3) 75% 25% 85% 15%
When analyzing all four scenarios together, there was no significant difference in Decision Accuracy between non-DST users and DST users (U = 1702.5, n1 = n2 = 60, p = .558). Scenarios were then grouped by the number of
alerts, single (Scenarios 1 and 4) or multiple (Scenarios 2 and 3). This was done because Ref. 17 showed that subjects responding to multiple simultaneous alerts tend to restrict or completely ignore new information as they focus on serial processing of the initial information. We hypothesized that this action would result in different results for the dependent variables in this experiment.17
In single alert scenarios only, non-DST users made the correct decision 70% of the time (21 of 30), as compared to DST users who made the correct decision 100% of the time (30 of 30). A Mann-Whitney U test proved that this
8
was a statistically significant result (U = 315.0, n1 = n2 = 30, p = .001). In multiple alert scenarios, there was not a
statistically significant difference between non-DST users and DST users (U = 418.5, n1 = n2 = 30, p = .585).
So, while the DST was not shown to have an effect on Decision Accuracy for subjects that responded to two simultaneous alerts (Scenarios 2 and 3), the DST did have a positive effect on Decision Accuracy for subjects that responded to one alert at a time (Scenarios 1 and 4).
B. Non-Necessary Interventions
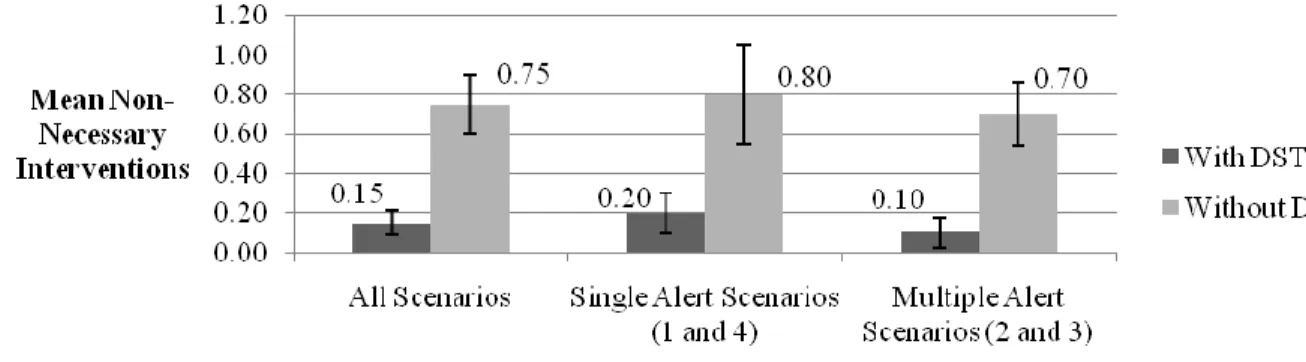
The mean number of Non-Necessary Interventions made by subjects with respect to the scenario type and whether they used the DST are shown in Fig 6. Non-DST users made significantly more Non-Necessary Interventions than DST users (U = 1174.5, n1 = n2 = 60, p < .001). This result was consistent for single alert
scenarios (U = 317.0, n1 = n2 = 30, p = .013) and multiple alert scenarios (U = 270.5, n1 = n2 = 30, p = .001).
Figure 6. Mean Non-Necessary Interventions per subject
C. Secondary Task Ratio
The Secondary Task Ratio results for DST and non-DST users are shown in Fig. 7. There was not a significant difference between non-DST users and DST users (U = 1791.0, n1 = n2 = 60, p = .962), which indicates that the DST
did not have a significant impact on secondary task workload. Thus, the DST did not add any appreciable mental workload to the supervisor’s task.
Figure 7. Mean Secondary Task Ratio
V. Discussion
A. Decision Accuracy
The DST gave subjects a possible cause of each alert, such as “low interaction frequency,” and thus gave DST users an indication of what type of information to analyze when making the decision of whether to intervene. This focused the attention of DST users to the likely cause of the alert, regardless of whether the alert required action or not, as opposed to the non-DST users that had to continuously search through all available information to determine if a situation required intervention. For DST users, having their attention focused on the mostly likely cause of the
9
alert may have been the reason for improved Decision Accuracy in the single alert scenarios, both the true positive and false positive variants.
While the DST was not shown to have a significant impact on Decision Accuracy for multiple alert scenarios, this result is possibly due to the simultaneous nature of the alerts. The DST users may have felt that they needed to rush their first response in order to quickly work on the second alert and thus sacrificed accuracy for time. Non-DST users did not have this same dynamic as there were no alerts, and thus the first operator that seemed to be acting abnormally could be fully dealt with without knowing that another operator was waiting to be addressed. The non-DST users dealt with one serial process at a time while the non-DST users dealt with the parallel recognition of two simultaneous alerts. This difference between parallel and serial recognition of alerts may have influenced why the DST did not impact Decision Accuracy in the multiple alert scenarios, because humans can only solve one complex problem at a time.15, 18-19 Therefore, the DST users’ focused attention advantage from the single alert scenarios may have been counteracted by the negative influence of having to knowingly simultaneously react to two alerts. A future study should evaluate multiple alert scenarios that have different spacing between alerts in order to determine if the DST has an impact in non-simultaneous multiple alert scenarios.
B. Non-Necessary Interventions
When analyzing the effect of the DST on the number of Non-Necessary Interventions, it is important to note that the DST notified the subjects of abnormal operator behavior, while non-DST users had no such help. Despite the training scenarios that attempted to help non-DST users identify abnormal behavior without the aid of the DST, and thus understand what behaviors required intervention, the non-DST users may not have fully understood this. This lack of understanding of operator actions, combined with the absence of alerts, may have been the reason non-DST users had more Non-Necessary Interventions. These same results may not be found with subjects who have experience with the underlying operator control system, RESCHU in the case of this experiment, and this factor should be evaluated in future work.
Many of the DST users reported that they assumed operator behavior was normal if they were not alerted to a situation and trusted they would be alerted when abnormal behavior was occurring. This automation bias20 may result in supervisors missing the abnormal behaviors that are not flagged by the system, and should be studied in future work.
C. Secondary Task Ratio
The DST was not shown to have a significant impact on mental workload as measured by the secondary task. Since the addition of the DST to the RESCHU interface doubled the number of screens the team supervisor needed to monitor from three to six, the DST would have theoretically increased mental workload if it were poorly designed. Thus, increased Decision Accuracy and decreased Non-Necessary Interventions for DST users in single alert scenarios did not come at the cost of increased mental workload as shown by the non-statistically significant results for the Secondary Task Ratio.
VI. Conclusion
As the military and civilian sectors continue to invest in UVs, the scenario of a team supervisor coordinating the efforts of multiple, independent operators each controlling multiple heterogeneous UVs is likely.1-3 Developing decision support tools in order aid the team supervisor in making time critical decisions that have possible catastrophic consequences is essential.6-7, 21 The DST proposed in this research has demonstrated that utilizing HSMM-based operator modeling to alert a team supervisor to current and predicted future operator abnormal behavior leads to increased team supervisor performance in terms of increased Decision Accuracy in single alert scenarios and decreased Non-Necessary Interventions in both single and multiple alert scenarios. Importantly, there was no evidence of additional mental workload with the added display. However, there was some evidence of automation bias, in that DST users may have relied exclusively on the alerting mechanisms. However, future work is needed before the DST can move into real world production.
Future work should focus on the effect that the DST has on supervisor performance if multiple alert scenarios have spacing between the alerts as opposed to both alerts occurring simultaneously. Additionally, future work may focus on whether the presence of the DST is more valuable when the number of operators in the team is increased, how far in the future the HSMM-based operator model predictions are beneficial, and if the same performance impact would be seen if the team supervisor was taken out of the scenario and the operators were allowed to see their own DST throughout the mission.
10
Acknowledgments
This research was supported by Boeing Phantom Works.References
1
DoD, Unmanned Systems Roadmap (2007-2032), (Washington D.C. 2007).
2
M. L. Cummings, S. Bruni, S. Mercier and P. J. Mitchell, "Automation Architecture for Single Operator Multiple UAV Command and Control" (2007) Vol. 1 The International Command and Control Journal pp. 1-24.
3
DoD, United States Air Force Unmanned Aircraft Systems Flight Plan, (Washington D.C. 2009), pp. 1-82.
4P. J. Mitchell, M. L. Cummings and T. B. Sheridan, Human Supervisory Control Issues in Network Centric Warfare,
((HAL2004-01). Cambridge, MA 2004), pp. 1-30.
5S. D. Scott, A. E. Rico, C. Y. Furusho and M. L. Cummings, Aiding Team Supervision in Command and Control Operations
with Large-Screen Displays, Human Systems Integration Symposium, (Annapolis, MD, USA 2007).
6
J. R. Hackman, Leading Teams: Setting the Stage for Great Performances, (Boston, MA 2002), p. 312.
7
J. M. Burns, Leadership, (New York 1978).
8S. D. Scott, F. Sasangohar and M. L. Cummings, Investigating Supervisory-Level Activity Awareness Displays for
Command and Control Operations, Human Systems Integration Symposium, (Annapolis, MD 2009).
9
R. W. Castonia, The Design of a HSMM-based Operator State Monitoring Display, Department of Aeronautics and Astronautics, M.S., (Cambridge, MA 2010).
10
H. Huang, Developing an Abstraction Layer for the Visualization of HSMM-Based Predictive Decision Support, Department of Electrical Engineering and Computer Science, M. Eng., (Cambridge, MA 2009).
11
A. Tversky and D. Kahneman, Judgment under Uncertainty: Heuristics and Biases, Science, vol. 185, (1974), pp. 1124-1131.
12
R. W. Castonia, The Design of a HSMM-based Operator State Monitoring Display, ((HAL2009-04). Cambridge, MA 2009).
13
J. M. Levine and R. L. Moreland, Small Groups, In D. T. Gilbert, S. T. Fiske and L. Gardner (eds.), The Handbook of Social Psychology, vol. 2, (Boston 1998), pp. 415-469.
14
A. J. Maule and G. R. J. Hockey, State, Stress, and Time Pressure, In Time Pressure and Stress in Human Judgement and Decicion Making, (New York 1993).
15
C. E. Nehme, Modeling Human Supervisory Control in Heterogeneous Unmanned Vehicle Systems, Department of Aeronautics and Astronautics, Ph. D, (Cambridge, MA 2009).
16
C. D. Wickens and J. G. Hollands, Engineering Psychology and Human Performance, 3rd ed., (Upper Saddle River, N.J. 2000).
17
H. Debar and A. Wespi, Aggregation and Correlation of Intrusion-Detection Alerts, In Recent Advances in Intrusion Detection, (Berlin, Germany 2001), pp. 85-103.
18
D. E. Broadbent, Perception and Communication, (Oxford 1958).
19
A. T. Welford, "The Psychological Refractory Period and the Timing of High-Speed Performance - A Review and a Theory" (1952) Vol. 43 British Journal of Psychology pp. 2-19.
20
M. L. Cummings, Automation Bias in Intelligent Time Critical Decision Support Systems, AIAA 3rd Intelligent Systems Conference, (Chicago 2004).
21