arXiv:1308.6690v2 [hep-ex] 3 Sep 2013
Measurement of the asymmetry in angular distributions of leptons produced in
dilepton t¯
t
final states in p ¯
p
collisions at
√
s
= 1.96
TeV
V.M. Abazov,31B. Abbott,66 B.S. Acharya,25 M. Adams,45 T. Adams,43 J.P. Agnew,40 G.D. Alexeev,31 G. Alkhazov,35A. Altona,55A. Askew,43S. Atkins,53 K. Augsten,7C. Avila,5F. Badaud,10L. Bagby,44B. Baldin,44
D.V. Bandurin,43S. Banerjee,25 E. Barberis,54 P. Baringer,52 J.F. Bartlett,44 U. Bassler,15V. Bazterra,45 A. Bean,52 M. Begalli,2L. Bellantoni,44S.B. Beri,23 G. Bernardi,14 R. Bernhard,19I. Bertram,38 M. Besan¸con,15 R. Beuselinck,39P.C. Bhat,44S. Bhatia,57V. Bhatnagar,23G. Blazey,46S. Blessing,43 K. Bloom,58 A. Boehnlein,44 D. Boline,63 E.E. Boos,33G. Borissov,38 A. Brandt,69O. Brandt,20 R. Brock,56A. Bross,44D. Brown,14X.B. Bu,44 M. Buehler,44 V. Buescher,21 V. Bunichev,33S. Burdinb,38C.P. Buszello,37E. Camacho-P´erez,28 B.C.K. Casey,44 H. Castilla-Valdez,28S. Caughron,56 S. Chakrabarti,63K.M. Chan,50 A. Chandra,71 A. Chapelain,15 E. Chapon,15
G. Chen,52 S.W. Cho,27 S. Choi,27 B. Choudhary,24 S. Cihangir,44 D. Claes,58J. Clutter,52 M. Cooke,44 W.E. Cooper,44 M. Corcoran,71 F. Couderc,15 M.-C. Cousinou,12 D. Cutts,68 A. Das,41 G. Davies,39 S.J. de Jong,29, 30 E. De La Cruz-Burelo,28F. D´eliot,15 R. Demina,62 D. Denisov,44 S.P. Denisov,34 S. Desai,44
C. Deterrec,20 K. DeVaughan,58 H.T. Diehl,44 M. Diesburg,44 P.F. Ding,40 A. Dominguez,58 A. Dubey,24 L.V. Dudko,33 A. Duperrin,12 S. Dutt,23 M. Eads,46 D. Edmunds,56J. Ellison,42 V.D. Elvira,44 Y. Enari,14 H. Evans,48V.N. Evdokimov,34A. Falkowskik,15 L. Feng,46 T. Ferbel,62F. Fiedler,21F. Filthaut,29, 30 W. Fisher,56
H.E. Fisk,44 M. Fortner,46H. Fox,38 S. Fuess,44 P.H. Garbincius,44 A. Garcia-Bellido,62J.A. Garc´ıa-Gonz´alez,28 V. Gavrilov,32W. Geng,12, 56 C.E. Gerber,45Y. Gershtein,59 G. Ginther,44, 62 G. Golovanov,31 P.D. Grannis,63
S. Greder,16 H. Greenlee,44 G. Grenier,17Ph. Gris,10 J.-F. Grivaz,13 A. Grohsjeanc,15 S. Gr¨unendahl,44 M.W. Gr¨unewald,26 T. Guillemin,13 G. Gutierrez,44 P. Gutierrez,66 J. Haley,66 L. Han,4K. Harder,40A. Harel,62
J.M. Hauptman,51 J. Hays,39 T. Head,40 T. Hebbeker,18 D. Hedin,46H. Hegab,67 A.P. Heinson,42 U. Heintz,68 C. Hensel,20 I. Heredia-De La Cruzd,28 K. Herner,44 G. Heskethf,40 M.D. Hildreth,50 R. Hirosky,72T. Hoang,43
J.D. Hobbs,63 B. Hoeneisen,9 J. Hogan,71 M. Hohlfeld,21 J.L. Holzbauer,57I. Howley,69 Z. Hubacek,7, 15 V. Hynek,7 I. Iashvili,61 Y. Ilchenko,70 R. Illingworth,44A.S. Ito,44 S. Jabeen,68 M. Jaffr´e,13 A. Jayasinghe,66
M.S. Jeong,27R. Jesik,39 P. Jiang,4K. Johns,41 E. Johnson,56 M. Johnson,44 A. Jonckheere,44 P. Jonsson,39 J. Joshi,42 A.W. Jung,44 A. Juste,36 E. Kajfasz,12D. Karmanov,33I. Katsanos,58 R. Kehoe,70S. Kermiche,12 N. Khalatyan,44A. Khanov,67 A. Kharchilava,61 Y.N. Kharzheev,31 I. Kiselevich,32 J.M. Kohli,23A.V. Kozelov,34
J. Kraus,57A. Kumar,61 A. Kupco,8 T. Kurˇca,17 V.A. Kuzmin,33 S. Lammers,48P. Lebrun,17 H.S. Lee,27 S.W. Lee,51 W.M. Lee,44 X. Lei,41 J. Lellouch,14D. Li,14 H. Li,72L. Li,42 Q.Z. Li,44J.K. Lim,27 D. Lincoln,44 J. Linnemann,56V.V. Lipaev,34 R. Lipton,44 H. Liu,70 Y. Liu,4A. Lobodenko,35M. Lokajicek,8 R. Lopes de Sa,63 R. Luna-Garciag,28 A.L. Lyon,44A.K.A. Maciel,1 R. Madar,19R. Maga˜na-Villalba,28S. Malik,58 V.L. Malyshev,31
J. Mansour,20 J. Mart´ınez-Ortega,28R. McCarthy,63 C.L. McGivern,40 M.M. Meijer,29, 30 A. Melnitchouk,44 D. Menezes,46 P.G. Mercadante,3 M. Merkin,33 A. Meyer,18 J. Meyeri,20 F. Miconi,16 N.K. Mondal,25 M. Mulhearn,72 E. Nagy,12M. Narain,68R. Nayyar,41H.A. Neal,55 J.P. Negret,5 P. Neustroev,35H.T. Nguyen,72
T. Nunnemann,22 J. Orduna,71 N. Osman,12 J. Osta,50 A. Pal,69 N. Parashar,49 V. Parihar,68S.K. Park,27 R. Partridgee,68 N. Parua,48A. Patwaj,64 B. Penning,44M. Perfilov,33 Y. Peters,20 K. Petridis,40G. Petrillo,62
P. P´etroff,13 M.-A. Pleier,64 V.M. Podstavkov,44A.V. Popov,34 M. Prewitt,71 D. Price,40 N. Prokopenko,34 J. Qian,55 A. Quadt,20 B. Quinn,57 P.N. Ratoff,38 I. Razumov,34 I. Ripp-Baudot,16 F. Rizatdinova,67 M. Rominsky,44 A. Ross,38 C. Royon,15 P. Rubinov,44 R. Ruchti,50 G. Sajot,11 A. S´anchez-Hern´andez,28 M.P. Sanders,22 A.S. Santosh,1 G. Savage,44 L. Sawyer,53 T. Scanlon,39R.D. Schamberger,63 Y. Scheglov,35 H. Schellman,47 C. Schwanenberger,40R. Schwienhorst,56 J. Sekaric,52 H. Severini,66E. Shabalina,20 V. Shary,15
S. Shaw,56A.A. Shchukin,34 V. Simak,7 P. Skubic,66 P. Slattery,62 D. Smirnov,50 G.R. Snow,58 J. Snow,65 S. Snyder,64 S. S¨oldner-Rembold,40L. Sonnenschein,18K. Soustruznik,6 J. Stark,11 D.A. Stoyanova,34M. Strauss,66
L. Suter,40 P. Svoisky,66 M. Titov,15 V.V. Tokmenin,31 Y.-T. Tsai,62D. Tsybychev,63B. Tuchming,15 C. Tully,60 L. Uvarov,35 S. Uvarov,35 S. Uzunyan,46 R. Van Kooten,48 W.M. van Leeuwen,29 N. Varelas,45 E.W. Varnes,41 I.A. Vasilyev,34A.Y. Verkheev,31 L.S. Vertogradov,31M. Verzocchi,44M. Vesterinen,40 D. Vilanova,15 P. Vokac,7
H.D. Wahl,43 M.H.L.S. Wang,44 J. Warchol,50 G. Watts,73 M. Wayne,50 J. Weichert,21 L. Welty-Rieger,47 M.R.J. Williams,48 G.W. Wilson,52 M. Wobisch,53 D.R. Wood,54 T.R. Wyatt,40 Y. Xie,44 R. Yamada,44 S. Yang,4 T. Yasuda,44 Y.A. Yatsunenko,31 W. Ye,63 Z. Ye,44 H. Yin,44 K. Yip,64 S.W. Youn,44 J.M. Yu,55
(The D0 Collaboration∗)
1LAFEX, Centro Brasileiro de Pesquisas F´ısicas, Rio de Janeiro, Brazil 2Universidade do Estado do Rio de Janeiro, Rio de Janeiro, Brazil
3Universidade Federal do ABC, Santo Andr´e, Brazil
4University of Science and Technology of China, Hefei, People’s Republic of China 5Universidad de los Andes, Bogot´a, Colombia
6Charles University, Faculty of Mathematics and Physics,
Center for Particle Physics, Prague, Czech Republic
7Czech Technical University in Prague, Prague, Czech Republic
8Institute of Physics, Academy of Sciences of the Czech Republic, Prague, Czech Republic 9Universidad San Francisco de Quito, Quito, Ecuador
10LPC, Universit´e Blaise Pascal, CNRS/IN2P3, Clermont, France 11LPSC, Universit´e Joseph Fourier Grenoble 1, CNRS/IN2P3,
Institut National Polytechnique de Grenoble, Grenoble, France
12CPPM, Aix-Marseille Universit´e, CNRS/IN2P3, Marseille, France 13LAL, Universit´e Paris-Sud, CNRS/IN2P3, Orsay, France 14LPNHE, Universit´es Paris VI and VII, CNRS/IN2P3, Paris, France
15CEA, Irfu, SPP, Saclay, France
16IPHC, Universit´e de Strasbourg, CNRS/IN2P3, Strasbourg, France
17IPNL, Universit´e Lyon 1, CNRS/IN2P3, Villeurbanne, France and Universit´e de Lyon, Lyon, France 18III. Physikalisches Institut A, RWTH Aachen University, Aachen, Germany
19Physikalisches Institut, Universit¨at Freiburg, Freiburg, Germany
20II. Physikalisches Institut, Georg-August-Universit¨at G¨ottingen, G¨ottingen, Germany 21Institut f¨ur Physik, Universit¨at Mainz, Mainz, Germany
22Ludwig-Maximilians-Universit¨at M¨unchen, M¨unchen, Germany 23Panjab University, Chandigarh, India
24Delhi University, Delhi, India
25Tata Institute of Fundamental Research, Mumbai, India 26University College Dublin, Dublin, Ireland
27Korea Detector Laboratory, Korea University, Seoul, Korea 28CINVESTAV, Mexico City, Mexico
29Nikhef, Science Park, Amsterdam, the Netherlands 30Radboud University Nijmegen, Nijmegen, the Netherlands
31Joint Institute for Nuclear Research, Dubna, Russia 32Institute for Theoretical and Experimental Physics, Moscow, Russia
33Moscow State University, Moscow, Russia 34Institute for High Energy Physics, Protvino, Russia 35Petersburg Nuclear Physics Institute, St. Petersburg, Russia
36Instituci´o Catalana de Recerca i Estudis Avan¸cats (ICREA) and Institut de F´ısica d’Altes Energies (IFAE), Barcelona, Spain 37Uppsala University, Uppsala, Sweden
38Lancaster University, Lancaster LA1 4YB, United Kingdom 39Imperial College London, London SW7 2AZ, United Kingdom 40The University of Manchester, Manchester M13 9PL, United Kingdom
41University of Arizona, Tucson, Arizona 85721, USA 42University of California Riverside, Riverside, California 92521, USA
43Florida State University, Tallahassee, Florida 32306, USA 44Fermi National Accelerator Laboratory, Batavia, Illinois 60510, USA
45University of Illinois at Chicago, Chicago, Illinois 60607, USA 46Northern Illinois University, DeKalb, Illinois 60115, USA
47Northwestern University, Evanston, Illinois 60208, USA 48Indiana University, Bloomington, Indiana 47405, USA 49Purdue University Calumet, Hammond, Indiana 46323, USA 50University of Notre Dame, Notre Dame, Indiana 46556, USA
51Iowa State University, Ames, Iowa 50011, USA 52University of Kansas, Lawrence, Kansas 66045, USA 53Louisiana Tech University, Ruston, Louisiana 71272, USA 54Northeastern University, Boston, Massachusetts 02115, USA
55University of Michigan, Ann Arbor, Michigan 48109, USA 56Michigan State University, East Lansing, Michigan 48824, USA
57University of Mississippi, University, Mississippi 38677, USA 58University of Nebraska, Lincoln, Nebraska 68588, USA 59Rutgers University, Piscataway, New Jersey 08855, USA 60Princeton University, Princeton, New Jersey 08544, USA
61State University of New York, Buffalo, New York 14260, USA 62University of Rochester, Rochester, New York 14627, USA 63State University of New York, Stony Brook, New York 11794, USA
64Brookhaven National Laboratory, Upton, New York 11973, USA 65Langston University, Langston, Oklahoma 73050, USA 66University of Oklahoma, Norman, Oklahoma 73019, USA 67Oklahoma State University, Stillwater, Oklahoma 74078, USA
68Brown University, Providence, Rhode Island 02912, USA 69University of Texas, Arlington, Texas 76019, USA 70Southern Methodist University, Dallas, Texas 75275, USA
71Rice University, Houston, Texas 77005, USA 72University of Virginia, Charlottesville, Virginia 22904, USA
73University of Washington, Seattle, Washington 98195, USA
(Dated: August 30, 2013)
We present measurements of asymmetries in angular distributions of leptons produced in t¯tevents in proton-antiproton collisions at the Fermilab Tevatron Collider. We consider final states where the W±
bosons from top quark and antiquark decays both decay into ℓν (ℓ = e, µ) resulting in oppo-sitely charged dilepton final states with accompanying jets. Using 9.7 fb−1 of integrated luminosity
collected with the D0 detector, we find the asymmetries in lepton pseudorapidity compatible with predictions based on the standard model.
PACS numbers: 14.65.Ha, 12.38.Qk, 13.85.Qk, 11.30.Er
The top quark, first observed by the CDF and D0 Col-laborations in 1995 [1, 2], is the heaviest of all elemen-tary particles. Because of the large top-quark mass, the measurement of the production and decay properties of top quark pairs in proton-antiproton (p¯p) collisions pro-vides an important test of the standard model of particle physics (SM) that may unveil the presence of new phe-nomena beyond the SM (BSM).
Perturbative quantum chromodynamics (pQCD) at leading order (LO) predicts that top quark-antiquark (t¯t) production in quark-antiquark (q ¯q) annihilation in the center of mass frame is forward-backward (FB) symmet-ric in the angular distributions of the t and ¯t quarks. However, a positive FB asymmetry appears from next-to-leading order (NLO) contributions [3–6], such that the top (antitop) quark is preferentially emitted in the di-rection of the incoming quark (antiquark). Processes beyond the SM can modify the t¯t production asymme-try, for example through contributions from axigluons or diquarks [7–19], Z′/W′ bosons [20–25], supersymme-try [26–28], or new scalar particles [29, 30]. The CDF and D0 Collaborations have performed measurements of the t¯t FB asymmetry in t¯t decaying to ℓ+jets final states containing jets, and an imbalance in transverse energy
∗
with visitors from aAugustana College, Sioux Falls, SD, USA, bThe University of Liverpool, Liverpool, UK,cDESY, Hamburg,
Germany, dUniversidad Michoacana de San Nicolas de Hidalgo,
Morelia, MexicoeSLAC, Menlo Park, CA, USA,fUniversity
Col-lege London, London, UK, gCentro de Investigacion en
Com-putacion - IPN, Mexico City, Mexico, hUniversidade Estadual
Paulista, S˜ao Paulo, Brazil, iKarlsruher Institut f¨ur Technologie
(KIT) - Steinbuch Centre for Computing (SCC), jOffice of
Sci-ence, U.S. Department of Energy, Washington, D.C. 20585, USA andkLaboratoire de Physique Theorique, Orsay, FR.
(6ET), and just one lepton (ℓ =e or µ) from W decay where the W is coming from t or ¯t, based on data corre-sponding to integrated luminosities of 9.4 fb−1 [31] and 5.4 fb−1 [32], respectively. The FB asymmetry reported by the CDF and D0 Collaborations both differ by more than two standard deviations (SD) from the NLO pQCD predictions [31, 32].
Rather than measuring the FB asymmetry of the top quarks themselves, an asymmetry in t¯t events can also be measured from the pseudorapidity [33] of the sin-gle charged lepton in the ℓ+jets final state. In such a measurement, based on an integrated luminosity of 9.4 fb−1 and 5.4 fb−1, CDF and D0 found deviations from NLO pQCD predictions of about three SD [32] and of 1.7 SD [34], respectively. The D0 Collaboration also re-ported a similar measurement in dilepton final states [35], where the W bosons from t and ¯t decays both decay into ℓν (ℓ =e or µ), in data corresponding to an integrated lu-minosity of 5.4 fb−1. The asymmetry results reported in Ref. [35] combined with the measurement in the ℓ+jets final state, reduce the disagreement with the NLO pQCD predictions to 2.2 SD [35].
The results of the ATLAS and CMS Collaborations based on the difference of top and antitop quark produc-tion angles in the ℓ+jets final states show good agreement with NLO pQCD expectations in proton-proton collisions at √s = 7 TeV [36, 37]. However, at the LHC, mea-sured asymmetries in top quark angular distributions are not directly comparable with the values extracted at the Tevatron, because of the symmetry of the initial proton-proton state at the LHC. This symmetry at the LHC leads to a weaker sensitivity to the physics process re-sponsible for the production asymmetry compared to the Tevatron.
In this article, we report a new measurement of the asymmetry in the pseudorapidity distributions of leptons
produced in t¯t events in the dilepton channel, based on all the data collected by the D0 Collaboration in Run II of the Tevatron, and we compare our results with the most recent predictions based on the standard model [38]. cor-responding to an integrated luminosity of 9.7 fb−1 follow-ing relevant data quality selection.
We use the two observables q × η and ∆η, where q and η are the charge and pseudorapidity of the lepton, and ∆η = ηℓ+− ηℓ− is the difference in lepton pseudo-rapidities. The single-lepton asymmetry Aℓ
FB is defined as
Aℓ
FB= N (q × η > 0) − N(q × η < 0)
N (q × η > 0) + N(q × η < 0), (1) where N corresponds to the number of leptons satisfying a given set of selection criteria. In this asymmetry, each event contributes twice, once with positive and once with negative lepton charge. The dilepton asymmetry Aℓℓ is defined as
Aℓℓ= N (∆η > 0) − N(∆η < 0)
N (∆η > 0) + N (∆η < 0) . (2) The Aℓ
FB and Aℓℓ asymmetries are highly correlated as we discuss in Sec. VI.
I. THE D0 DETECTOR AND OBJECT IDENTIFICATION
The D0 detector [39–41] has a central tracking system consisting of a silicon microstrip tracker and a central fiber tracker, both located within a 2 T superconducting solenoidal magnet, with designs optimized for tracking and vertexing at detector pseudorapidities (relative to the center of the D0 detector) of |ηdet| < 3 and |ηdet| < 2.5, respectively. A liquid-argon sampling calorimeter has a central section (CC) covering pseudorapidities |ηdet| up to ≈ 1.1, and two end calorimeters (EC) that extend coverage to |ηdet| ≈ 4.2, with all three housed in separate cryostats [42]. An outer muon system, at |ηdet| < 2, consists of a layer of tracking detectors and scintillation trigger counters in front of 1.8 T toroids, followed by two similar layers after the toroids [43].
In the current analysis, we focus on t¯t dilepton final states that contain two isolated charged leptons (ee, eµ, or µµ), at least two candidate b-quark jets, and signifi-cant 6ET attributed to escaping neutrinos. Electrons are identified as energy clusters in the calorimeter within a cone of radius R =p(∆η)2+ (∆φ)2 = 0.2 (with φ the azimuthal angle), that are consistent in their longitudinal and transverse profiles with those expected of an electro-magnetic shower. More than 90% of the energy of an electron candidate must be deposited in the electromag-netic part of the calorimeter. Electrons are required to be isolated by demanding that les than 20% of its en-ergy deposited in an annulus of 0.2 < R < 0.4 around its direction. This cluster has to be matched to a track re-constructed in the central tracking system. We consider
electrons in the CC with |ηdet| < 1.1 and in the EC with 1.5 < |ηdet| < 2.5. Transverse momentum pT of elec-trons must be greater than 15 GeV. In addition, we use an electron multivariate discriminant based on tracking and calorimeter information, to reject jets misidentified as electrons. It has an 75%–80% efficiency to select real electrons, and a rejection ≈ 96% for misidentified jets.
A muon is identified [44] as a segment in at least one layer of the muon system that is matched to a track reconstructed in the central tracking system. Recon-structed muons must have pT > 15 GeV and satisfy two isolation criteria. First, the transverse energy de-posited in the calorimeter annulus around the muon 0.1 < R < 0.4 (ETµ,iso) has to be less than 15% of the transverse momentum of the muon (pµT). Second, the sum of the transverse momenta of the tracks in a cone of radius R = 0.5 around the muon track in the central tracking system (pµ,isoT ) has to be less than 15% of pµT.
Jets are identified as energy clusters in the electromag-netic and hadronic parts of the calorimeter reconstructed using an iterative mid-point cone algorithm with radius R = 0.5 [45] and |ηdet| < 2.5. A jet energy scale correc-tion is determined by calibrating the energy deposited in the jet cone using transverse momentum balance in photon+jet and dijet events. When a muon track over-laps the jet cone, the momentum of that muon is added to the jet pT, assuming that the muon originates from the semileptonic decay of a hadron belonging to the jet. Jets in simulated events are corrected for residual differ-ences in energy resolution and energy scale between data and simulation. These correction factors are measured by comparing data and simulation in Drell-Yan (Z/γ⋆→ ee) plus jets events.
We use a multivariate analysis (MVA) to identify jets originating from b quarks [46]. The algorithm combines into a single discriminant variable the information from the impact parameters of tracks and from variables that characterize the properties of secondary vertices within jets using a single discriminant. Jet candidates for b tag-ging are required to have at least two tracks with pT > 0.5 GeV originating from the vertex of the p¯p interaction and to be matched to a jet reconstructed from the tracks.
The 6ET is reconstructed from the energy deposited in the calorimeter cells, and corrections to pT for leptons and jets are propagated into the 6ET. A significance in 6ET [S(6ET)] is defined for each event through a likelihood discriminant constructed from the ratio of the 6ET to its uncertainty.
II. SIMULATED EVENTS
Monte Carlo (MC) events are processed through a geant-based [47] simulation of the D0 detector. To sim-ulate effects from additional overlapping p¯p interactions, “zero bias” events are selected randomly in collider data and overlaid on the fully simulated MC events. Residual differences between data and simulation of electron and
muon pT resolution and identification are corrected by comparing Z/γ⋆→ ℓℓ events in data and MC, applying tight requirements on one of the two leptons and using the other one to measure efficiencies and resolutions.
We use the NLO generator mc@nlo 3.4 [48, 49], inter-faced with herwig 6.510 [50] for parton showering and hadronization, to simulate t¯t events. The main sources of background in the dilepton channel correspond to q ¯q → Z/γ⋆→ ℓℓ, diboson production (WW, WZ, ZZ), and in-strumental background. The inin-strumental background arises mainly from multijet and (W → ℓν)+jets events in which one or two jets are misidentified as electrons or where muons or electrons originating from the semilep-tonic decay of a heavy-flavor hadron appear isolated. This background is evaluated using data, as described in Sec. III. Z/γ⋆events are generated with the tree-level LO matrix element generator alpgen v2.11 [51] interfaced with pythia 6.409 [52] (D0 modified tune A [53]) for parton showering and hadronization. Diboson events are generated with pythia. The mc@nlo generator uses the CTEQ6M1 set of parton distribution functions (PDFs), and all other simulated samples are generated using the CTEQ6L1 PDFs [54]. The Z/γ⋆samples are normalized to the next-to-next-to-leading-order cross section com-puted with the fewz program [55]. We separately simu-late Z/γ⋆ accompanied by heavy-flavor quarks (b¯b or c¯c) using alpgen, and enhance the corresponding LO cross sections by a factor estimated from the NLO values com-puted with the mcfm program [56]. The diboson samples are normalized to the NLO cross section calculated with mcfm.
In addition, we apply a correction to the Z/γ⋆+jets simulation, based on data [57], to address small discrep-ancy in the modeling of Z boson transverse momentumpZ T in the simulation.
In Z boson events the asymmetries defined in Eqs. (1) and (2) are not well-modeled in the simulation, es-pecially in the eµ channel for Z/γ⋆ → ττ → eνµν events. We therefore apply an additional correction us-ing pythia 8 [58], which correctly takes into account the tau lepton polarization and spin correlations for the tau decays. This reweighting is explained in detail in Sec. V. An interesting class of BSM models that can gener-ate a large t¯t forward-backward asymmetry at tree level arises from the presence of a color-octet vector particle Ga
µ(the so-called axigluon) with large mass mGand chi-ral couplings. To check the sensitivity of our measure-ments to such new phenomena, we generate two axigluon samples [59] and pass these events through the full D0 simulation and reconstruction programs. Model 1 has a right-handed coupling to the SM quarks of 0.8gs (where gs =pαs/4π is the QCD coupling) and no left-handed coupling. The axigluon mass is set to 0.2 TeV and the width to 50 GeV. Model 2 has a right-handed coupling to light SM quarks of −1.5gs, a coupling of 6gs to the top quark, and no left-handed coupling, with the ax-igluon mass and width set to 2 TeV and 670 GeV, re-spectively. Table I summarizes the values of the
asym-metry predicted by these two models. These models are in agreement with experimental constraints (t¯t resonance searches and dijet production) from the Tevatron and the LHC, but in slight tension with the t¯t production cross section measurements.
TABLE I: Asymmetries predicted by mc@nlo and by the two models of axigluons described in the text. Uncertainties reflect only the statistical MC contributions. All values are given in %.
Model 1 Model 2 mc@nlo Aℓℓ 21.3 ± 0.6 11.3 ± 0.5 3.3 ± 0.1 Aℓ
FB 14.9 ± 1.0 8.9 ± 0.8 2.4 ± 0.1
III. EVENT SELECTION AND ESTIMATION OF INSTRUMENTAL BACKGROUND We follow the approach developed in Ref. [60] for the event selection, i.e. using the criteria listed below:
(i) For the ee and µµ channels, we select events that pass at least one single-lepton trigger, while for the eµ channel, we consider events selected through a mixture of single and multilepton triggers and lep-ton+jet triggers. Efficiencies for single electron and muon triggers are measured using Z/γ⋆→ ee or Z/γ⋆ → µµ data, and found to be ≈ 99% and ≈ 80%, respectively, for dilepton signal events. For the eµ channel, the trigger efficiency is ≈ 100%. (ii) We require at least one p¯p interaction vertex in the
interaction region with |z| < 60 cm, where z is the coordinate along the beam axis, and z = 0 is the center of the detector. At least three tracks with pT > 0.5 GeV must be associated with this vertex. (iii) We require at least two isolated leptons with pT > 15 GeV, both originating from the same in-teraction vertex. We consider only muons within |ηdet| < 2.0 and electrons within |ηdet| < 1.1 or 1.5 < |ηdet| < 2.5. The two highest-pT leptons in an event must have opposite electric charges. (iv) To reduce the background from bremsstrahlung in
the eµ final state, we require the distance in (η, φ) space between the electron and the muon trajecto-ries to be R(e, µ) > 0.3.
(v) In the ee and µµ channels, we require at least two jets with pT > 20 GeV. For the eµ channel, we consider two types of events: (i) events with at least two jets (eµ 2-jets) and (ii) events that contain just one detected jet (eµ 1-jet).
(vi) The t¯t final state contains two b-quark jets. To im-prove separation between signal and background, we apply a selection on the value of the MVA dis-criminant that assigns the b-quark hypothesis to the
two jets of largest pT. We use different cutoffs of the MVA discriminant variable, corresponding to b-jet efficiencies of 84% in eµ 2-jets, 80% in ee, 78% in µµ, and 60% in eµ 1-jet events, with background misidentification efficiencies, respectively, of 23%, 12%, 7%, and 4%.
(vii) To improve signal purity, additional selection crite-ria are implemented based on global event proper-ties of the final state. In the eµ 1-jet events, we require HT > 85 GeV, where HT is the scalar sum of the transverse momenta of the leading lepton and the leading jet. In the eµ 2-jets events, we require HT > 108 GeV, where HT is the scalar sum of the transverse momenta of the leading lepton and the two leading jets. In the ee final state, we re-quire S(6ET)> 5, while in the µµ channel, we require 6ET> 40 GeV and S(6ET)> 2.5.
(viii) All leptons must have |η| < 2 and a difference in rapidity of |∆η| < 2.4. These criteria reduce the statistical uncertainty on the calculated parton-level asymmetries (see Sec. IV).
The cut-off values of the selection criteria in items (vi) and (vii) are determined by minimizing the statistical uncertainty on the background-subtracted asymmetries (defined in Sec. IV).
To estimate the t¯t signal efficiency and the background contamination, we use MC simulation for all contribu-tions except for the instrumental background, which is estimated from data.
In the ee and eµ channels, we determine the contri-butions from events with jets misidentified as electrons using the “matrix method” [61]. The loose sample of events (nloose) is defined following the same selection as used for the t¯t candidate sample in items (i) – (vii) above, but ignoring the requirement on the electron MVA dis-criminant. For the dielectron channel, we drop the MVA requirement on one of the electrons chosen randomly.
We measure the efficiency εe that events with a true electron pass the requirement on the electron MVA dis-criminant using Z/γ⋆→ ee data. We measure the effi-ciency fe that events with a misidentified jet pass the electron MVA requirement using eµ events chosen with selection criteria items (i) – (v), but requiring leptons of the same electric charge. For muons, we also ap-ply a reversed isolation requirement: ETµ,iso/pµT > 0.2, pµ,isoT /pµT > 0.2, and 6ET < 15 GeV, to minimize the con-tribution from W +jets events.
We extract the number of events with jets misidentified as electrons (nf), and the number of events with true electrons (ne), by solving the equations:
nloose= ne/εe+ nf/fe, (3)
ntight= ne+ nf, (4)
where ntight is the number of events remaining after im-plementing the selections (i) – (vii). The factors fe and
εeare measured separately for each jet multiplicity (0, 1, and 2 jets), and separately for electron candidates in the CC and EC parts of the calorimeter. Typical values of εe are 0.7 – 0.8 in the CC and 0.65 – 0.75 in the EC. Values of fe are 0.005 – 0.010 in the CC, and 0.005 – 0.020 in the EC.
In the eµ and µµ channels, we determine the number of events with an isolated muon arising from decays of hadrons in jets relying on the same selection as for the eµ or µµ channels, but requiring that both leptons have the same charge. In the µµ channel, this number of events is taken to be the number of same-sign events. In the eµ channel, it is the number of events in the same-sign sam-ple after subtracting the contribution from events with jets misidentified as electrons.
The numbers of predicted background events, as well as the expected numbers of signal events, in the four channels are given in Table II and show high signal purity of the selected sample.
To complete the asymmetry measurement, we must determine not only the total number of events arising from instrumental background, but also their distribu-tions in q × η and ∆η. To determine these distribudistribu-tions for this background in the ee and eµ channels, we use the loose selection described above and implement a veto on events with one tight electron (eµ channel) or two tight electrons (ee channel). The residual contributions of the Z boson and diboson processes, as well as the expected contribution from the t¯t events, are subtracted. In the µµ channel, we use the same sign events, where each of the muons is taken to have alternatively a negative and positive charge. The resulting distributions are normal-ized to the number of previously estimated background events.
IV. METHOD
Figure 1 presents the q × η and ∆η distributions for dilepton events after applying all but item (viii) of the se-lection criteria. We compute Aℓ
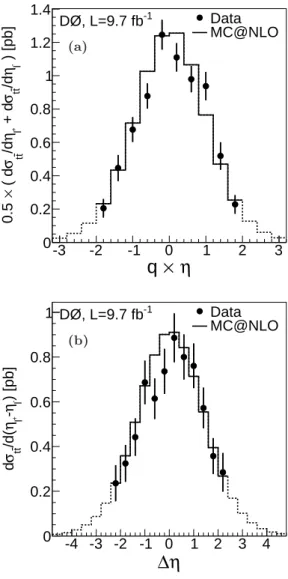
FB and Aℓℓ in two steps. First, within each of the four channels, we perform a bin-by-bin subtraction of the estimated background con-tributions to the data. The lepton pseudorapidities are measured in D0 with a resolution better than 1% result-ing in negligible migration effects. We therefore apply a simple bin-by-bin correction, which suffices to account for the efficiency of reconstruction and selection require-ments. The correction function is determined using t¯t mc@nlo events at the parton level within the fiducial region |η| < 2, |∆η| < 2.4 (here η refers to the gener-ated lepton pseudorapidity) and events after reconstruc-tion and selecreconstruc-tion. The asymmetries in the q × η and ∆η distributions after correction for selection efficiency are referred as “corrected” asymmetries. Figure 2 shows the corrected distributions for data compared to the pre-dictions from mc@nlo. The cross section in each bin is calculated as a weighted sum of the measurements in all
TABLE II: Numbers of total expected (Nexpected) and observed (Nobserved) events from backgrounds and t¯t signal assuming
the SM cross section (7.45 pb for a top quark mass of mt= 172.5 GeV [62]). Expected numbers of events are shown with their
statistical uncertainties. The uncertainty on the ratio of Nobserved/Nexpected takes into account the statistical uncertainty on
Nobserved and Nexpected.
Z→ ℓℓ Dibosons Multijet and
W+jets t¯t→ ℓℓjj Nexpected Nobserved
Nobserved Nexpected ee 17.2+0.6 −0.6 2.4+0.1−0.1 4.7+0.4−0.4 127.8 −1.4 −1.4 152.1+1.6−1.6 147 0.97 ± 0.08 eµ2 jets 13.7+0.5 −0.5 3.9+0.2−0.2 16.3+4.0−4.0 314.7+1.1−1.1 348.6+4.2−4.2 343 0.98 ± 0.05 eµ1 jet 8.7+0.6−0.6 3.4+0.2−0.2 2.9+1.7−1.7 61.7+0.5−0.5 76.7 −1.9 −1.9 78 1.02 ± 0.12 µµ 17.5+0.6−0.6 1.9+0.1−0.1 0.0−0.0+0.0 97.7+0.6−0.6 117.1+0.8−0.8 114 0.97 ± 0.09
η
×
q
-3 -2 -1 0 1 2 3 Events/0.4 0 50 100 150 200 250 300 -1 DØ, L=9.7 fb tt Z Instrum. Diboson Dataη
∆
-4 -3 -2 -1 0 1 2 3 4 Events/0.4 0 20 40 60 80 100 -1 DØ, L=9.7 fb tt Z Instrum. Diboson Data (a) (b)FIG. 1: (color online) Distributions in (a) q × η and (b) ∆η =
ηℓ+− ηℓ−, for the sum of ee, eµ and µµ channels, along with
predictions of the backgrounds and t¯tsignal. The black points show data events and the error bars indicate the statistical uncertainty on the data.
channels, where only the statistical uncertainty is taken into account.
In the second step, we extrapolate the corrected asym-metries to the full range of η by multiplying the cor-rected asymmetries with the calculated extrapolation fac-tor, which is given by the ratio of the generator level SM t¯t asymmetries from mc@nlo without selections to asymmetries within the fiducial region (|η| < 2 and |∆η| < 2.4). We refer to these asymmetries as “extrap-olated” asymmetries. The exact values of the |η| and |∆η| requirements are chosen to optimize the expected statistical precision of the extrapolated asymmetries.
V. SYSTEMATIC UNCERTAINTIES Systematic effects can affect the measured asymme-tries in different ways: (i) they can change the normal-ization or the differential dependence, i.e., “shape”, of the background distributions, (ii) they can affect the effi-ciency corrections and thereby modify the corrected and extrapolated asymmetries, and (iii) different MC genera-tors or model assumptions can impact the extrapolation to all phase space. For item (iii), we verify that when ax-igluon MC samples (see Sec II and Table I for predicted asymmetries) are used instead of mc@nlo to compute the extrapolation factor, we get consistent extrapolation factors. This shows that the model assumed for the ex-trapolation does not significantly affect the extrapolated correction.
We first consider the following sources of the system-atic uncertainty: uncertainties on the efficiencies of elec-tron and muon identification, uncertainties on trigger effi-ciencies, and uncertainties on jet-related quantities. The latter include contributions from the uncertainty in jet energy scale, jet energy resolution, jet identification effi-ciency, and b-quark jet tagging efficiency. All of these sys-tematic uncertainties are propagated to the background distributions and to the corrections for t¯t signal efficiency; they are found to be small and are grouped into the ob-ject identification (Obob-ject ID) category.
back-η
×
q
-3 -2 -1 0 1 2 3 ) [pb]- l η /d tt σ + d+l η /d tt σ ( d × 0.5 0 0.2 0.4 0.6 0.8 1 1.2 1.4 -1 DØ, L=9.7 fb Data MC@NLOη
∆
-4 -3 -2 -1 0 1 2 3 4 ) [pb]- l η -+l η /d( tt σ d 0 0.2 0.4 0.6 0.8 1 -1 DØ, L=9.7 fb Data MC@NLO (a) (b)FIG. 2: Distributions in (a) q×η and (b) ∆η, for the combined ee, eµ, and µµ channels after subtraction of background and correction for selection efficiency within the acceptance. The error bars indicate the statistical uncertainty on data. The dashed lines show the predictions from mc@nlo outside the analysis acceptance.
ground model. These include uncertainties on the asym-metries generated for Z boson events (see Sec. II) and on background normalization, which is typically ≈ 10%. The background normalization uncertainty accounts for the uncertainties on the integrated luminosity [63], ob-ject ID efficiency, b-tagging identification efficiency, and theoretical background cross sections. We also calibrate our ability to reconstruct angular asymmetries by com-paring asymmetries observed for Z bosons in data with MC simulation. We use samples with requirements (i)– (iv) only and ignore any jet selection in order to have a significant number of events and therefore a small sta-tistical uncertainty on the asymmetry (≈0.13% in data and ≈0.04% in simulation). We verify that we can re-produce the asymmetries observed in data if we reweight
TABLE III: Systematic uncertainties for the corrected and the extrapolated asymmetries. All values are given in %.
Corrected Extrapolated Aℓ FB Aℓℓ AℓFB Aℓℓ Source Object ID 0.54 0.50 0.59 0.60 Background 0.66 0.74 0.72 0.88 Hadronization 0.52 0.62 0.62 0.92 MC statistics 0.19 0.23 0.23 0.37 Total 1.02 1.12 1.14 1.46
the MC distributions using distributions obtained with pythia8 [58]. This reweighting is based on the ratio of two-dimensional distributions in (ηℓ+, ηℓ−) space for alp-genand pythia 8. After requiring one or two jets, we observe a residual difference between the data and MC asymmetries in a sample dominated by background ob-tained by reversing the b-quark-tagging requirement (vi). We take this difference as a systematic uncertainty on the contribution from the Z boson background.
The most significant contribution to the background-related uncertainty is from the uncertainty on instru-mental background. We estimate this by changing the amount of instrumental background according to the un-certainty on its normalization. We also account for possi-ble uncertainties in the distribution of instrumental back-ground by changing the number of events in each bin of the of this instrumental background distribution by ± 1 SD of its statistical uncertainty. The changes are applied in opposite directions for the positive q × η ≥ 0 or ∆η ≥ 0 and negative q × η < 0 or ∆η < 0 parts of the distributions in order to maximize the effect.
Another important uncertainty is related to the choice of parton showering and hadronization in t¯t events. This is evaluated by taking the difference between the asymmetries obtained with efficiency corrections and ex-trapolation factors using mc@nlo+herwig and alp-gen+pythia. This estimation also includes the differ-ence in the simulation of NLO effects between mc@nlo and alpgen generators.
Finally, we consider the limited statistics of the MC samples used to measure the efficiency correction. These provide the smallest contributions to the systematic un-certainties on the extracted asymmetries. All the above systematic uncertainties are listed in Table III.
As shown in the following section, the main uncertainty on the measured asymmetries is due to the limited size of the data sample.
VI. RESULTS
We combine the asymmetries measured in the ee, eµ 2 jets, eµ 1 jet, and µµ channels using the BLUE method [64, 65], assuming 100% correlation among their systematic uncertainties. Table IV summarizes the
cor-TABLE IV: The measured corrected and extrapolated asym-metries defined in Eqs. (1) and (2) combined for all channels separately and combined, compared to the predicted SM NLO asymmetries [38] for inclusive t¯t production. The measured extrapolated asymmetry should be compared with the SM NLO prediction. The first uncertainty on the measured values corresponds to the statistical and the second to the system-atic contribution. All values are given in %. The uncertainty on the SM NLO predictions are due to renormalization and factorization scale variations.
AℓFB Corrected Extrapolated Prediction
ee 6.8 ± 8.5 ± 1.3 eµ2 jets 5.0 ± 4.6 ± 1.0 eµ1 jet −0.1 ± 10.4 ± 2.5 µµ 0.8 ± 8.5 ± 1.4
Combined 4.1 ± 3.5 ± 1.0 4.4 ± 3.7 ± 1.1 3.8 ± 0.3 Aℓℓ Corrected Extrapolated Prediction
ee 16.4 ± 10.4 ± 1.6 eµ2 jets 11.1 ± 6.3 ± 1.3 eµ1 jet −2.1 ± 15.7 ± 3.4 µµ 7.4 ± 11.7 ± 1.4
Combined 10.5 ± 4.7 ± 1.1 12.3 ± 5.4 ± 1.5 4.8 ± 0.4
rected and extrapolated asymmetries, as well as the pre-diction from a SM NLO calculation including QCD and electroweak (EW) corrections [38]. The measured values are consistent with theoretical predictions based on the SM.
In addition, we study the dependence of the corrected asymmetries as a function of q×η and ∆η in Fig. 3, where we observe no significant dependence on these variables in the data and consistent with the mc@nlo [48, 49] predictions. Figure 3 also shows the comparison with the two axigluon models described in Sec. II.
To study the statistical correlation between Aℓ FB and Aℓℓ, we assume that positive and negative leptons have identical rapidity distributions, and we use the lepton q × η distribution in data (Fig. 2) as the basis for gen-erating an ensemble of q × η distributions. The resid-ual reconstruction level differences between positive and negative leptons distributions are made negligible by the regular flip of the solenoid and toroid polarities during the data taking. The number of events in each bin is drawn from a Gaussian distribution with mean equal to the number of events in the bin of the initial distribu-tion and width equal to the statistical uncertainty on the number of events. The resulting distributions are used as probability density functions to generate pairs of rapidity values for positive and negative leptons (ηl+, ηl−). Since the value of η for each lepton is generated independently, there is no direct correlation between them. Repeating this procedure many times, we form the ∆η = ηℓ+− ηℓ− distribution and calculate both the Aℓ
FBand Aℓℓ asymme-tries. Using the (Aℓ
FB, Aℓℓ) pairs generated in this way, we measure the correlation between the two asymme-tries to be 0.82. We verify that the value of Aℓℓobtained
|
η
×
|q
0 0.5 1 1.5 2 (%) FB l A -10 0 10 20 30 DataMC@NLO Model 1 Model 2 -1 DØ, L=9.7 fb|
η
∆
|
0 0.5 1 1.5 2 (%) ll A -10 0 10 20 30 DataMC@NLO Model 1 Model 2 -1 DØ, L=9.7 fb (a) (b)FIG. 3: (color online) Asymmetry distributions in (a) |q × η| and (b) |∆η| = |ηℓ+− ηℓ−|, for the combined ee, eµ, and µµ channels after background subtraction and after corrections for selection efficiency. The error bars indicate statistical un-certainties on the data. The data are compared with expec-tations from mc@nlo and axigluon Model 1 and Model 2 as defined in the text.
with the same method but using the MC q × η event dis-tribution as input accurately reproduces the simulated asymmetry from mc@nlo and axigluon models. Us-ing this correlation coefficient, we can compute the ra-tio of the two extrapolated asymmetries in data to be R = Aℓ
FB/Aℓℓ = 0.36 ± 0.20, consistent at the level of 2 SD with the prediction of 0.79±0.10. The uncertainty on the theoretical ratio is estimated by adding in quadrature the uncertainty on the theoretical expectations for Aℓ
FB and Aℓℓand without taking into account the possible cor-relation between these two values. This predicted ratio is found to be almost the same for the different tested models as can be seen in Fig. 4.
(%) ll A 0 5 10 15 20 (%) l FB A 5 10 15 -1 DØ, L=9.7 fb σ 1 σ 2 σ 3 Data MC@NLO Model 1 Model 2 SM NLO FIG. 4: Extrapolated Aℓ
FBversus Aℓℓasymmetries in t¯tdata,
the predictions from mc@nlo, axigluon models, and from the latest SM NLO prediction [38]. The ellipses represent con-tours of total uncertainty at 1, 2, and 3 SD on the measured result. All values are given in %. Predicted asymmetries are shown with their statistical uncertainties.
fers from that in our previous measurement [35], but are compatible. The change in central value is due to changes in object identification and event selections (in particu-lar, the use of b-quark jet identification) that improve the signal-to-background ratio and significantly reduce all systematic uncertainties related to background con-tributions, which affects the central values of the results.
VII. CONCLUSION
We have presented measurements of asymmetries in angular distributions of leptons produced in t¯t dilep-ton final states. Using the full Run II Tevatron dataset recorded by the D0 detector, we measure the single lep-ton and dileplep-ton asymmetries, corrected for reconstruc-tion efficiency as:
AℓFB= (4.1±3.5 (stat)±1.0 (syst))% , |η| < 2.0, |∆η| < 2.4, and
Aℓℓ= (10.5±4.7 (stat)±1.1 (syst))% , |η| < 2.0, |∆η| < 2.4. In addition, extrapolating these asymmetries for accep-tance selections yields the inclusive t¯t lepton asymme-tries:
AℓFB= (4.4 ± 3.7 (stat) ± 1.1 (syst))%, and
Aℓℓ= (12.3 ± 5.4 (stat) ± 1.5 (syst))%.
These values are compatible with the SM NLO calcula-tion that includes QCD and EW correccalcula-tions [38]. We have studied the correlation between Aℓ
FB and Aℓℓ and computed the ratio of the two asymmetries, which also shows agreement with calculations based on the standard model.
VIII. ACKNOWLEDGEMENTS
We thank the staffs at Fermilab and collaborating in-stitutions, and acknowledge support from the DOE and NSF (USA); CEA and CNRS/IN2P3 (France); MON, NRC KI and RFBR (Russia); CNPq, FAPERJ, FAPESP and FUNDUNESP (Brazil); DAE and DST (India); Col-ciencias (Colombia); CONACyT (Mexico); NRF (Ko-rea); FOM (The Netherlands); STFC and the Royal So-ciety (United Kingdom); MSMT and GACR (Czech Re-public); BMBF and DFG (Germany); SFI (Ireland); The Swedish Research Council (Sweden); and CAS and CNSF (China).
IX. APPENDIX: DIFFERENTIAL ASYMMETRY TABLES
Table V shows the t¯t differential cross section in bins of q × η and ∆η as shown in Fig. 2. 12 × (
dσt¯t
dηl+ +
dσt¯t
dηl−) represents the t¯t differential cross section in q × η and
dσt¯t
d(ηl+−ηl−)the t¯t differential cross section in ∆η. Table VI shows the values of the asymmetries in different angular regions as shown in Fig. 3.
TABLE V: t¯tcross section in each bin of Fig. 2. Bin 1 2× ( dσt¯t dηl+ + dσt¯t dηl−) [pb] dσt¯t d(ηl+−ηl−) [pb] −2.4, −2.0 0.0 0.236 ± 0.081 −2.0, −1.6 0.205 ± 0.056 0.325 ± 0.082 −1.6, −1.2 0.446 ± 0.078 0.442 ± 0.084 −1.2, −0.8 0.677 ± 0.075 0.686 ± 0.097 −0.8, −0.4 0.878 ± 0.076 0.614 ± 0.091 −0.4, 0.0 1.245 ± 0.089 0.736 ± 0.101 0.0, 0.4 1.110 ± 0.085 0.886 ± 0.109 0.4, 0.8 0.979 ± 0.079 0.800 ± 0.101 0.8, 1.2 0.937 ± 0.085 0.761 ± 0.100 1.2, 1.6 0.518 ± 0.082 0.572 ± 0.091 1.6, 2.0 0.228 ± 0.056 0.357 ± 0.081 2.0, 2.4 0.0 0.285 ± 0.086
TABLE VI: Value of the asymmetries in different bins of the distributions of Fig. 3. |q × η| bin AℓFB 0.0, 0.4 −0.061 ± 0.052 0.4, 1.2 0.103 ± 0.045 1.2, 2.0 0.057 ± 0.101 |∆η| bin Aℓℓ 0.0, 0.4 0.092 ± 0.091 0.4, 1.2 0.083 ± 0.066 1.2, 2.4 0.125 ± 0.088
[1] F. Abe et al. (CDF Collaboration), Phys. Rev. Lett. 74, 2626 (1995).
[2] S. Abachi et al. (D0 Collaboration), Phys. Rev. Lett. 74, 2632 (1995).
[3] W. Bernreuther and Z.-G. Si, Nucl. Phys. B837, 90 (2010).
[4] W. Hollik and D. Pagani, Phys. Rev. D 84, 093003 (2011).
[5] V. Ahrens, A. Ferroglia, M. Neubert, B. D. Pecjak, and L. L. Yang, Phys. Rev. D 84, 074004 (2011).
[6] J. H. Kuhn and G. Rodrigo, High Energy Phys. 1201 (2012), 063.
[7] P. Ferrario and G. Rodrigo, Phys. Rev. D 78, 094018 (2008).
[8] P. Ferrario and G. Rodrigo, Phys. Rev. D 80, 051701 (2009).
[9] O. Antunano, J. H. Kuhn, and G. Rodrigo, Phys. Rev. D 77, 014003 (2008).
[10] P. H. Frampton, J. Shu, and K. Wang, Phys. Lett. B 683, 294 (2010).
[11] D.-W. Jung, P. Ko, J. S. Lee, and S.-H. Nam, Phys. Lett. B 691, 238 (2010).
[12] A. Arhrib, R. Benbrik, and C.-H. Chen, Phys. Rev. D 82, 034034 (2010).
[13] A. Djouadi, G. Moreau, F. Richard, and R. K. Singh, Phys. Rev. D 82, 071702 (2010).
[14] E. Alvarez, L. Da Rold, J. I. S. Vietto, and A. Szynkman, J. High Energy Phys. 09 (2011), 007.
[15] C.-H. Chen, G. Cvetic, and C. Kim, Phys. Lett. B 694, 393 (2011).
[16] D.-W. Jung, P. Ko, and J. S. Lee, Phys. Lett. B 701, 248 (2011).
[17] J. Aguilar-Saavedra and M. Perez-Victoria, Phys. Lett. B 705, 228 (2011).
[18] G. Marques Tavares and M. Schmaltz, Phys. Rev. D 84, 054008 (2011).
[19] R. Barcelo, A. Carmona, M. Masip, and J. Santiago, Phys Lett. B 707, 88 (2012).
[20] K. Cheung, W.-Y. Keung, and T.-C. Yuan, Phys. Lett. B 682, 287 (2009).
[21] B. Xiao, Y.-k. Wang, and S.-h. Zhu, Phys. Rev. D 82, 034026 (2010).
[22] Q.-H. Cao, D. McKeen, J. L. Rosner, G. Shaughnessy, and C. E. Wagner, Phys. Rev. D 81, 114004 (2010). [23] S. Jung, H. Murayama, A. Pierce, and J. D. Wells, Phys.
Rev. D 81, 015004 (2010).
[24] J. Cao, Z. Heng, L. Wu, and J. M. Yang, Phys. Rev. D 81, 014016 (2010).
[25] V. Barger, W.-Y. Keung, and C.-T. Yu, Phys. Rev. D 81, 113009 (2010).
[26] M. Bauer, F. Goertz, U. Haisch, T. Pfoh, and S. West-hoff, J. High Energy Phys. 11 (2010), 039.
[27] R. S. Chivukula, E. H. Simmons, and C.-P. Yuan, Phys. Rev. D 82, 094009 (2010).
[28] I. Dorsner, S. Fajfer, J. F. Kamenik, and N. Kosnik, Phys. Rev. D 81, 055009 (2009).
[29] J. Shu, T. M. Tait, and K. Wang, Phys. Rev. D 81, 034012 (2010).
[30] J. Aguilar-Saavedra and M. Perez-Victoria, J. High En-ergy Phys. 09 (2011), 097.
[31] T. Aaltonen et al. (CDF Collaboration), Phys. Rev. D 87, 092002 (2013).
[32] V. M. Abazov et al. (D0 Collaboration), Phys. Rev. D 84, 112005 (2011).
[33] The pseudorapidity η is defined as a function of the polar angle θ with respect to the proton beam as η= − ln(tanθ
2). Positive (negative) η corresponds to a
particle produced in the direction of the incoming pro-ton (antipropro-ton).
[34] T. Aaltonen et al. (CDF Collaboration) (2013), arXiv:1308.1120.
[35] V. M. Abazov et al. (D0 Collaboration), Phys. Rev. D. 87, 011103(R) (2013).
[36] G. Aad et al. (ATLAS Collaboration), Eur. Phys. J. C72, 2039 (2012).
[37] S. Chatrchyan et al. (CMS Collaboration), Phys. Lett. B 717, 129 (2012).
[38] W. Bernreuther and Z.-G. Si, Phys. Rev. D 86, 034026 (2012).
[39] V. M. Abazov et al. (D0 Collaboration), Nucl. Instrum. Methods Phys. Res. A 565, 463 (2006).
[40] R. Angstadt et al. (D0 Collaboration), Nucl. Instrum. Methods Phys. Res. A 622, 298 (2010).
[41] M. Abolins et al., Nucl. Instrum. Methods Phys. Res. A A584, 75 (2008).
[42] S. Abachi et al. (D0 Collaboration), Nucl. Instrum. Meth-ods Phys. Res. A 338, 185 (1994).
[43] V. M. Abazov et al. (D0 Collaboration), Nucl. Instrum. Methods Phys. Res. A 552, 372 (2005).
[44] V. M. Abazov et al. (D0 Collaboration), submitted to Nucl. Instrum. Methods Phys. Res. A, arXiv:1307.5202 [hep-ex] (2013).
[45] G. C. Blazey et al., arXiv:hep-ex/0005012 (2000). [46] V. M. Abazov et al. (D0 Collaboration), Nucl. Instrum.
Methods Phys. Res. A 620, 490 (2010).
[47] R. Brun and F. Carminati, CERN Program Library Long Writeup W5013 (1993) (unpublished).
[48] S. Frixione and B. R. Webber, J. High Energy Phys. 06 (2002), 029.
[50] G. Corcella et al., J. High Energy Phys. 01 (2001), 010. [51] M. L. Mangano et al., J. High Energy Phys. 07 (2003),
001.
[52] T. Sjostrand, S. Mrenna, and P. Z. Skands, J. High En-ergy Phys. 05 (2006), 026.
[53] T. Affolder et al. (CDF Collaboration), Phys. Rev. D 65, 092002 (2002).
[54] P. M. Nadolsky et al., Phys. Rev. D 78, 013004 (2008). [55] R. Gavin, Y. Li, F. Petriello, and S. Quackenbush,
Com-put. Phys. Commun. 182, 2388 (2011).
[56] R. K. Ellis, Nucl. Phys. Proc. Suppl. 160, 170 (2006). [57] V. M. Abazov et al. (D0 Collaboration), Phys. Lett. B
693, 522 (2010).
[58] T. Sjostrand, S. Mrenna, and P. Z. Skands, Comput. Phys. Commun. 178, 852 (2008).
[59] A. Falkowski, M. L. Mangano, A. Martin, G. Perez, and J. Winter (2012), arXiv:1212.4003.
[60] V. M. Abazov et al. (D0 Collaboration), Phys. Lett. B 704, 403 (2011).
[61] V. Abazov et al. (D0 Collaboration), Phys. Rev. D76, 092007 (2007).
[62] S. Moch and P. Uwer, Phys. Rev. D 78, 034003 (2008). [63] T. Andeen et al. (D0 Collaboration),
FERMILAB-TM-2365 (2007).
[64] A. Valassi, Nucl. Instrum. Methods Phys. Res. A 500, 391 (2003).
[65] L. Lyons, D. Gibaut, and P. Clifford, Nucl. Instrum. Methods Phys. Res. A 270, 110 (1988).

![TABLE IV: The measured corrected and extrapolated asym- asym-metries defined in Eqs. (1) and (2) combined for all channels separately and combined, compared to the predicted SM NLO asymmetries [38] for inclusive t ¯t production](https://thumb-eu.123doks.com/thumbv2/123doknet/14065473.461945/9.918.509.800.87.659/measured-corrected-extrapolated-separately-predicted-asymmetries-inclusive-production.webp)


