HAL Id: halshs-00113499
https://halshs.archives-ouvertes.fr/halshs-00113499v2
Submitted on 15 Jan 2007
HAL is a multi-disciplinary open access
archive for the deposit and dissemination of
sci-entific research documents, whether they are
pub-lished or not. The documents may come from
teaching and research institutions in France or
abroad, or from public or private research centers.
L’archive ouverte pluridisciplinaire HAL, est
destinée au dépôt et à la diffusion de documents
scientifiques de niveau recherche, publiés ou non,
émanant des établissements d’enseignement et de
recherche français ou étrangers, des laboratoires
publics ou privés.
quality-adjusted patents in the US Pharmaceutical
industry
Gautier Duflos
To cite this version:
Gautier Duflos. Persistence of innovation, technological change and quality-adjusted patents in the
US Pharmaceutical industry. 2006. �halshs-00113499v2�
Maison des Sciences Économiques, 106-112 boulevard de L'Hôpital, 75647 Paris Cedex 13 http://mse.univ-paris1.fr/Publicat.htm
UMR 8174
Persistence of Innovation, Technological Change
and Quality-Adjusted Patents in
the US Pharmaceutical Industry
Gautier D
UFLOSCHANGE AND QUALITY-ADJUSTED PATENTS IN
THE US PHARMACEUTICAL INDUSTRY
Gautier DUFLOS
yCREST/LEI & Université de Paris I, Centre d’Economie de la Sorbonne - CNRS
January 2006
Abstract
This paper analyzes the American pharmaceutical …rms’persistence in innovating prior to a wave of mergers and acquisitions that accompanied the “Biotech revolution”. We evaluate the impact of past innovative activity on …rms’ innovation propensities using a non-linear GMM estimator for exponential models that allows for predetermined regressors and linear feedback. We …nd that innovative activity at the …rm level strongly depends on the tech-nological importance of past innovations. In particular this e¤ect is likely to deter further pioneering behaviors rather than strengthen non cumulative R&D. Results also shed light on the importance of small …rms in the technological development of pharmaceuticals, and suggest that large …rms mainly persist in using patents possibly for strategic purpose.
Keywords: Patent Citations, Pharmaceutical Industry, Persistence in Innovation. Ce papier analyse la persistance à innover des laboratoires pharmaceutiques Américains, antérieurement à la vague de fusions et acquisitions qui accompagna la "révolution des biotech-nologies". Nous évaluons l’impact de l’activité passée d’innovation sur la propension courante à innover via des GMM non linéaires. Nous trouvons que l’activité d’innovation au niveau de la …rme dépend fortement de la portée de son passé inventif. Plus particulièrement, les découvertes radicales dépendent fortement de la qualité des innovations passées de la …rme et cet e¤ et semble la détourner de comportement pionniers plutôt que l’inciter à poursuivre une recherche non cumulative. Les résultats montrent aussi que le niveau de l’activité et le pouvoir de marché des …rmes sont négativement corrélés avec l’importance technologique des innovations faites et ne sont positivement corrélé qu’avec les dépôts brevets simples. Les petites …rmes apparaissent alors être la principale source du changement technologique tandis que les …rmes plus importantes semblent avoir moins d’in‡uence et pourraient donc utiliser le brevet à des …ns plus stratégiques.
Mots clés: Citations de Brevets, Industrie Pharmaceutique, Persistance à Innover.
JEL: O31, L12, C23.
This article bene…ts from fruitful discussions with MP. Zuniga following our earlier collaboration. I am also grateful to Rodolphe Desbordes, Bronwyn Hall, Laura Hering, Frank Lichtenberg, Michelle J. Neuman, Etienne P…ster, Faye Steiner, Frank Windmeijer and to the various participants of conferences and research seminars where the paper has been presented. The usual disclaimer applies.
yThe author is also a¢ liated to PRISM-HEC. Contact adress: CREST-LEI Timbre J330, Ecole Nationale des
1
Introduction
Ever since Schumpeter’s initial insights, the questions related to …rms’e¢ ciency and persistence in innovating have been a recurrent topic of interest.1 This literature emphasizes the two
fun-damental principles which are epitomized in the Schumpeter’s "creative destruction" or "creative accumulation".2 These two principles consider di¤erently the relationship between economic
dom-ination and innovation activity. Which of these two principles dominates the other depends on the fundamental assumptions that are made concerning the properties of technology –speci…c to …rms or equally accessible to everybody– and concerning the nature of innovative process –cumulative or not–(Ce…s, 2003). Basically the Schumpeter dynamics is such that innovation may lead to new technologies which undermine old monopolies’position although dominant …rms may also bene…t from history to innovate cumulatively.3 Accordingly, size and frequency of innovations are the fruit
of two counteracting forces. On the one hand, the monopolist faces a "displacement e¤ect" which indicates that …rms with high market power will have no incentive to win a patent race too quickly as their current revenue streams will be displaced by an entirely new one.4 Indeed, entrants may
have greater strategic incentives to invest in fundamental research leading to (radical) innovations.5 Nelson & Winter (1982) and Kamien & Schwartz (1982) labelled this pattern of innovative activ-ity the "Schumpeter Mark I" in reference to what Schumpeter states in The Theory of Economic Development (1934). On the other hand, Gilbert & Newbery (1982) and Bud et al. (1993) argue that large …rms are more likely to innovate persistently mainly because of an "e¢ ciency e¤ect". This e¤ect reports the "persistence of monopoly" as being the extent to which leaders will spend more on pursuing innovation in order to maintain their dominance (e.g. Scherer, 1967). Dominant …rms may also bene…t from barriers to entry making them able to be persistent innovators as it is illustrated in the model of Segestrom & Zolnierek (1999). This pattern of innovative activity is also known as "Schumpeter Mark II" in reference to Capitalism, Socialism,and Democracy (1942).
1See Scherer (1992), Pavitt (1988), Pavitt & Patel (1994) and Dosi (1988) for detailed discussions on this point. 2For a detailed analysis of these two Shumpeterian models of innovation see Scherer (1992) and Ce…s (2001)
among others.
3Segestrom & Zolniereck (1999), for example, explain why industry leaders can often devote substantial resources
to R&D by assuming they can improve their own products more easily than can other …rms.
4See Arrow (1962), Reinganum (1982, 1983).
5Similar predicitions are found in the organizational theory about the failure of incumbent …rms to conduct
radical innovation because of the diseconomies of R&D, inertia, complacency, etc., which makes harder to achieve returns to radical R&D (see Henderson, 1993).
The persistence in innovation is thus a key feature of the patterns of technological change. Despite the importance of this concern there is still few empirical evidences on both the …rms’ persistence in innovating and there innovations’quality. The aim of this research is thus to …ll in this gap by analyzing the intra-…rms technological dynamics of some US pharmaceuticals between the mid seventies and the nineties. Several questions are thus treated:
i) How persistently …rms innovate and with what scope? ii) Which …rms in‡uence the technological change?
Because innovation is often seen as a black box, this study relies on the use of patent and patent citation data as a better measure of …rms’innovative activity.6 Patent citations makes it
indeed possible to take into account both the in‡uence and dependence which a given patent exerts on, and undergoes from, existing innovations. Such data are particularly pertinent for studying pharmaceuticals essentially because given the considerable investments they require, drugs are one category of innovation where the incentive-giving role of patents works best (Arora et al. 2001). Patenting in pharmaceuticals however remains also very heterogeneous in terms of technological importance and it is well known that pharmaceutical …rms often rely on patents for anti-competitive practices, notably in order to face competition exerted by generics7 or by other research intensive …rms.8 In pharmaceuticals innovators may thus take out hundreds of patents on marginal variations
of the same basic invention, to erect a patent "fence" to keep unwanted competitors and imitators out (Davis, 2002).
The paper’s contributions are twofold. Firstly, by identifying pioneering discoveries and assess-ing the …rms’technological in‡uence accordassess-ing to patent citation criteria (forward and backward citations), we evaluate in detail the …rms’ propensities to innovate (their inventiveness and their technological in‡uence), conditional on their lagged R&D expenditures, internal spillover, amount of sales and market power then on their various patent stocks (i.e. accumulated knowledge). Sec-ondly, we evaluate the feedback e¤ects of past innovative activity on the current propensity to
6See Trajtenberg (1990), Hall et al. (2001) and Lanjouw & Schankerman (2002) for studies using patent citations. 7See Langinier (2001, 2004), Arundel & Patel (2003).
8See Lichtenberg & Philipson (2002) for an analysis on the di¤erent competitions ("between" and "whithin"
innovate to assess the role history plays in the …rms’ innovative behavior. Data on patenting and citations, in addition to …rms’economic data, has been carefully gathered to obtain a unique unbalanced panel data for 77 traded innovating pharmaceutical …rms for the period 1975-91.9
Results indicate that innovative activities are rather persistent but strongly depend on the technological importance, or value, of past innovations. Most persistent innovative behaviors mainly concern those innovations having the poorest technological value. Conversely, the techno-logical breakthroughs are likely to deter further pioneering behaviors in the short run rather than strengthen incentives to pursue investing in non cumulative R&D. The dynamic of innovation ap-pears thus to be an important feature of innovative activity in pharmaceuticals. In addition, the …rms’level of commercial activity and their market power appear to be negatively correlated with the technological in‡uence of innovations. Small …rms are consequently seen as being the major sources of technological change in the pharmaceutical industry whereas large …rms seem to use patents strategically to retain sales.
The remainder of the paper is organized as follows: Section 2 quickly describes the relevant literature then lays out the basis for the use of patent citations and their advantages for such an analysis. Section 3 presents the methodology, the variables and the data employed, Section 4 presents the results and their interpretation and Section 5 concludes.
2
Background
In many empirical works the manufacturing industry exhibits a decreasing R&D productivity which is particularly accentuated in pharmaceuticals.10 The pharmaceutical industry is one of
the most intensive knowledge sectors, devoting currently more than 20 % of sales to research and development (PhRMA, 2000). The decline of innovation is such that the average cost to develop New Chemical Entities (NCE) has risen from $180 million in the eighties up to more
9Even if original data cover 1975-95 we focus on the period 1975-91 for two reasons. Firstly to deal with the
truncation problem related to forward citation lags (see section "Data and Methodology" and for details Hall et al. 2001). Secondly to avoid bias the wave of mergers and acquisitions in the mid 90’s (seen as an external acquisition of knowledge) may induce when analyzing …rms’ innovation e¤orts.
1 0As shown by Dimasi (1991) and Dimasi et al. (1999), pharmaceutical innovation costs have dramatically
increased since the last decade in part due to the stricter rules on clinical trials, in addition to increasing complexities in technology discovery; see also Henderson & Cockburn (1998) and Cockburn (2006).
than $800 millions in 2000.11 The regulatory framework may have contributed to some extent
to rising costs which leads to the decline of R&D productivity and an increasing di¢ culty to bring innovation onto the market. In addition the competition exerted by generics is stronger and stronger (Grabowski and Vernon, 1990) such that in the eighties they represent half of the prescriptions on the US market. Furthermore as it takes on average 14 years from laboratory and animal studies to FDA (Food and Drug Administration) approval (Viscusi et al. 2000), approvals in 2000 are related to patents which has been granted between 1985 and 1990. Technological exhaustion (within a dynamics of "creative accumulation") in pharmaceuticals may also explain such a decline. The emergence of biotechnologies and genomics in the eighties, rede…ned invention methods for drugs from randomly screening of a large number of potentially useful compounds towards a more systematic approach called "rational drug design".12 This revolution in the research
methods has therefore induced new challenges to the extent that the NCE are more and more speci…c. Analogously, the role played by competitive entrants in comparison to dominant …rms can shed light on the articulation between "creative destruction" and "creative accumulation" in the discovering of new compounds.
The pharmaceutical industry is also recognized as the sector where the patent is the more e¤ec-tive and, consequently, the principal industry relying on patents to appropriate returns to R&D and to exclude technological followers. According to Bruce Lehman (2003)13, President of the Interna-tional Intellectual Property Institute, "the pharmaceutical industry is one of three technology-based industries in which the patent virtually equals the product. The others are the chemical industry (including agricultural chemicals) and the biotechnology industry". Levin et al. (1984) showed that a patent is the most e¤ective to appropriate returns in industries with chemical-based technologies, such as pharmaceuticals, which makes it a very convenient …eld for analyses which proxy innova-tion activity with patent grants. However …rms may also be strategically granted many “poor” patents –as many legal right to exclude– to build barriers to entry (foreclosure) or to develop ex-isting inventions in response to increasing di¢ culties to innovate. To extend market exclusivity on
1 1Source: Tufts Center for the Study of Drug Development (2001).
1 2This involves exploiting knowledge about the biochemical mechanisms causing a disease to identify or develop
chemicals that inhibit such mechanisms, see Malerba & Orsenigp (2001, 2002) and Adam (2005) for a detailed description of this transition.
blockbuster drugs (those exceeding US$ 1 billion of yearly sales) beyond patent expiration, …rms use a number of strategies in response to the increasing competition of generics, allowed by policies like the Hatch-Waxman Act (1984), and to the threat of technological exhaustion. Nevertheless, as suggested by Caballero & Ja¤e (1993) and Lichtenberg (1998), the pharmaceutical industry remains the sector with the highest rate of creative destruction at the product level. Despite the fact that less and less pioneering inventions are discovered, leading to an erosion of the number of new (technologically) promising compounds invented, pharmaceuticals remains the most research intensive sector (Achilladelis & Orsenigo, 2001; Malerba & Orsenigo, 2001; 2002).
Finally, as pointed out by Griliches (1990), the technological value across patents –within a …rm’s patent portfolio and across …rms–largely di¤ers. That explains partly why some studies are based on innovation surveys –rather than on patent data– to analyze …rms’ innovation activity. Innovations surveys present however also some drawbacks inherent to their qualitative approaches. Notably the de…nition of innovation, as well as the distinction of its nature (radical or not), remains subjective and presumably arbitrary heterogeneous. To deal with both of these issues we thus choose to use patent and patent citations data to assess the …rms’innovation activity.
2.1
Persistence of Innovation in the Literature
A large strand of literature focuses on the persistence with which …rms innovate. This literature investigates whether …rms innovate persistently or discontinuously over time and attempts to assess the extent to which innovation ‡ows within …rms are interdependent over time. Contrasting views are put into light and often underline the role played by …nancial resources and/or technological leadership resulting from past innovation. These are either seen as an advantage to innovate or as a dead weight which limits future innovative ambitions. We can summarize that the litera-ture analyzing patterns of innovation agrees on innovative persistence being rather strong among large innovators and that consequently few –persistent– innovators account for the large major-ity of patenting with quite stable ranking. In other words, these studies con…rm the theoretical predictions on persistence only for a restricted group of …rms.
commercial success are a necessary condition to …nance R&D and by consequence to innovate persistently. Analogously, Simons (1995) explains that successful innovations o¤er technological advantages to innovate thereafter. Thus the cumulative nature of knowledge would induce state de-pendence in invention ‡ows and consequently persistence in innovation. Considering competition, Arrow (1962) shows that competitive markets generate greater incentives to invest in innovation than concentrated ones.14 In the case of free entry, Gilbert & Newberry (1982) show that market
dominant …rms will preempt potential entrant investment in innovation which leads to persistence in innovation activities. Reinganum (1983) however reinstates Arrow’s results by considering the case of uncertain innovations. She shows that a monopolist will seek to avoid overlapping in its product innovation portfolio, and thus will have less incentive to innovate than a competitive en-trant. From another point of view, Sutton (1991) considers the sunk costs in R&D investments as an important feature to take into account in studying persistence since they build barriers to entry and create engagements to continue innovation.
At the empirical level, studies focus on the "creative destruction" and "creative accumulation" in the technological dynamics (which of the two e¤ects prevails according to competitive circum-stances and …rms’ characteristics). They point out the di¤erences between dominant …rms and competitive entrants in the emergence of new technologies, their improvement and consequently the innovative interactions at work in the technological path design. Schumpeter initiated many debates directing researchers towards the questions dealing with the sources of the technological change but the interaction of market dominance and past innovative activity remains still incon-clusive. Several cross-sector studies demonstrate an apparent continuity, or persistence, in the …rms’innovative behaviors and, in general, agreed on the fact that only a few innovators account for a large share of innovations and do it continuously (i.e. persistence in innovation is weak as a whole as only a restricted group of …rms is concerned). Nevertheless, in almost all cases, the simple patent count, or the R&D activity, is used to proxy the …rms’innovative behavior excepting Duguet & Monjon (2004), Peters (2005) and Raymond et al. (2005) who use innovation surveys to overcome the limitations of patent data.
Crépon & Duguet (1997) use a panel of R&D performers and patent data to measure innovation in France. They estimate a dynamic count data model that estimates the relationship between the current number of patents to both the previous year number of patent and the amount invested in R&D. They …nd a rather strong persistence in innovation among formal R&D performers. Marbela & Orsenigo (1999) examine the patterns of innovative entry, exit and survival, using European Patent O¢ ce (EPO) data for six European countries through a descriptive analysis. They measure persistence by analyzing the duration of patenting after entry. They found a high degree of turbulence such as the process of entry and exit seems to support wide changes over the time in the innovators’ population. Hence, a large fraction of new innovators is composed by occasional innovators even if they constitute a signi…cant part of the whole population of innovators, despite a lower share in the total number of patents granted.15 Ce…s & Orsenigo
(2001) con…rm the weakness of persistence in innovation in a comparative analysis of six European countries over the period 1978-93, using a Transition Probability Matrix approach and a Markov chain that distinguishes "great-innovator" and "non-innovators". They assess the probability of remaining in the same stage of patenting and found a strong persistence in the …rms’ innovative activity. Firms have thus a high probability of staying in their original state, persistent innovators being the principal source of technological change. In addition they …nd a strong heterogeneity across …rms’ industry and size. Similar results are found by Ce…s (2003) who uses the same methodology for the UK over the period 1978-91 since she …nds "little persistence in general, but strong persistence among ’great’innovators that account for a large proportion of patents requested: innovative activities, at least which are captured by patents, are persistent ".16 Geroski et al. (1997),
in a duration analysis (Duration Dependence Weibull Model) that assesses the "patent spells"17 in
UK over the period 1969-88, …nd little evidence of persistence at the …rm level, even if persistent innovators account, once again, for a large share of the total patenting. They …nd similar results
1 5On this point Duguet & Monjon (2002) explain that in some activities, few innovators patent their inventions
(see also Cohen et al. (1997), Duguet & Kabla (1998)). Consequently the weak persistence would re‡ect in fact the weak use of patents in some sectors. In addition patent data would show the persistence of "anteriority" rather than that one of innovation. However in the speci…c case of the pharmaceutical industry these assumptions do not hold.
1 6In an earlier version, Ce…s (1996) already found a weak persistence in general but a strong persistence among
the greatest and the smallest innovator. By distinguishing …rms according to their size and sector, she sheds light on a substantial heterogeneity in the degree of persistence among the …rms of the sample.
1 7i.e. they de…ne the degree of innovation persistence of a …rm as the number of consecutive years during which
when considering "major innovations" instead of patent count. Cabagnols (2005) uses the same data to examine the impact of past patenting –the technological accumulation–on the …rms ability to be persistent in innovation and …nds also a positive and signi…cant relationship.
Concerning the technological speci…city of the innovation’s patterns, Marbela & Orsenigo (1996) show that the patterns di¤er systematically across technological classes (referring to Schumpeter Mark I and II), but are remarkably similar across countries for each technological class suggesting there is no country speci…c e¤ect contrarily to sectors. As a result they found that the process of "creative accumulation" is speci…c to the electronic and chemical industries whereas the me-chanical technologies are closer to a process of "creative destruction". This seems to support the assumption that industries where innovations are primarily based on knowledge (as pharmaceu-ticals) are more subject to technological accumulation (v.s. pioneering innovation) than others. Thereafter, Marbella et al. (1997) wonder if persistence and heterogeneity are associated with a high degree of concentration in the innovative activity and a stability in the ranking of innovators, or whether they are associated to other variables like the …rms’size and industrial concentration. As results, contrary to the Schumpeterian hypothesis,18 they found that the market structure
doesn’t play a clear role in the emergence of innovation while persistence and asymmetry seem to be the fundamental determining causes for it.
More recently, Duguet & Monjon (2004) propose to examine if innovation is persistent at the …rm level by comparing propensity score and regression methods. They use several innovation sur-veys on French …rms’innovative activity for the period 1986-1996. These data sets give information about the implementation of innovation at the …rm level, without any reference to their commer-cial success or their patenting status. Their results indicate that innovation persistence is strong (a …rm that already innovated in the past has a stronger probability to innovate in the future). In addition, the origin of the persistence depends on the size of the …rm: the learning-by-doing hypothesis (dynamic increasing returns) seems to play a major role in the small sized …rms whereas its weight decreases with the …rms’size. Finally the study shows that the importance of dynamic
1 8Nelson & Winter (1982) de…ne the Schumpeterian hypothesis as the fact that "A market structure involving
large …rms
increasing returns should decrease with the formalization of R&D activities. The paper suggests that omitting the dynamic increasing returns leads to underestimating the innovation persistence, especially in small-sized …rms. In this vein, Raymond et al. (2005) analyze the extent to which the production of innovations is subject to "dynamic economies of scale", or whether "success breeds success". They study the dynamic of innovative achievement and innovation pro…ts in the Dutch Community Innovation Survey by estimating a dynamic probit model and …nd a strong persistence of innovation pro…ts among the multi-period innovators. Recently, Peters (2005) uses data from the Mannheim Innovation Panel (manufacturing and service sectors) over the period 1994-2002 through a dynamic random e¤ects discrete choice model. She …nds that innovative behaviors are "permanent at the …rm-level to a very large extent" and that skilled employees and unobservable individual heterogeneity play an important role in explaining this behavior.
Given this state of the art on persistence in innovation, an interesting addition to the liter-ature would be to look at the nliter-ature of these inventions (technological scope, newness...) from a quantitative point of view and the di¤erent behaviors that might emerge following the …rms’ characteristics. In this vein, Lerner (1997) examined whether strategic behavior can be identi…ed in the decision to introduce new products in a high technology industry: the disk drive sector. Consistently with models rising doubts about the persistence of monopoly, he found that greater innovative activity is shown by the …rms which follow the leader. This result supports the idea that a second mover advantage exists in technological races Such an assumption may be tested in a dynamic approach of innovative activity. Empirical works which study persistence by dis-tinguishing innovation "qualities" or "scope" are very scarce. Such a dimension seems however fundamental to take into account, especially in the pharmaceutical industry where the "quality" –i.e. the technological magnitude–of new product is often seen as weak. In Geroski et al. (1997), an e¤ort was made in this sense by taking into account the simple counting of patents and the number "major innovations" made at the …rm level, i.e. those being technically innovative and commercially successful. However, this criteria may be questionable to the extent that the com-mercial success should be carefully interpreted and thus may be related to the brand-name or even the …rm’s advertising among other (unobservable) parameters. Since this de…nition involves a commercial success, the …rms considered as innovative are likely to be innovation leaders or
com-mercial leaders. Our study suggests several patent quality measures, exclusively based on forward and backward patents’citations. These quality measures only refer to the innovations’importance in a technological sense and thus allow to proxy for …rms’ innovation activity in a sharper way than the simple patent count.
2.2
Distinguishing Innovations Quality
Patent count, as a proxy for the …rms’ innovative activity, generally leads observers to assume a perfect homogeneity of quality between and within patent portfolios. Distinguishing the impor-tance of inventions would however permit to identify the real sources of technological change in the industry. Taking into account the dynamic e¤ects in such a question could o¤er valuable insights on the relationships existing among the persistence in innovating, the nature of the …rm’s R&D output and the inventors’characteristics (size, market dominance, R&D intensity, etc).
To describe how cumulative innovations are made, and consequently to understand the innova-tions’technological magnitude, we suggest several patent citations-based measures. The main idea supporting this methodology (widely recognized in the literature)19 is that the simple observation
of …rms’ patenting activity is an unsatisfactory measure of the real innovative e¤ort. This is in particular the case when …rms patent intensively, regardless of the innovations’quality, following a defence and/or blocking-entry strategy as shown in Lanjouw (1998) and Lanjouw et al. (1998).20
More generally, …rms may also di¤er in terms of competence in innovating (depending on history and on other factors like the position on the supply chain), some of them being more specialized in fundamental research than others and consequently generate more technological spillovers. In the next section we also present some of the strategic use of patents that may explain di¤erences in quality patenting. Overall, the simple patent count should therefore be interpreted carefully. Whereas technological breakthroughs are able to impel the technological change, others just deepen into an already existing knowledge. Thus some innovations may have a greater impact on techno-logical change than others because they may provoke new technotechno-logical perspectives. According
1 9See Scherer, 1967, Pakes & Griliches, 1980 and Griliches, 1990 among others on this point.
2 0As shown by previous studies, there are important di¤erences in R&D performance across industries and …rms,
and the way …rms rely on patents to appropriate sales; see Scherer (1967), Griliches (1990), Levin et al. (1987), Cohen & Levin (1989), Arundel & Kabla (1998).
to this, the main …ndings of the literature dealing with the …rms’ innovative behaviors may be contrasted, particularly concerning the persistence in innovating over the time. Hence, by distin-guishing the nature of innovations, this paper shows that persistence di¤ers widely according to innovation quality, pioneering discoveries following a "one shot" process in the short run (even if they are presumably generated by the same …rms) whereas other innovations are more persistent from one year to the next.
Up to now, some authors have attempted to estimate the private value of patents through their renewal patterns or by evaluating the stock-market value generated by patents announcements, among other techniques. Pakes & Schankerman (1984) and Schankerman & Pakes (1986) have proposed to proxy quality of patents by building the value of patent rights and their distribution value for the UK, France and Germany during the post-1950 period using renewal patent data21.
Guellec & Pottelsbergue (2000) study patents’values by evaluating the probability of obtaining a patent grant at the European Patent O¢ ce in function of the technological value of innovation, patenting and innovation strategies (collaboration etc.) followed by applicants at the international scale.
Trajtenberg (1990) is the …rst to construct an indicator of the value of innovation by weighting patent grants with the citations they received. He …nds a close association between citation-based patent indices and independent measures of the social value of innovation in the …eld of a particular innovation. An interesting methodology to build a quality-innovation index has been proposed by Lanjouw & Schankerman (1999). Using information on individual patents (the number of claims, the forward and backward citations and the family size) to build composite index of quality, they …nd in particular, that the patent quality index shows signi…cant power in predicting which patents will be renewed and which will be litigated. Further, Lanjouw & Schankerman (2004) show that research productivity is negatively correlated with the patent quality index whereas it is positively correlated with the stock market valuation of patented innovations. Through an empirical investigation concerning 100 US manufacturing …rms, the authors show that the use of
2 1They show that the variation in the quantity of patents in di¤erent cohorts tended to be negatively related to
the variation in their mean values. As the authors pointed out, this …nding implies that exclusive reliance on patent counts for measuring secular trends in the value of patented output could be quite misleading.
this quality adjusted measure of innovation could explain the so-called R&D paradox : the apparent decline in research productivity in the decade 1980-89.22 As they argue, it is likely that …rms face
a trade o¤ between "quality" (i.e. importance or scope) and "quantity" of innovation such as one should expected a negative relationship between patent counts and the average patents’quality at the …rm level, conditional on R&D. Such a result, as the authors indicate, would generate a di¤erent relationship between R&D and simple patent counts as compared to R&D and quality-adjusted patents.
2.3
The Strategic Dimension of Patents
An important aspect of patents may be their potential strategic dimension. Hall & Ziedonis (2001) examine the "patent paradox" i.e. the fact that …rms do not rely to patents to appropriate return of R&D more in the 1980s than before despite an unprecedented surge in patenting, they show that the "1980s strengthening of U.S. patent rights spawned a ‘patent portfolio race’among capital-intensive …rms". They consequently underlined the use of patents as a strategic variable to build legal rights to exclude competition in the semiconductor industry. In the study based on a survey questionnaire by Cohen et al. (2000), …rms seem to rely on a large range of mechanisms to protect the pro…t due to innovation. They found patents tend to be the least emphasized whereas secrecy and lead time seems to be the most used strategies in the majority of the manufacturing industries. In the speci…c case of the pharmaceutical industry however, …rms may more rely on patents as strategic variable to preserve their business from competition than in other sectors.23 The main reasons
supporting this opinion stand on the fact that secrecy is an extremely weak instrument of protection because of the (publicly available) clinical trials required in the development of each drugs and also because the pharmaceutical …rms’ outcomes are closely linked with the life of princeps’ patents. As a consequence, to extend market exclusivity on drugs beyond patent expiration, a number of strategies are implemented to deter entry in order to preserve monopoly power. Among them, Carlton & Gertner (2002) show that "the combination of dynamics, uncertainty, and market power
2 2Hence Lanjouw & Schankerman (1999, 2004) consider that if innovation varies widely in value, a part of
heterogeneity is due to innovation at birth. As a result they show how it is possible to foresee the “value” of an innovation via the four indicators mentioned above. The composite indicator contains the number of forward and backward citations, the claims and the family size of each patent and is estimated as one-factor latent variable model where the conditional mean is a linear combination of the indicators.
leads to one of the most important features of many R&D-intensive industries .an important form of competition is in R&D to replace the existing technology winner that has static market power with another based on improved technology". Hence, patenting around existing chemical entities ("me too drugs", ever-green patenting, etc.) have indeed become an important strategy followed by pharmaceutical …rms.24 The increasing threat of generics, allowed by policies like
the Hatch-Waxman Act (1984), may consequently motive research intensive …rms to use patents as a strategic variable to maintain their revenue. Such strategy imply evergreening that occurs when a brand-name manufacturer “stockpiles”patent protection by obtaining separate patents on multiple attributes of a single product.25 To evergreen their products, Carlton & Gertner (2002) explain that the originator company will develop a “life-cycle management plan” composed not only of patent strategies, but an entire range of practices aimed at limiting or delaying the entry of a generic product into the market. Some of the evergreening strategies are line extensions and so-called next-generation drugs.26 Patenting around existing chemical entities seems however to be
more and more sought by pharmaceutical …rms as shown by Lichtenberg (1996). Much of sequential innovation thus results from internally generated research and sequential product innovation which constitute an important feature of the pharmaceutical industry. Hence 60% of the new drugs approved in the 1990s were for "new formulations" or "new combinations" of already approved compounds. According to the Pharmaceutical Research and Manufacturers of America (PhRMA) "industry data indicate that of the $26 billion spent by U.S. …rms on pharmaceutical research in 2000, $5 billion (19 %) was spent on post-launch R&D for new indications, new formulations, and other improvements to existing products. Sequential product innovation is spurred by and fosters competitive pressures." These market developments, carefully balanced with protections for seminal intellectual property, have spurred additional innovation and competition. Hence, brand-name manufacturers introduce new dosage formulations that provide, a priori, superior therapeutic properties than the original formulation, and introduce over-the-counter versions of products. In
2 4See Lichtenberg (2000, 2001).
2 5These patents can cover everything from aspects of the manufacturing process to tablet color, or even a chemical
produced by the body when the drug is ingested and metabolized by the patient (see European Generic Medecines Association: www.egagenerics.com).
2 6Some of the evergreening strategies are also switching from prescription-only to over-the-counter status, exclusive
partnerships with chosen generics manufacturers, direct-to-consumer advertising, defensive pricing strategies or even more to establish a subsidiary generics unit to compete in the generics market before independent generics companies are allowed to do so.
parallel, breakthrough drugs may also face competition within their initial patent life from other branded drugs of the same therapeutic class.27 Consequently, the research intensive …rms tend to
rely heavily on product di¤erentiation to achieve competitive advantage over other branded rivals what, to a certain extent, can be considered as one strategic use of patent. Further, with the increasing generic competition allowed by the Hatch-Waxman Act, branded manufacturers tend to develop improved products to retain sales which can be another strategic use of patent.28
Strategic patenting to enclose sub-markets in order to face competition from other research intensive …rms (i.e. brand name manufacturers) or production intensive …rms (i.e. generics pro-ducers), may in‡uence the technological change by extending, to some …rms, the legal right to exclude imitators up to a foreclosure possibility on a whole technology. Statistically, the strategic dimension of patents may bias the observation of …rms’innovative e¤orts based on patents data. Indeed, it remains di¢ cult to distinguish strategic patenting from creative accumulation since in both cases patents are granted. Nonetheless the di¤erentiating of patent values in a technological sense allows to identify true innovations from strategic ones.
3
Data and Methodology
This study pursues several research goals. First, an analysis at the patent level is conducted in order to make a distinction of Leader and Follower (or pioneer and incremental) patents, on one hand, and to distinguish patents in term of technological value on the other hand. These distinctions are made thanks to the number of citations made and/or received per patent. Second, an exploration of the pharmaceutical …rms’ persistence to innovate, conditional on the di¤erent kind of innovations’ stocks, is presented. Third, the feedback e¤ect –the dynamics showing the persistence of innovation over the time– of the di¤erent patent grants is explored through an innovation function equation.
We use two data sources. Firstly, we extracted patent data from the NBER patent data …le, by Hall et al. (2001) concerning USPTO (United States Patent and Trademark O¢ ce) utility patents
2 7See the "between patent competition" in Lichtenberg & Philipson (2002).
2 8A recent example is that one of Mopral, which has recently lost its patent protection, which carried out
granted in the classes 424 and 514 (Drug, Bio-A¤ ecting and Body Treating Compositions) over the period 1973-1999. Secondly, we gathered …rms’patent data and match it by using the …rms’ CUSIP (Committee on Uniform Security Identi…cation Procedure) identi…er code with individual economic data from Standard & Poor’s COMPUSTAT annual industrial …les database that covers the period 1975-1995.29 Data are thus reduced to a sample of 77 pharmaceutical …rms patenting at
the USPTO between January 1975 and December 1994. We build …rms’quality-adjusted portfolio of patents as the sum of total patents weighted by their citation index which is also provided by the NBER.
Micro-Level Data from COMPUSTAT concerns R&D spending, capital stock, number of em-ployees, net sales, capital expenditures, cash ‡ow, and operating income (constant thousand US$ 94). After merging the two data sources and keeping only …rms having been granted patents at least three times consecutively at USPTO, we end up with a rather small sample of 77 pharma-ceutical …rms in a unbalanced panel data covering the period 1975-95. Contrary to other studies, we consider only …rms who patent regularly. By this focus we want to consider innovative behav-iors among real inventors: in the pharmaceutical industry only few patents become drugs30 and
laboratories must test hundreds of patented molecules before obtaining a result which will has a chance to be claimed an authorized drug. This relatively reduced sample eliminates the bias that may exist when considering also …rms that rarely patent. True drugs inventors have to test many new chemical entities (NCE) and consequently have to be granted many patents before obtaining a new promising compound to commercialize.
The database contains approximately 10,000 patents referred at USPTO. In this study, we focus on the innovations that concern exclusively NCE and we do not take into account other products. This choice is motivated by the fact that the NCE represent the most important share of the R&D e¤ort made by …rms and because strategic behaviors are expected on this market segment. The remaining patenting (excluding drugs) is assumed to represent a noisy measure of the real
2 9Matching between two sources has been made through an intermediary …le the containing CUSIP code (Hall et
al. (2001)) and the corresponding corporate company name and USPTO’s assignee code. Since Compustat includes …rms that are traded in the US stock market (manufacturing …rms) our …nal database concerns mainly American Pharmaceutical Firms.
3 0It is well known that in the pharmaceutical industry very few of patents granted will become commercialized
innovative e¤ort made by …rms and a weak share of their revenue. This paper deals therefore exclusively with pharmaceutical …rms who extract their revenues from the commercialization of drugs because it is assumed to be the core of innovative activity in pharmaceuticals. We build …rms’ total patents portfolio weighted by their citation intensities, in addition to the explaining variable of total patents counts. Stocks of R&D, non-weighted and weighted patents are built following the perpetual inventory method using a 15% depreciation/obsolescence rate as traditionally used in the literature.31
We address the problem of truncation related to patents and citations by implementing the methodology proposed by Hall et al. (2001). There is an important lag between patent applications and patent grants (in average about two years) so we observe only a small fraction of the patents applied which eventually will be granted as we approach the last year of patent data. Patent counts should then be corrected using weighting factors according to the estimated application-grant empirical distribution (ibid).32 Similarly, to deal with the problem of truncated citations,
Hall et al. (2001) propose to estimate the shape of the citation-lag distribution, i.e. the fraction of lifetime citations (de…ned as the 30 years after the grant date) that are received in each year after the patent grant. Accordingly, the total citations for any patent (for which we observe a portion of its citation life) is estimated by dividing the observed citations by the fraction of the population distribution that lies in the time interval for which citations are observed. It is assumed that this distribution is stationary and independent of overall citation intensity. Although the normalization of citations reduces the striking contracting tendency at the end of the period, it does not eliminate the problem completely. Because our empirical study focuses on the period 1975-1991, it minimizes such a bias. The main reason of the shortening of our panel to 1975-1991 is however that it limits the problems inherent to the wave of mergers and acquisition (M&A) that characterized the pharmaceutical industry in the mid-nineties. This restructuring of the sector is indeed assumed to introduce a bias in the observation of innovative activities –at the …rm level– since the acquisition of knowledge cannot be taken into account.
3 1See Griliches (1989), Hall & Mairesse (1995).
3 2We use patent data from 1975, patent stocks are built for those …rms patenting before this year. Therefore we
do not need to adjust the patent counts for application lags but we will have to adjuste the patent counts for the last periods. Patent counts beyond 1993 (since only about half the patents applied for in 1994 are observed due to grand lags).
3.1
Distinguishing Innovations from Patents and Citations
Originality Index
In order to distinguish patents in terms of technological speci…city, we use a citation-based measure suggested in Henderson, Ja¤e and Trajtenberg (1998) and Hall et al. (2002). Innovation Originality captures the extent to which a patent cites a wide range of technological classes or if its technological basis is rather concentrated on few technological areas. The measure of Originality is a Her…ndahl concentration index such as:
Originality = 1 Ni X k=1 N citedi;k N citedi 2 (1) where k is the index of patent classes and Niis the number of di¤erent classes to which the cited
patents belong.
Hence if a new patent cites patents that belong to a narrow set of technologies (UPSTO patent classes), the originality score will be low, whereas if it cites patents in a wide range of …elds would render a high score (notice that 0 Originality 1 and that higher values represent less concentration and hence more Originality). It thus measures how the innovator’s R&D is diversi…ed or specialized. As shown by Cockburn & Henderson (1998) and Henderson & Cockburn (1996), pharmaceutical …rms which are more technologically diversi…ed have been found to enjoy a stronger R&D productivity thanks to economies of scope.
3.1.1 Citations Adjusted Patents
As a measure of innovations’ technological "quality" or signi…cance, we weight the …rms’ yearly patent count by the number of forward citations it generates the following years.33 Such a measure
exhibits the impact a patent portfolio, and consequently a …rm in a given year, will exerts on the technological dynamics. Indeed, the number of citations received show the level of in‡uence that an innovation exerts on further innovations and consequently its technological importance. The
3 3It is important to note that the complete listing of backward citations is made by the patent examiners and not
variable Citations Adjusted Patent (CA) shows the (yearly average)34 number of citations received
per the patents of the …rm which are granted this year. It represents one of our proxy for the …rms’ innovative activity. Such a variable increases with the number of forward citations and decreases with the number of patents granted this year by the …rms. As a consequence, the larger the number of citations a patent portfolio has received, the greater its "quality" or "in‡uence". However such a measure take into account only one dimension of innovation, the technological impact, and does not consider its cumulative aspect. To track the pioneering behavior this measure is consequently not completely satisfactory insofar as it does not refer to the citations made (which can proxy for the degree of novelty) but only on the citations received (which proxy for the technological importance).
Leader and Follower Patents
We consider a patent represents a pioneering discovery if it satis…es two criteria: …rst the inno-vation must be non cumulative, second it must be technologically in‡uent. As a consequence a pioneering innovation must be both new and in‡uent. Hence we separate patents in two categories which denote both their technological novelty and their importance. Compared with the simple patent weighting by citations received, this patent distinction considers both forward and backward citations. A patent is Leader if its forward citations exceeds the yearly industry median35 whereas
its backward citations remains inferior to the yearly industry median (considering the citations yearly observed in the patent classes 424 and 514).36 As a consequence a Leader patent is de…ned
relatively to the other patents granted the same year (see Figure 3 in annex).
Such patents exhibit, in comparison to the median, of a greater in‡uence on the technological path design and of a lower dependence on existing technologies. Leader patents are consequently those which, technologically, lead the technological change, thanks to a relatively strong creativity
3 4Because our data are yearly aggregated at the …rms level, the weighted patent count is represented by the ratio
of yearly citations received by the number of patents granted.
3 5It would be possible to use the mean instead of the median since there is no sensible di¤erences between the
two type of calculations. Results do not change according to the type of calculation used.
3 6Forward and backward citations included in this mark cover the period 1963-2000; as a consequence we consider
all citations received up to 2000 whatever the granting date. As our study only cover the period 1975-91, patents granted in 1991 can receive citation up to year 2000. In addition, as mentioned previously, recall patent citations used in all the study have been normalized following the methodology proposed by Hall et al. (2001).
which is widely di¤used in the industry. Follower patents as the remaining patents of the sample so that they represent all patents which are not considered as pioneers (Leader+F ollower = T otal of patents). Follower patents are those which have received at most as many citations as the yearly industry median and which have made at least as many citations as the yearly industry median (see extension for the results of estimations on Follower patenting which are not presented here). To our knowledge, there is no empirical works have di¤erentiated the inventions like this. Duguet (2002), for example, distinguishes incremental and radical innovations on the basis of the …rms’ claims in a innovation survey which do not constitute an homogeneous technological viewpoint.
For the full period (before having shortened the panel to 1975-91) we have the following trends in the granting of Leader and Follower patents:
Figure 1 0 5 00 10 00 15 00 N u m ber of Lea de r an d F ollow er P a tent s 1975 1980 1985 1990 1995 2000 Grant Year Leader Follower
(U.S Patent Class 424 & 514)
Leader and Follower Patents in the Drug Industry
Source: own calculations from NBER Patent Data File
The number of Follower patents apparently increases over the time whereas the number of Leader patents granted shows a slower and contracting movement along the period. The propensity to grant pioneering discoveries decreases over the time, especially since the mid eighties (the Hatch Waxman Act was enacted in 1984). The ratio of these two indicators (see appendix) con…rms
a relative decline in the Leader patenting compared to the Follower patenting. In fact, fewer and fewer patents propose radical technological change which assumes improvement strategies characterize the period considered probably as a response to the new competition impulsed by biotech …rms. It could imply a greater use of internal knowledge if …rms seek to stand on their previous inventions to introduce new products. Yet …rms can also improve technologies that are not their own discoveries.
Internalized Spillovers
When a patent stands on the patented …rm’s previous innovations, it indicates a process of inter-nalized spillover that can be evaluated through the number of self-citations that are made (the extent to which a patent cites the previous patents granted by the …rm).37 According to Hall &
al. (2001) an interesting issue is that "presumably citations to patents that belong to the same assignee represent transfers of knowledge that are mostly internalized, whereas citations to patents of ‘others’ are closer to the pure notion of (di¤used) spillovers." In other words, few citations to rival …rms, or others entities, would mean that the …rm does not rely on external spillovers as much as it relies on internal knowledge. The …gure in the appendix shows that the use of self citations increases dramatically over the period. Hence the …rms of our sample apparently rely more and more on their previous inventions to innovate. Such a trend highlights the increasing di¢ culties to innovate radically over the time i.e. to create new knowledge. Empirically these observations coincide with the introduction of the Hatch-Waxman Act (enacted in 1984)38 which
provides incentives to support the development of generic versions of o¤-patent drugs and permit patent owners to recover time lost during FDA approval. As shown by the …gures 1 and 2, it is possible to hypothesize that the pharmaceutical …rms seek to retain their sales through prod-uct development strategies in order to face the pressure exerted by generics. More generally our
3 7The percentage of self-citations is computed as in Hall et al. (2001): for each patent that has an assignee code
we count the number of citations that it made to (previous) patents that have the same assignee code, and we divide the count by the total number of citations that it made.
3 8Since the law’s passage, the generic industry’s share of the prescription drug market has jumped from less than
20 % to almost 50 % today. The economic realities of non-innovator commodity production allow generics to enter the market at a signi…cant discount, and for prices to decrease with increased generic entry. Before the 1984 law, it took 3-5 years for a generic copy to enter the market after the expiration of an innovator’s patent. Today, generic copies often come to market as soon as the patent on an innovator product expires. Prior to the Hatch-Waxman Act, only 35 percent of top-selling innovator medicines had generic competition after their patents expired. Today, almost all innovator medicines face such competition (see Phr MA (2002)).
data con…rm previous empirical …ndings relating a decrease of inventiveness in pharmaceuticals: fewer and fewer pioneering inventions are discovered leading to an erosion of the number of new (technological) promising compounds invented.
In the pharmaceutical industry our proxies of innovation based on citations criteria (Leader, Follower, Citations Adjusted patenting) allow us to measure the propensity to improve already existing solution rather than to create technological breakthroughs. They are thus means to put into evidence the kind of strategy of research led by the current pharmaceutical …rms and how the past innovative activity of these …rms may in‡uence their present innovative behaviors. Several patent stocks are therefore built for further employment in the knowledge production functions for each …rm.
3.2
An Innovation Equation
Propensity to Innovate: Distinguishing the Nature of Innovations
A key focus of interest in this paper is the estimation of an innovation equation Iitwhere I denotes
either the Non Adjusted patent count, the Citations Adjusted patent count or the Leader patent count which are described above. Following Hausman et al. (1984) and Blundell et al. (1999), for a latent variable of innovation Iit; we consider the knowledge production function:39
Iit= f (xit; i) (2)
where xit is a vector of …rm i characteristics (e.g. past R&D investments) and unobservable
invariant …rm-speci…c factors are represented by the term i. It represents permanent unobservable di¤erences across …rms a¤ecting the production of innovation …rms (appropriability conditions, marketing strategy or …nancial characteristics). This relationship is derived as the outcome of a …rm’s optimal search rule for innovation (Blundell et al. (1995), Reinganum, 1989) where the search process is assumed to generate innovations in future periods. Iit represents the several
patent-based proxies for innovations made by the …rm i at time t described previously. Because
3 9See also Hausman et al. (1984); Winkelmann & Wimmermann (1992); Crepon & Duguet, (1997); Blundell et
the number of patents is a non-negative integer, we adopt count data regressions as described by Hausman et al. (1984) and Blundell et al. (1999). We model the conditional mean as a multiplicative or log link function of explanatory factors as:
Iit = exp(x0it + i) + "it (3)
= itvi+ "it; f or i = 1; :::; N and t = 1; :::; T
where it= exp(xit ); v
i = exp( i) and " is a disturbance term with expected value 0. xitis a vector
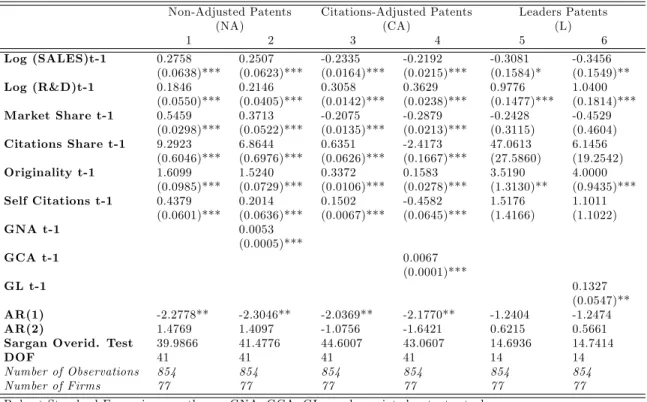
of observed explanatory variables, and is the corresponding vector of parameters to be estimated including lagged values of …rms’ market share, R&D expenditures and stock of knowledge, etc. The full empirical model is de…ned as:
Iit = exp( 1log(Sales)it 1+ 2log(R&D)it 1+ 3M Sit 1
+ 4CSit 1+ 5Originalityit 1+ 6Selfit 1+ 7GIit 1+ i) + "it (4)
f or i = 1; :::; 77andt = 1; :::; T ;where Iit= fNAit; CAit; Litg
In this speci…cation, …rms’ innovation propensity is conditional on previous market power, measured by the lagged value of total sales log(Sales)it 1; R&D e¤ort log(R&D)it 1; market-share
M Sit 1, Citations Share CSit 1; Originality index Originalityit 1 (calculated according to the
fromula (1)) and internal spillover (Self-Citation propensity) Selfit 1. Considering the dynamics
of innovation, we then introduce the lagged knowledge stock variables GN A; CA; L; t 1 (where
subscripts N A refer to Non Adjusted patent stock GN A; t 1; CA to Citations Adjusted patent
stock GCA; t 1; and L to Leader patents stock GL; t 1) into the knowledge production function
(see Blundell et al. 1999 for a comparable speci…cation). All stocks are calculated following the perpetual inventory methods proposed by Hall et al. (2005).
The expected e¤ects of market share and total sales on innovation propensity are ambiguous. Strategic considerations imply that the marginal bene…t of an innovation (an additional increment to the …rm’s innovation stock, Gi;t) may be more valuable to a market leader than to a follower
dominant …rms may be more reluctant to innovate as they …nd it more pro…table to exploit existing innovations.40 This case thus illustrates the Reiganum’s "cannibalization" model (1989)
or "displacement e¤ ect". The self citations show how the …rm relies on the previous inventions it made to generate NCE. On the one hand, it is expected that it in‡uences positively on the Non Adjusted patenting because of the product development strategies described previously, and negatively for the Leader patenting if we hypothesis that self citations exhibit the cumulative nature of innovation within …rms. On the other hand, the internal spillover e¤ects may also help to generate high quality innovations because they represent a technological advantage as the …rm exploits its knowledge to invent. If we hypothesis that pioneering discoveries follow a multi stage process of invention requiring several knowledge, self citations may have a positive in‡uence. As a result of these two possible impacts, the potential e¤ect of internalized spillover (i.e. self citations) on the …rms’innovation propensity and persistence in innovating is undetermined.
Individual knowledge stock variables are obtained by accumulating past patents granted: Gi;t=
Ii;t+ (1 + Gi;t 1). The stock of knowledge increases continuously by the addition of new patents,
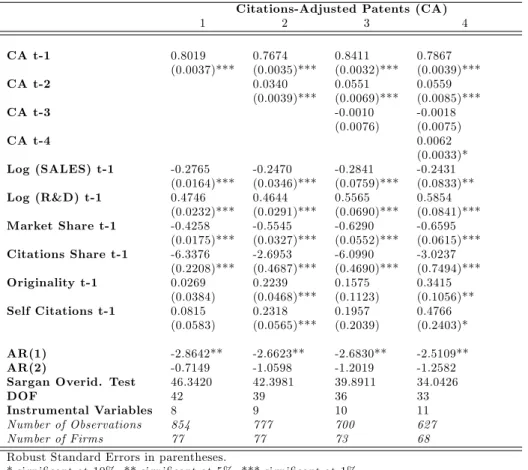
but it also continuously decreases at the constant depreciation/obsolescence, rate (15%).41 Knowledge-stocks should exert a positive e¤ect on the propensity of the …rm to innovate as there are dynamic returns in the production of innovation. Cumulated technological experience facili-tates in some way current R&D productivity: R&D economies of scale (see Teece, 1980; Cohen & Levin, 1989; Chandler, 1990), learning-by-doing, and learning-by-learning e¤ects (see Rosenberg, 1987 and Cohen & Klepper, 1996). Concerning dynamics of innovation it is expected to …nd higher persistence in low quality patenting for …rms that use patent as a strategic variable to preserve market power, whereas highest quality (i.e. Leader ) patenting should be less persistent over the time since it requires –presumably– large R&D spending and may need developments to be com-mercialized. Concerning the Citations Adjusted patenting the expected e¤ect of lagged patenting is more ambiguous because it capture two dimensions: that one of the number of patent granted ( ) and that one of the number of citations received (+). We also include two additional lagged
4 0They may also rely on alternative strategies to keep market power as presented earlier (technological
foreclu-sion...).
4 1Initial values of G
i;tcorrespond to the pre-sample stock of patents for …rms patenting before 1975, otherwhise
patent’ stocks for …rms appearing after 1975 are calculated according to the perpetual inventory method following Griliches (1989) or Hall & Mairesse (1995).
terms referring to the …rms’ innovation degree of Originality and the …rms’ citations (received) share. They constitute the yearly mean value of …rms’patent portfolio. The …rms’citation share represents the share the …rm own in the industry total forward citations (i.e. the sum of citations received) by patents granted in classes 424 and 514. It thus measures the degree of technologi-cal leadership. If technology-leaders have stronger incentives to remain in the innovation race, it should enter positively for the …rms’innovation propensity as mentioned in Segestrom & Woniereck (1999) then Hörner (2001). Nonetheless, its impact must di¤er a priori according to the quality level of patenting (see Henderson, 1993).42
Estimation Method for a Linear Feedback Model (LFM)
An important feature of our study is the estimation of a dynamic model (i.e. including linear feedback) to assess the persistence with which …rms innovate. Given the panel dynamic speci-…cation of the model, several practical problems have to be handled: …rst, the autocorrelation problems imposed by the lagged variables. These lagged variables are by nature dependent on past disturbances, which makes them predetermined variables in the equation. Second, we have to deal with the time series cross-section nature of data and account for the presence and features of the unobserved components of residuals (i.e. non-observed heterogeneity). Third, the appropriate lag length of the auto regressive-distributed lag model have to be determined.
A series of strong assumptions must be respected in order to apply traditional OLS or panel data estimators. Including the lagged dependent variable as one of the regressors makes pooled OLS as well as classic error component estimators obsolete. Poisson or Negative Binomial models, because they assume that the regressors are strictly exogenous, cannot be used as mentioned by Montalvo (1997) and Blundell et al. (2000). The count panel data literature has largely focused on estimating models for patenting and the returns to R&D investments. A seminal paper of Hausman et al. (1984) initiated a growing literature estimating patent and innovation production functions using the Generalized Method of Moments (GMM) estimator allowing for correlated …rm speci…c
4 2Likewise, a weak citation-share indicates that other …rms or competitors own a larger part of the new technology.
Hence competitive spillovers may have a negative rivalry e¤ect on a …rms’ likelihood to apply for a patent : the more competitors invet in R&D, the less a …rm is likely to invent a new technology (see Loury (1979), Lee and Wilde (1982)).
e¤ects and weakly exogenous inputs.43 It involves estimation of a dependent variable as a function
of its lagged value and other endogenous, pre-determined and exogenous variables in the presence of unobserved heterogeneity. The model is estimated in two stages using the residual of the …rst stage to compute an optimal weighting matrix, which is subsequently used in the second stage. As we analyze the e¤ects of lagged innovation ‡ows on the current propensity to innovate, we employ the nonlinear GMM method discussed and implemented by Windmeijer (2002) –ExpEnd – and used in similar conditions by Kim & Marschke (2005) then Salomon & Shaver (2005).44
The conditional mean in the LFM is de…ned as:
E(Iit j Iit 1; xit; vi) = Iit 1+ exp(x 0
it )vi (5)
Iit 1+ itvi
We implement the Arellano and Bond test for …rst and second order serial autocorrelation of residuals (AR(1); AR(2)) in the di¤erenced error terms to test the validity of the set of instruments (reported at the bottom of each table). If it is not serially correlated, the di¤erence residuals should be characterized by negative …rst-order serial correlation and the absence of second-order serial correlation (which is the case for all our equations). Then, the Hansen test (–two steps– SYS-GMM) of over-identifying restrictions is applied: it tests for correlation between the instruments that are excluded from the second stage model and the residuals. It conducts a test for the null hypothesis that the remaining theoretical orthogonality restrictions are equal to zero (see Hansen, 1982 and Sargan, 1985). Failure to reject the null hypothesis indicates that the instruments are valid, and then supports the validity of the model speci…cation (which is the case for all our equations).
4 3See the development of the quasi-di¤erencing approach of Chamberlain (1992) and Wooldridge (1991, 1997) by
Montalvo (1997), Cinera (1997), Crépon and Duguet (1997), Blundell et al. (1999) and Blundell et al. (2002).
4 4The di¤erent parameterization between the multiplicative feedback model (MFM) and the liner feedback model
(LFM) (Blundell et al. (1999), Cincera (1998)) implies that, in comparison to the LFM, the coe¢ cients E(Iit)
in the MFM measures the short run impact of a change in Xit. As explained by Blundell et al (1999), in the
MFM the nonlinear dynamic makes it di¢ ccult to judge the stability properties of the model and the potentially important feedback parameter is sensititive to large innovation counts. In a similar study, Blundell et al. (1999) implement both speci…cations and both models are found to yield similar estimates for the main parameters of interest. Although a non-nested comparison has suggested a preference for the LFM speci…ciation.
The full dynamic model is de…ned as:
Iit = exp( 1Iit 1+ 2Iit 2+ 3Iit 3+ 4Iit 4
+ 5log(Sales)it 1+ 6log(R&D)it 1+ 7M Sit 1 (6)
+ 8CSit 1+ 9Originalityit 1+ 10Selfit 1+ i) + "it
f or i = 1; :::; 77and t = 1; :::; T ;whereIit= fNAit; CAit; Litg
where Iit n denote the feedbacks (I = N A; CA; L and n = 1:::4) successively included in the
equation.
4
Empirical Results
Table 1 presents summary statistics describing the data. Averaging across all …rms and years, our sample spent on average $283 in R&D and has average sales of $2,786 (thousand $US 1994) whereas the average market share (the share of the …rm in the whole sector’s sales reported by Compustat) is 0.5% with a rather large standard error (0.9). When looking at the innovations made by …rms, expected values are found since the yearly Non Adjusted patenting is widely stronger than the Leader patenting (on average for 10 patents applied only one is a Leader ). Our …rms grant in average 25 patents over the period with (approximately) 3 Leader and 22 Follower patents (recall we take only account for patents granted in classes 424 & 514). On average our …rms receive 6 citations per patent and the ratio of total citations received by each patent stock is almost 23 (versus a maximum of 135). Patent stocks appear very heterogeneous: 25.4 in average but 536.5 in max (recall patent stocks are continuously depreciated over the time and consequently values are not integer). This …rst exploration of the data thus …rst indicates that they are relatively few innovations made in volume compared with Non Adjusted patenting.