Publisher’s version / Version de l'éditeur:
The Journal of Physical Chemistry Letters, 9, 18, pp. 5288-5295, 2018-08-31
READ THESE TERMS AND CONDITIONS CAREFULLY BEFORE USING THIS WEBSITE.
https://nrc-publications.canada.ca/eng/copyright
Vous avez des questions? Nous pouvons vous aider. Pour communiquer directement avec un auteur, consultez la
première page de la revue dans laquelle son article a été publié afin de trouver ses coordonnées. Si vous n’arrivez pas à les repérer, communiquez avec nous à [email protected].
Questions? Contact the NRC Publications Archive team at
[email protected]. If you wish to email the authors directly, please see the first page of the publication for their contact information.
NRC Publications Archive
Archives des publications du CNRC
This publication could be one of several versions: author’s original, accepted manuscript or the publisher’s version. / La version de cette publication peut être l’une des suivantes : la version prépublication de l’auteur, la version acceptée du manuscrit ou la version de l’éditeur.
For the publisher’s version, please access the DOI link below./ Pour consulter la version de l’éditeur, utilisez le lien DOI ci-dessous.
https://doi.org/10.1021/acs.jpclett.8b02334
Access and use of this website and the material on it are subject to the Terms and Conditions set forth at
Evolution of two types of CdTe magic-size clusters from a single
induction period sample
Luan, Chaoran; Gökçinar, Ömür Ö; Rowell, Nelson; Kreouzis, Theo; Han,
Shuo; Zhang, Meng; Fan, Hongsong; Yu, Kui
https://publications-cnrc.canada.ca/fra/droits
L’accès à ce site Web et l’utilisation de son contenu sont assujettis aux conditions présentées dans le site LISEZ CES CONDITIONS ATTENTIVEMENT AVANT D’UTILISER CE SITE WEB.
NRC Publications Record / Notice d'Archives des publications de CNRC:
https://nrc-publications.canada.ca/eng/view/object/?id=0c31ebeb-a599-4153-8458-2754918c580e https://publications-cnrc.canada.ca/fra/voir/objet/?id=0c31ebeb-a599-4153-8458-2754918c580eEvolution of Two Types of CdTe Magic-Size Clusters from a Single
Induction Period Sample
Chaoran Luan,
†Ömür Ö Gökçinar,
†Nelson Rowell,
‡Theo Kreouzis,
∥Shuo Han,
§Meng Zhang,
§Hongsong Fan,
*
,†and Kui Yu
*
,†,§†
Engineering Research Center in Biomaterials, Sichuan University, Chengdu 610065, P. R. China
‡
National Research Council Canada, Ottawa, Ontario K1A 0R6, Canada
∥
School of Physics and Astronomy, Queen Mary University of London, London E14NS, U.K.
§
Institute of Atomic and Molecular Physics, Sichuan University, Chengdu 610065, P. R. China
*
S Supporting InformationABSTRACT: There are two types of colloidal semiconductor nanocrystals (NCs) that exhibit band gap absorption that is relatively sharp compared to conventional quantum dots (QDs). One type displays an absorption doublet, while the other displays an absorption singlet. Here, we report the evolution of the two types of NCs at room temperature from a single CdTe sample extracted during the induction period (IP) prior to nucleation and growth of conventional QDs. The resulting NCs exhibit band gap absorption peaking at ∼371 nm and are magic-size clusters (MSCs), labeled as dMSC-371 and sMSC-371 for the doublet and singlet cases, respectively. We demonstrate that dMSC-371 (with another peak at ∼350 nm) evolves when the sample is incubated. When the sample is dispersed without incubation into a toluene and octylamine mixture, dMSC-371 or sMSC-dMSC-371 grows depending on the amine amount. We propose that dMSC-dMSC-371 and sMSC-371 are a pair of polymorphs (with identical CdTe core compositions). The present study brings insight into the formation relationship between dMSCs and sMSCs.
T
here have been a number of studies regarding a special type of colloidal semiconductor nanocrystals (NCs) exhibiting relatively sharp absorption doublets, in contrast to the broader absorption features of conventional quantum dots (QDs).1−12For CdTe, the doublets occur at about 353/373,2 386/427, 448/500, 494/554, and 551/598 nm.3,4 For CdSe, the doublet peaks are approximately at 370/393, 432/463, 479/513, and 518/550 nm.1,3,5−9Two-dimensional (2D) NCs with quantum confinement in the third dimension have been reported to exhibit such absorption doublets.1−3,5,6,8,9 Mean-while, it has been demonstrated that zero-dimensional (0D) NCs with three-dimensional quantum confinement have similar static optical properties and that they readily self-assemble into the 2D NCs.1,4,7Another class of colloidal 0D NCs that display sharp absorption singlets, relative to conventional QDs, has also been reported. The term magic-size clusters (MSCs) has been used to describe these 0D NCs.10−24MSCs have been recognized to differ significantly in many respects from conventional QDs, which are often referred to as regular QDs (RQDs) for differentiation. For samples extracted from a single reaction batch, MSCs are characterized by a constant and persistent absorption peak position, while the peak position for RQDs keep red shifting as they grow in size.
Recently, we developed a selective two-step approach that enables the production of single-ensemble MSCs without the complication of the presence of RQDs.12−18In the first step,
an induction period (IP) sample is obtained, which is transparent in optical absorption. In the second step, MSCs are formed from the first-step sample at relatively low temperatures, such as room temperature, either by incubation or by dispersion in a solvent. This two-step approach has been demonstrated to be effective for CdS 311 and MSC-322,12−14 CdSe MSC-415,15 CdTe MSC-371,16 and ZnSe MSC-299.18The MSCs are referenced by the wavelength in nanometers of their absorption peak positions.
Intriguingly, the term MSCs has been also used for those NCs exhibiting sharp absorption doublets, such as for ZnSe at ∼279/289 and ∼328/347 nm,2,19,25,26 CdSe at ∼335/350 nm,2,27−29and CdTe at ∼353/373 nm.2The very existence of the two types of MSCs exhibiting sharp absorption doublets and singlets is certainly an added curiosity. Their formation may be related to each other. However, there has been no study addressing this possibility. For clarity and simplicity in further discussion, we will refer to these NCs as dMSCs and sMSCs, respectively. By the way, CdS MSC-311 and CdS MSC-322 are reported to evolve from a single CdS IP sample and are claimed to be a pair of isomers.12,17Polymorphism in gold MSCs with different surface ligands and isomerization in gold nanoparticles have been identified also.30,31
Received: July 29, 2018 Accepted: August 25, 2018 Published: August 31, 2018
pubs.acs.org/JPCL
Cite This:J. Phys. Chem. Lett. 2018, 9, 5288−5295
Here, we report, for the first time, the evolution of CdTe dMSCs and sMSCs at room temperature from a single sample extracted in the IP of RQDs via the two-step synthetic method that we have developed.12−18The resulting NCs are referred to as dMSC-371 and sMSC-371, based on their approximate absorption peak positions of 350/371 and 371 nm, respectively. As shown inScheme 1, the first step is controlled to be within the IP prior to nucleation and growth of CdTe RQDs, with a temperature of about 140 °C for the reaction of Cd(OAc)2/OLA (made from cadmium acetate (Cd(OAc)2) and oleylamine (OLA)) and TeTOP (tri-n-octylphosphine telluride). The first-step reaction conditions used are the same for Figures 1−4, except for the reaction temperatures and periods, which are summarized inTable S1. The second step is carried out at room temperature to enable the formation of dMSC-371 and/or sMSC-371 from the IP sample, which is transparent in optical absorption in toluene (Tol). When the IP sample is incubated at room temperature, dMSC-371 evolves (Figure 1). When the sample (without incubation) is dispersed in a mixture of Tol and octylamine (OTA, about 17% by volume), sMSC-371 develops (Figure 2). When an incubated sample is dispersed in the same Tol and OTA mixture, the amount of sMSC-371 evolved is regulated by the duration of the incubation (Figure 3). The evolution of dMSC-371 follows first-order reaction kinetics (Figure 4), after the sample (without incubation) is dispersed in a mixture of Tol and OTA (about 1.7% by volume) for a certain period of time. For the kinetics behavior, we propose the existence of an isomerization process, similar to the formation of CdS MSC-311 from its immediate precursor (CdS IP-MSC-311).12−14 Moreover, we hypothesize that dMSC-371 and sMSC-371 form a pair of polymorphs, with identical CdTe core compositions (but different surface ligands). The present study demonstrates, for the first time, that the two different
types of 0D NCs, which exhibit one sharp absorption doublet or singlet, can evolve at room temperature from a single IP sample (with the same pool of compounds produced). The present result indicates the necessity for further experimental and theoretical efforts to understand the structure−property relationship of these two types of MSCs.1−9,12−29
Figure 1 shows the optical absorption spectra of the IP samples extracted from the reaction of Cd(OAc)2/OLA and TeTOP. Similar reactions (for CdSe,15CdTe,16and ZnSe18) have been demonstrated elsewhere. The spectra were collected right after the dispersions of the samples (30 μL each) were prepared in 3.0 mL of Tol. The 120 °C sample (Figure 1a) did not display any dMSC-371 absorption doublet feature, even after eight-hour incubation at room temperature. Thus, the reaction temperature of 120 °C (under our experimental conditions) did not seem to be high enough to produce the very special precursor compounds (labeled as PCs) that are able to transform to MSCs in the subsequent second step. Similar to the 120 °C sample, the 140 °C samples without incubation (Figure 1b−d, gray traces) exhibited featureless absorption, suggesting that the reaction products are trans-parent in optical absorption in Tol. After incubation at room temperature, in contrast to the 120 °C sample, the 140 °C samples displayed varying amounts of dMSC-371 as indicated by the presence of the characteristic absorption doublet (blue and red traces for 2 and 8 h incubation, respectively). The immediately dispersed samples (0 h, without incubation) were from one reaction batch, while the 2 and 8 h incubation samples were from another.
The larger the magnitude of the absorption doublet observed, the greater the amount of dMSC-371 evolved. Apparently, the amount of dMSC-371 increased with the progress of the first-step reaction at 140 °C (such as the red spectra fromFigure 1b to d) and the second-step incubation at Scheme 1. Schematic Drawing Regarding the Formation of dMSC-371 (top) and sMSC-371 (bottom) at Room Temperature from a Single Samplea
aThe single sample was preheated in the induction period (IP) at 140 °C prior to nucleation and growth of RQDs. dMSC-371 and sMSC-371
exhibit one sharp absorption doublet and singlet, respectively; these energies at ∼371 nm correspond to the lowest energy (1S(e)−1S3/2(h)) of
allowed electronic transitions. Evidently, sMSC-371 can contribute to the absorption spectrum of an incubated sample in the Tol (83%)−OTA (17%) mixture.
The Journal of Physical Chemistry Letters Letter
DOI:10.1021/acs.jpclett.8b02334
J. Phys. Chem. Lett. 2018, 9, 5288−5295
room temperature (such as from the gray to red spectra in
Figure 1b−d). The scattering tails of the samples seemed to increase upon incubation (from blue to red traces), with the decrease from samples b to d. During incubation, the transparency of the samples decreased. The lowest energy peak positions for dMSC-371 are indicated, which appear to be slightly different from the nominal peak position of 371 nm. It is known that absorption peak positions monitored are somewhat affected by experimental conditions including the nature of the dispersion used.15,20,32−35
Increasing the reaction temperature of the first step to 160 °C essentially put an end to the IP, whereupon nucleation and growth of RQDs took place.Figure S1 shows the absorption spectra of three 160 °C samples with growth periods of 0, 10, and 20 min and incubation periods of 2 (blue traces) and 8 h (red traces) at room temperature. The broad absorption peaks suggest the presence of RQDs, which grew in size exhibiting absorption peaking at 550, 580, and 590 nm, respectively. Close examination indicates the presence of a small amount of dMSC-371 for the 160 °C/0 min sample after an 8-h incubation, while no noticeable amount of dMSC-371 was detected for the remaining two samples. The presence of a small amount of dMSC-371 indicates the existence of a low concentration of the precursor compound in the 160 °C/0 min sample; the precursor compound is defined as that needed for the formation of dMSC-371 (after the room temperature incubation). For the 10 and 20 min samples, the growth of RQDs caused an almost complete disappearance of the
precursor compound, and thus no dMSC-371 was seen (after incubation). Evidently, when the reaction temperature of the first step was increased to 160 °C, the precursor compound was suppressed; such depletion is attributed to the fragmentation of the precursor compound resulting in the nucleation and growth of RQDs, as reported in the literature.13
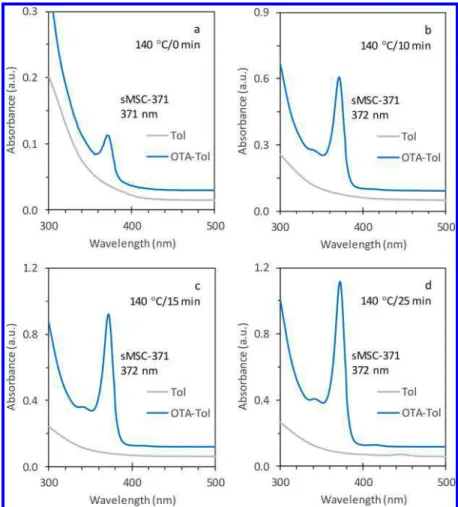
Figure 2illustrates the evolution of sMSC-371 from four IP samples extracted from a separate reaction batch. These samples experienced the reaction phase at 140 °C for periods of 0 (a), 10 (b), 15 (c), and 25 min (d). For the optical absorption spectra collected, an aliquot (30 μL) of each sample was immediately dispersed, without incubation, into 3.0 mL of Tol (gray traces) or into a mixture of 2.5 mL of Tol and 0.5 mL of OTA (blue traces). The use of primary but not secondary or tertiary amines to promote the evolution of MSCs has been reported in the literature.15,16,18 The Tol dispersions exhibited no absorption peaks, while the Tol− OTA dispersions displayed a characteristic absorption singlet peaking at approximately 372 nm, indicating the presence of sMSC-371. At the same time, a shoulder associated with its secondary transition peaking at ∼340 nm is detected, as shown inFigure 2b−d (blue traces) but not inFigure 2a (blue trace). A large increase in optical density (OD) at 372 nm was observed, as shown by the blue traces from 0.07 (Figure 2a) to 0.96 (Figure 2d) (with the subtraction of the background absorbance at 390 nm). As the reaction (at 140 °C) progressed to 35 min, RQDs developed as shown byFigure S2a.Figure S2bsummarizes the OD values of sMSC-371 monitored for Figure 1.Optical absorption spectra collected from four IP samples (30 μL each in 3.0 mL of Tol). The growth temperatures and periods are indicated as (a) 120 °C/15 min, (b) 140 °C/0 min, (c) 140 °C/5 min, and (d) 140 °C/15 min. The samples were extracted from two identical synthetic batches and incubated at room temperature (25 °C) for 0 (gray traces), 2 (blue traces), and 8 (red traces) hours as indicated. The spectra have been offset vertically for clarity.
the five 140 °C samples. In particular, the OD value of sMSC-371 decreased from 0.96 to 0.68, for the 25 to 35 min samples. The nucleation and growth of RQDs apparently resulted in the decrease of the sMSC-371 population. Again, the population decrease can be attributed to the depletion of the precursor compound, which is defined here as the material needed for the formation of sMSC-371 in dispersion. The depletion of the precursor compound is due to the nucleation and growth of RQDs via the precursor compound to fragment to RQD pathway.13
Based on our experimental observations shown byFigures 1
and 2, it is reasonable to hypothesize that the precursor compounds aforementioned are the same; they are produced in the IP of CdTe RQDs synthesis from the Cd(OAc)2/OLA and TeTOP reaction and result in the formation of dMSC-371 and sMSC-371. To investigate this hypothesis, we further explore the quantitative correlation between dMSC-371 and sMSC-371 through optical absorption spectroscopy.
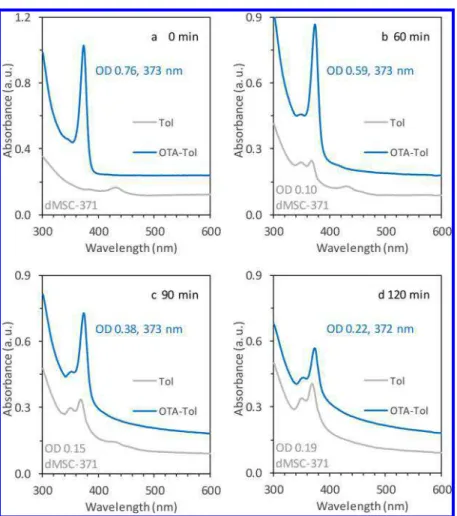
Figure 3 displays the spectra obtained from a sample extracted in the IP (130 °C/20 min), which was further divided into four portions for room temperature incubation for a variable duration of 0 (a), 60 (b), 90 (c) and 120 min (d). An aliquot (30 μL) of each portion was then dispersed in 3.0 mL of Tol (gray traces) and in a mixture of 2.5 mL of Tol and 0.5 mL of OTA (blue traces). In the absence of incubation (Figure 3a), no dMSC-371 was observed in Tol, while sMSC-371 was seen for the Tol and OTA mixture (displaying the
characteristic absorption singlet peaking at 373 nm with OD = 0.76).
As the incubation period was increased from 60 min (Figure 3b) to 120 min (Figure 3d), the Tol dispersions featured the characteristic absorption doublet peaking at ∼350/365 nm with OD increase at 365 nm from 0.10 to 0.19. Thus, an evolution of dMSC-371 has apparently been detected, together with a population increase. For the corresponding Tol−OTA dispersion, we see that both dMSC-371 and sMSC-371 contribute to the spectra, with the increase of the doublet nature from the former and the decrease of the singlet nature from the latter. The OD values at 373 nm were estimated to be 0.59 (b), 0.38 (c), and 0.22 (d).
Along with the progress of the incubation (fromFigure 3b− d), the OD at 365 nm increased for the Tol dispersions, while that at ∼373 nm decreased for the corresponding Tol−OTA dispersions. Interestingly, the two spectra shown inFigure 3d are quite similar, both in absorption positions and magnitudes. The similarity is in agreement with our understanding that during the incubation, a majority of the precursor compound transformed into dMSC-371, which contributed mainly to the gray and blue traces. For the latter, sMSC-371 might contribute somewhat, due to leftover precursor compound (after the incubation and prior to dispersion). When a sample was incubated long enough (such as for 8 h) and was dispersed in Tol and in the Tol and OTA mixture, the resulting spectra (Figure S3-1) are very much alike.
Figure 2.Evolution of sMSC-371 from four samples extracted from a single synthetic batch, which underwent growth periods of 0 (a), 10 (b), 15 (c), and 25 min (d) at 140 °C. Each of the four samples (30 μL) appeared to be transparent in 3.0 mL of Tol (gray traces), as monitored by optical absorption spectroscopy. sMSC-371 evolved when the four samples (30 μL each) were dispersed in a mixture of 2.5 mL of Tol and 0.5 mL of OTA (blue traces); the amount of sMSC-371 increased from samples a to d. The spectra of the four samples have been offset vertically.
The Journal of Physical Chemistry Letters Letter
DOI:10.1021/acs.jpclett.8b02334
J. Phys. Chem. Lett. 2018, 9, 5288−5295
Three samples were taken from theFigure 3batch when it was heated up and held at 130 °C for 10, 20, and 30 min. To test our hypothesis that the two types of MSCs originate from the same pool of precursor compounds produced in the IP, the two extra samples (10 and 30 min) were examined in the same way as the 20 min sample used forFigure 3. For the two extra samples, similar results (to those in Figure 3) were obtained and are displayed in Figure S3-2. Transmission electron microscopy (TEM), although not practical for obtaining accurate size of MSCs,19,36 suggests that the two types of MSCs are 0D NCs (Figure S3-3). Overall, incubation of one IP sample at room temperature enables the transformation of the precursor compound (produced in the IP) to dMSC-371, as indicated by the features in the absorption spectra collected from the Tol and Tol−OTA dispersions. To further assess the hypothesis, let us turn our attention to a kinetics study regarding the evolution of dMSC-371.
Figure 4a shows the evolution of dMSC-371 from a 140 °C/ 20 min sample (30 μL) immediately dispersed in a mixture with a relatively small amount of OTA, namely 2.95 mL of Tol and 0.05 mL of OTA.Table S2provides detailed information on the in situ data collection that lasted for 1370 min. In the initial stage up to 20 min, the time-resolved optical absorption spectra did not exhibit any noticeable peak. During the next stage of 30 to 200 min, absorption peaking at 371 nm steadily evolved; after 200 min, the characteristic absorption doublet
peaking at ∼350/371 nm seemed to be well developed. The 200 min spectrum in the figure is highlighted in red. The doublet absorbance at ∼350/371 nm kept increasing monotonically until 1200 min had elapsed, and changed little afterward up to 1370 min.Figure S4-1summarizes the time-dependent apparent absorbance at 371 nm, which appears to follow an S-shaped curve.
To gain a better understanding of the evolution of dMSC-371 demonstrated in Figure 4a, we explored the formation kinetics, as presented in Figure 4b. We implemented a mathematical spectral correction as part of the kinetics study; a subtraction of the linear background absorption between 330 and 390 nm was followed by least-squares fitting to two Gaussian peaks. Details of our mathematical treatment are shown in Figure S4-2. After the mathematical treatment, we obtained the results that are displayed inFigure 4b showing the time-dependent absorbance at 371 nm (open circles). The abscissa is the time scale (t) in min, and the ordinate represents the absorbance (A); the 0 min value corresponds to the 200 min red trace inFigure 4a (due to fitting limitations from the linear background used). Interestingly, the fitted curve (solid line) indicates a process that follows first-order reaction kinetics, with a rate constant of 0.004 min−1.
Regarding the gradual increase in strength of the doublet in
Figure 4a after 200 min, we propose the underlying cause is an intramolecular transformation with the reactant and product Figure 3.Optical absorption spectra (offset) collected from one IP sample (130 °C/20 min). The sample was divided into four portions for incubation periods of (a) 0, (b) 60, (c) 90, and (d) 120 min at room temperature. Afterward, the sample (30 μL) was dispersed in 3.0 mL of Tol (gray traces) and in a mixture of 2.5 mL of Tol and 0.5 mL of OTA (blue traces). The optical density (OD) is estimated for the peaks at ∼350/365 nm (gray traces) and at ∼373 nm (blue traces); the background absorbance at 390 nm was subtracted. It is noteworthy that the OD value increased for the former and decreased for the latter.
represented by CdTe dIP-371 (defined as the immediate precursor of dMSC-371) and CdTe dMSC-371, respectively. We should point out that the isomerization of CdS IP-311 ⇒ CdS MSC-311 follows the behavior of first-order reaction kinetics.12,14 For the proposed dIP-371 ⇒ dMSC-371 isomerization, the ordinate of Figure 4b is, therefore, proportional to the concentration of the product dMSC-371 at a given elapsed time (t). Critically, the time in Figure 4b differs from that inFigure 4a. The inset inFigure 4b supports the first-order reaction kinetics, for the proposed dIP-371 ⇒ dMSC-371 transformation.
For the doublet peak at ∼350 nm in Figure 4a, we performed a similar kinetics study as we did for the doublet peak at ∼371 nm inFigure 4a. The results are shown inFigure S4-3a; a first-order reaction kinetics behavior was obtained, with a rate constant of 0.004 min−1, which is identical to the previously obtained value aforementioned, within experimental uncertainty. Furthermore, the magnitude ratio of the two peaks at ∼371/354 nm (after our mathematic treatment) remains essentially constant at ∼2.1 (Figure S4-3b). Noticeably, these results are compelling evidence for the two absorption peaks in
Figure 4a at ∼350/371 nm being due to the presence of just one type of MSCs, dMSC-371 that exhibits one characteristic absorption doublet.
The development of dMSC-371 could be accelerated at 45 °C (Figure S4-4). However, RQDs appeared at 60 °C (Figure S4-5), where the absence of dMSC-371 can again be attributed to the pathway that allows the precursor compound to convert to RQD via fragmentation.13 It is reasonable that there is a limited window in temperature for accelerating the evolution of dMSC-371. We noted that the use of butylamine (BTA) instead OTA and hexane (Hex) instead of Tol can increase effectively the evolution rate (Figure S4-6). Constraints on the amount of OTA are worthy of notice, as relatively small or large amounts of OTA favor the evolution of dMSC-371 (Figure 4) and sMSC-371 (Figure 2), respectively. Unfortu-nately, the evolution of sMSC-371 occurs too quickly for us to perform a meaningful kinetics study with present methodology (Figure S4-7). However, based on previous experience with CdS IP-311 ⇔ CdS MSC-311,12−14together with the present evidence for the CdTe dIP-371 ⇒ CdTe dMSC-371 isomerization inFigure 4, it is reasonable to propose a similar
process of the CdTe sIP-371 ⇒ CdTe sMSC-371 isomer-ization, supported by results inFigures 2and S4-7. Similar to the evolution of ZnSe MSC-299,18the use of a primary instead of secondary amine is critical in the second step of our two-step approach (Figure S4-8).
Importantly, the development of the characteristic absorp-tion doublet in dispersion only occurs after a condiabsorp-tion- condition-dependent period, namely, ∼200 min in Figure 4a and ∼12 min in Figure S4-6a. During these preliminary stages (which occur before the first-order reaction kinetics evolution of dMSC-371), we propose the presence of an important activity, which is a transformation from the precursor compound produced in the IP to the immediate precursor of dMSC-371, dIP-371. For the two immediate precursors, dIP-371 and sIP-371, we propose further that they originate from the same precursor compound produced in the IP. By way of information, it takes hours to collect one 113Cd NMR spectrum; thus, the precursor compound produced in an IP sample (without purification), dIP-371, and dMSC-371 might have contributed to the113Cd NMR signal obtained.16
Unlike our previous studies for CdS IP-311, CdS MSC-311, and CdS MSC-322,12−14we have not been able to obtain the molecular weight for dIP-371 and sIP-371, nor the cluster weight for dMSC-371 and sMSC-371. Still, we propose that all of these compounds (including PCs, dIP-371, and sIP-371) have the same CdTe composition, which is also identical to that of 371 and sMSC-371. It seems likely that dMSC-371 and sMSC-dMSC-371 form a pair of polymorphs, with the same CdTe core composition but different surface ligands. Due to their instability during purification, it remains challenging to obtain purified powder samples to study structure and composition, such as would be based on X-ray diffraction (XRD), wide-angle X-ray scattering (WAXS), or X-ray total scattering with atomic pair distribution function (PDF) analysis for the former, as well as thermogravimetric analysis (TGA) and elemental analysis for the latter. It is of note that the present study seems to support the hypothesis that the structure of RQDs affects their first and second electronic transitions.37,38
In conclusion, we have systematically investigated, with optical absorption spectroscopy, the evolution of two types of CdTe MSCs from a single IP sample (such as 140 °C/20 min) Figure 4.(a) Evolution of dMSC-371 from a single IP sample at room temperature (140 °C/20 min, 30 μL dispersed in 2.95 mL of Tol and 0.05 mL of OTA mixture), which was monitored in situ by optical absorption spectroscopy. (b) Kinetics study of the transformation shown in panel a. After our mathematical treatments shown inFigure S4-2, the open circles were obtained for the time-dependent absorbance (denoted as A) at the lower energy peak position of the doublet; the 0 min value is from the 200 min red trace in panel a. The solid line represents a first-order reaction kinetics fitting. The inset shows the time dependence of ln(A∞−A) (open circles) and the corresponding first-order reaction fitting (solid line).
The Journal of Physical Chemistry Letters Letter
DOI:10.1021/acs.jpclett.8b02334
J. Phys. Chem. Lett. 2018, 9, 5288−5295
via our two-step approach. One type, symbolized as dMSC-371, exhibits an absorption doublet peaking at ∼350/371 nm. The other type, labeled as sMSC-371, displays an absorption singlet peaking at ∼371 nm. When the sample is incubated at room temperature, dMSC-371 evolves (Figure 1). When the sample (without incubation) is dispersed in Tol-OTA mixtures (with relatively low (1.7%) or high (17%) OTA volumes), dMSC-371 (Figure 4) or sMSC-371 (Figure 2) develops, respectively. When the sample is incubated and then dispersed in the mixture with 17% OTA, the resulting absorption spectrum indicates the presence of the two types of MSCs (Figure 3); the longer the incubation is, the stronger the dMSC-371 absorption is, and the weaker the sMSC-371 absorption is. Based on our experimental results, including the quantitative correlation between the two types of MSCs evolved from a single IP sample (Figure 3) and the first-order reaction kinetics behavior obtained for the evolution of dMSC-371 (Figure 4), we conclude that the precursor compound (produced in the IP sample) transforms to the immediate precursor of dMSC-371 and sMSC-371, namely, dIP-371 and sIP-371, respectively. Such a conclusion brings deeper insight into the so-called Yu Pathway proposed to describe the formation of semiconductor MSCs and RQDs.12−18,39−42We further propose that dMSC-371 and sMSC-371 are in fact polymorphs, with the same CdTe core composition but different surface ligands. The present study introduces a room temperature approach to engineer the two types of MSCs exhibiting either an absorption doublet or a singlet and moves one step forward to the understanding of the formation relationship between the two types of MSCs. Our two-step approach12−18 is very much different from the conventional hot-injection and heating-up approaches.43−45With the insight gained regarding their growth relation, which suggests that an optical absorption spectrum of a doublet may have some contribution from sMSCs, we anticipate that the present study, together with recently published work,1,12−18will stimulate a re-examination of the published results, such as those for CdSe and ZnSe MSCs exhibiting absorption doublets,2,19,25−29 and will motivate more experimental and theoretical efforts to narrow the knowledge gap regarding the structure−property relationship for the two types of MSCs.1−9,12−29,32−35
■
ASSOCIATED CONTENT*
S Supporting InformationThe Supporting Information is available free of charge on the
ACS Publications website at DOI: 10.1021/acs.jp-clett.8b02334.
Experimental details including synthesis and character-ization with absorption and TEM (PDF)
■
AUTHOR INFORMATION Corresponding Authors *E-mail:[email protected]. *E-mail:[email protected]. ORCID Shuo Han: 0000-0003-0880-1833 Hongsong Fan:0000-0003-3812-9208 Kui Yu: 0000-0003-0349-2680 NotesThe authors declare no competing financial interest.
■
ACKNOWLEDGMENTSK.Y. gives her thanks to National Natural Science Foundation of China (NSFC, Grants 21573155 and 21773162), the Fundamental Research Funds for the Central Universities (Grant SCU2015A002), and the State Key Laboratory of Polymer Materials Engineering of Sichuan University (Grant No. sklpme2018-2-08). H.F. is grateful to NSFC (Grant No. 51673128). Together, we extend our appreciation to Open Project of Key State Laboratory for Supramolecular Structures and Materials of Jilin University for Grant SKLSSM 201830. For our TEM study, we are in debt to Dr. Shanling Wang (Analytical & Testing Center, Sichuan University).
■
REFERENCES(1) Liu, Y.; Zhang, B.; Fan, H.; Rowell, N.; Willis, M.; Zheng, X.; Che, R.; Han, S.; Yu, K. Colloidal CdSe 0-Dimension Nanocrystals and Their Self-Assembled 2-Dimension Structures. Chem. Mater. 2018, 30, 1575−1584.
(2) Wang, Y.; Zhou, Y.; Zhang, Y.; Buhro, W. E. Magic-Size II−VI Nanoclusters as Synthons for Flat Colloidal Nanocrystals. Inorg. Chem. 2015, 54, 1165−1177.
(3) Ithurria, S.; Tessier, M. D.; Mahler, B.; Lobo, R. P. S. M.; Dubertret, B.; Efros, Al. L. Colloidal Nanoplatelets with Two-dimensional Electronic Structure. Nat. Mater. 2011, 10, 936−941.
(4) Wang, R.; Ouyang, J.; Nikolaus, S.; Brestaz, L.; Zaman, M. B.; Wu, X.; Leek, D.; Ratcliffe, C. I.; Yu, K. Single-Sized Colloidal CdTe Nanocrystals with Strong Bandgap Photoluminescence. Chem. Commun. 2009, 8, 962−964.
(5) Riedinger, A.; Ott, F. D.; Mule, A.; Mazzotti, S.; Knüsel, P. N.; Kress, S. J. P.; Prins, F.; Erwin, S. C.; Norris, D. J. An Intrinsic Growth Instability in Isotropic Materials Leads to Quasi-Two-Dimensional Nanoplatelets. Nat. Mater. 2017, 16, 743−748.
(6) Chen, Y.; Chen, D.; Li, Z.; Peng, X. Symmetry-Breaking for Formation of Rectangular CdSe Two-Dimensional Nanocrystals in Zinc-Blende Structure. J. Am. Chem. Soc. 2017, 139, 10009−10019.
(7) Ouyang, J.; Zaman, M. B.; Yan, F. J.; Johnston, D.; Li, G.; Wu, X.; Leek, D.; Ratcliffe, C. I.; Ripmeester, J. A.; Yu, K. Multiple Families of Magic-Sized CdSe Nanocrystals with Strong Bandgap Photoluminescence via Noninjection One-Pot Syntheses. J. Phys. Chem. C 2008, 112, 13805−13811.
(8) Ithurria, S.; Dubertret, B. Quasi 2D Colloidal CdSe Platelets with Thicknesses Controlled at the Atomic Level. J. Am. Chem. Soc. 2008, 130, 16504−16505.
(9) Joo, J.; Son, J. S.; Kwon, S. J.; Yu, J. H.; Hyeon, T. Low-Temperature Solution-Phase Synthesis of Quantum Well Structured CdSe Nanoribbons. J. Am. Chem. Soc. 2006, 128, 5632−5633.
(10) Empedocles, S. A.; Neuhauser, R.; Shimizu, K.; Bawendi, M. G. Photoluminescence from Single Semiconductor Nanostructures. Adv. Mater. 1999, 11, 1243−1256.
(11) Cui, J.; Beyler, A. P.; Marshall, L. F.; Chen, O.; Harris, D. K.; Wanger, D. D.; Brokmann, X.; Bawendi, M. G. Direct Probe of Spectral Inhomogeneity Reveals Synthetic Tunability of Single-Nanocrystal Spectral Linewidths. Nat. Chem. 2013, 5, 602−606.
(12) Zhang, B.; Zhu, T.; Ou, M.; Rowell, N.; Fan, H.; Han, J.; Tan, L.; Dove, M. T.; Ren, Y.; Zuo, X.; Han, S.; Zeng, J.; Yu, K. Thermally-Induced Reversible Structural Isomerization in Colloidal Semi-conductor CdS Magic-Size Clusters. Nat. Commun. 2018, 9, 2499.
(13) Zhang, J.; Hao, X.; Rowell, N.; Kreouzis, T.; Han, S.; Fan, H.; Zhang, C.; Hu, C.; Zhang, M.; Yu, K. Individual Pathways in the Formation of Magic-Size Clusters and Conventional Quantum Dots. J. Phys. Chem. Lett. 2018, 9, 3660−3666.
(14) Zhu, T.; Zhang, B.; Zhang, J.; Lu, J.; Fan, H.; Rowell, N.; Ripmeester, J. A.; Han, S.; Yu, K. Two-Step Nucleation of CdS Magic-Size Nanocluster MSC−311. Chem. Mater. 2017, 29, 5727−5735.
(15) Zhu, D.; Hui, J.; Rowell, N.; Liu, Y.; Chen, Q. Y.; Steegemans, T.; Fan, H.; Zhang, M.; Yu, K. Interpreting the Ultraviolet Absorption
in Spectrum of 415 nm-Bandgap CdSe Magic-Size Clusters. J. Phys. Chem. Lett. 2018, 9, 2818−2824.
(16) Liu, M.; Wang, K.; Wang, L.; Han, S.; Fan, H.; Rowell, N.; Ripmeester, J. A.; Renoud, R.; Bian, F.; Zeng, J.; et al. Probing Intermediates of the Induction Period Prior to Nucleation and Growth of Semiconductor Quantum Dots. Nat. Commun. 2017, 8, 15467.
(17) Liu, Z. Reversible Structural Isomerization Identified in Semiconductor CdS Magic-Size Clusters. Acta Phys.-Chim. Sin. 2018,DOI: 10.3866/PKU.WHXB201807016.
(18) Wang, L.; Hui, J.; Tang, j.; Rowell, N.; Zhang, B.; Zhu, T.; Zhang, M.; Hao, X.; Fan, H.; Zeng, J.; et al. Precursor Self-Assembly Identified as a General Pathway for Colloidal Semiconductor Magic-Size Clusters. Adv. Sci. 2018,DOI: 10.1002/advs.201800632.
(19) Zanella, M.; Abbasi, A. Z.; Schaper, A. K.; Parak, W. J. Discontinuous Growth of II-VI Semiconductor Nanocrystals from Different Materials. J. Phys. Chem. C 2010, 114, 6205−6215.
(20) Dukes, A. D.; McBride, J. R.; Rosenthal, S. J. Synthesis of Magic-Sized CdSe and CdTe Nanocrystals with Diisooctylphosphinic Acid. Chem. Mater. 2010, 22, 6402−6408.
(21) Dagtepe, P.; Chikan, V. Effect of Cd/Te Ratio on the Formation of CdTe Magic-Sized Quantum Dots during Aggregation. J. Phys. Chem. A 2008, 112, 9304−9311.
(22) Dagtepe, P.; Chikan, V.; Jasinski, J.; Leppert, V. J. Quantized Growth of CdTe Quantum Dots; Observation of Magic-Sized CdTe Quantum Dots. J. Phys. Chem. C 2007, 111, 14977−14983.
(23) Kudera, S.; Zanella, M.; Giannini, C.; Rizzo, A.; Li, Y.; Gigli, G.; Cingolani, R.; Ciccarella, G.; Spahl, W.; Parak, W. J.; et al. Sequential Growth of Magic-Size CdSe Nanocrystals. Adv. Mater. 2007, 19, 548− 552.
(24) Kasuya, A.; Sivamohan, R.; Barnakov, Y. A.; Dmitruk, I. M.; Nirasawa, T.; Romanyuk, V. R.; Kumar, V.; Mamykin, S. V.; Tohji, K.; Jeyadevan, B.; et al. Ultra-Stable Nanoparticles of CdSe Revealed from Mass Spectrometry. Nat. Mater. 2004, 3, 99−102.
(25) Zhang, L.; Shen, X.; Liang, H.; Yao, J. Multiple Families of Magic-Sized ZnSe Quantum Dots via Noninjection One-Pot and Hot-Injection Synthesis. J. Phys. Chem. C 2010, 114, 21921−21927.
(26) Yang, J.; Muckel, F.; Baek, W.; Fainblat, R.; Chang, H.; Bacher, G.; Hyeon, T. Chemical Synthesis, Doping, and Transformation of Magic-Sized Semiconductor Alloy Nanoclusters. J. Am. Chem. Soc. 2017, 139, 6761−6770.
(27) Wang, Y.; Liu, Y.; Zhang, Y.; Wang, F.; Kowalski, P. J.; Rohrs, H. W.; Loomis, R. A.; Gross, M. L.; Buhro, W. E. Isolation of the Magic-Size CdSe Nanoclusters [(CdSe)13(n-octylamine)13] and
[(CdSe)13(oleylamine)13]. Angew. Chem., Int. Ed. 2012, 51, 6154−
6157.
(28) Wang, Y.; Liu, Y.; Zhang, Y.; Kowalski, P. J.; Rohrs, H. W.; Buhro, W. E. Preparation of Primary Amine Derivatives of the Magic-Size Nanocluster (CdSe)13. Inorg. Chem. 2013, 52, 2933−2938.
(29) Hsieh, T. E.; Yang, T. W.; Hsieh, C. Y.; Huang, S. J.; Yeh, Y.; Chen, C. H.; Liu, Y. H.; Li, E. Y. Unraveling the Structure of Magic-Size (CdSe)13Cluster Pairs. Chem. Mater. 2018, 30, 5468−5477.
(30) Jensen, K. M.; Juhas, P.; Tofanelli, M. A.; Heinecke, C. L.; Vaughan, G.; Ackerson, C. J.; Billinge, S. J. L. Polymorphism in Magic-sized Au144(SR)60Clusters. Nat. Commun. 2016, 7, 11859.
(31) Tian, S.; Li, Y.; Li, M.; Yuan, J.; Yang, J.; Wu, Z.; Jin, R. Structural Isomserism in Gold Nanoparticles Revealed by X-ray Crystallography. Nat. Commun. 2015, 6, 8667.
(32) Yu, K.; Hu, M. Z.; Wang, R.; Piolet, M. l. L.; Frotey, M.; Zaman, M. B.; Wu, X.; Leek, D. M.; Tao, Y.; Wilkinson, D.; Li, C. Thermodynamic Equilibrium-Driven Formation of Single-Sized Nanocrystals: Reaction Media Tuning CdSe Magic-Sized versus Regular Quantum Dots. J. Phys. Chem. C 2010, 114, 3329−3339.
(33) Park, Y. S.; Dmytruk, A.; Dmitruk, I.; Kasuya, A.; Okamoto, Y.; Kaji, N.; Tokeshi, M.; Baba, Y. Aqueous Phase Synthesized CdSe Nanoparticles with Well-Defined Numbers of Constituent Atoms. J. Phys. Chem. C 2010, 114, 18834−18840.
(34) Newton, J. C.; Ramasamy, K.; Mandal, M.; Joshi, G. K.; Kumbhar, A.; Sardar, R. Low-Temperature Synthesis of Magic-Sized
CdSe Nanoclusters: Influence of Ligands on Nanocluster Growth and Photophysical Properties. J. Phys. Chem. C 2012, 116, 4380−4389.
(35) Dolai, S.; Nimmala, P. R.; Mandal, M.; Muhoberac, B. B.; Dria, K.; Dass, A.; Sardar, R. Isolation of Bright Blue Light-Emitting CdSe Nanocrystals with 6.5 kDa Core in Gram Scale: High Photo-luminescence Efficiency Controlled by Surface Ligand Chemistry. Chem. Mater. 2014, 26, 1278−1285.
(36) Xie, L.; Shen, Y.; Franke, D.; Sebastian, V.; Bawendi, M. G.; Jensen, K. F. Characterization of Indium Phosphide Quantum Dot Growth Intermediates Using MALDI-TOF Mass Spectrometry. J. Am. Chem. Soc. 2016, 138, 13469−13472.
(37) Chen, O.; Yang, Y.; Wang, T.; Wu, H.; Niu, C.; Yang, J.; Cao, Y. C. Surface-Functionalization-Dependent Optical Properties of II− VI Semiconductor Nanocrystals. J. Am. Chem. Soc. 2011, 133, 17504− 17512.
(38) Anderson, N. C.; Hendricks, M. P.; Choi, J. J.; Owen, J. S. Ligand Exchange and the Stoichiometry of Metal Chalcogenide Nanocrystals: Spectroscopic Observation of Facile Metal-Carboxylate Displacement and Binding. J. Am. Chem. Soc. 2013, 135, 18536− 18548.
(39) Yu, K.; Liu, X.; Zeng, Q.; Leek, D. M.; Ouyang, J.; Whitmore, K. M.; Ripmeester, J. A.; Tao, Y.; Yang, M. Effect of Tertiary and Secondary Phosphines on Low-Temperature Formation of Quantum Dots. Angew. Chem., Int. Ed. 2013, 52, 4823−4828.
(40) Yu, K.; Liu, X.; Zeng, Q.; Yang, M.; Ouyang, J.; Wang, X.; Tao, Y. The Formation Mechanism of Binary Semiconductor Nanoma-terials: Shared by Single-Source and Dual-Source Precursor Approaches. Angew. Chem., Int. Ed. 2013, 52, 11034−11039.
(41) Yu, K.; Liu, X.; Chen, Q. Y.; Yang, H.; Yang, M.; Wang, X.; Wang, X.; Cao, H.; Whitfield, D. M.; Hu, C.; Tao, Y. Mechanistic Study of the Role of Primary Amines in Precursor Conversions to Semiconductor Nanocrystals at Low Temperature. Angew. Chem., Int. Ed. 2014, 53, 6898−6904.
(42) Yu, K.; Liu, X.; Qi, T.; Yang, H.; Whitfield, D. M.; Chen, Q. Y.; Huisman, E. J. C.; Hu, C. General Low-Temperature Reaction Pathway from Precursors to Monomers before Nucleation of Compound Semiconductor Nanocrystals. Nat. Commun. 2016, 7, 12223.
(43) Murray, C. B.; Norris, D. J.; Bawendi, M. G. Synthesis and Characterization of Nearly Monodisperse CdE (E = Sulfur, Selenium, Tellurium) Semiconductor Nanocrystallites. J. Am. Chem. Soc. 1993, 115, 8706−8715.
(44) Peng, Z. A.; Peng, X. Formation of High-Quality CdTe, CdSe, and CdS Nanocrystals Using CdO as Precursor. J. Am. Chem. Soc. 2001, 123, 183−184.
(45) Yang, Y. A.; Wu, H.; Williams, K. R.; Cao, Y. C. Synthesis of CdSe and CdTe Nanocrystals without Precursor Injection. Angew. Chem., Int. Ed. 2005, 44, 6712−6715.
The Journal of Physical Chemistry Letters Letter
DOI:10.1021/acs.jpclett.8b02334
J. Phys. Chem. Lett. 2018, 9, 5288−5295