HAL Id: hal-02504756
https://hal.archives-ouvertes.fr/hal-02504756
Submitted on 18 Feb 2021HAL is a multi-disciplinary open access archive for the deposit and dissemination of sci-entific research documents, whether they are pub-lished or not. The documents may come from teaching and research institutions in France or abroad, or from public or private research centers.
L’archive ouverte pluridisciplinaire HAL, est destinée au dépôt et à la diffusion de documents scientifiques de niveau recherche, publiés ou non, émanant des établissements d’enseignement et de recherche français ou étrangers, des laboratoires publics ou privés.
Carbon 14 transfer from seawater to the atmosphere
through degassing processes in the Bay of Seine
(North-West of France)
M. Fontugne, D. Maro, L. Tenailleau, P. Germain, D. Hébert, M. Rozet, C.
Noury, C. Hatté, M. Paterne
To cite this version:
M. Fontugne, D. Maro, L. Tenailleau, P. Germain, D. Hébert, et al.. Carbon 14 transfer from seawater to the atmosphere through degassing processes in the Bay of Seine (North-West of France). Radio-protection, EDP Sciences, 2005, 40, pp.S595-S600. �10.1051/radiopro:2005s1-087�. �hal-02504756�
DOI: 10.1051/radiopro:2005s1-087
Carbon 14 transfer from seawater to the atmosphere through
degassing processes in the Bay of Seine
(North-West of France)
M. Fontugne
1,
D. Maro
2, L. Tenailleau
3, P. Germain
2, D. Hébert
2, M. Rozet
2,
C. Noury
1, C. Hatté
1and M. Paterne
11
Laboratoire des Sciences du Climat et de l'Environnement, UMR 1572-CEA/CNRS, Domaine du CNRS, 91198 Gif-sur-Yvette, France
2
Institut de Radioprotection et de Sûreté Nucléaire, Laboratoire de Radioécologie de Cherbourg-Octeville, 50130 Cherbourg-Octeville, France
3
Marine Nationale, Groupe d'Études Atomiques, BP. 34, 50115 Cherbourg Naval, France
Abstract. COGEMA La Hague nuclear reprocessing plant is located in the North West of Cotentin
peninsula near Cherbourg (France). This nuclear plant releases radioelements in atmosphere and in the
English Channel. About 8.5 TBq.year-1 of radiocarbon are released as the liquid wastes through a pipe a
few kilometres off sea shore, West of the reprocessing plant. Recent studies in the peninsula show anomalous higher radiocarbon contents in vegetation near the coast that have suggested a supplementary
marine contribution through the degassing of the 14C excess supplied by liquid releases of the nuclear plant.
Carbon dioxide partial pressure, 14C activities were measured in air and sea water in the Bay of Seine and
around the COGEMA-La Hague nuclear reprocessing plant during three cruises in 2000 and 2002. Results
show clearly that sea is a source of CO2 and 14C to the atmosphere. Higher 14C concentrations in air and
water related to the La Hague liquid wastes are clearly recorded. The aim of this paper is to show results of these oceanographic campaigns. Flux between seawater and atmosphere are calculated in the North-West Cotentin and in Bay of Seine.
1. INTRODUCTION
COGEMA La Hague nuclear reprocessing plant is located in the north west of Cotentin peninsula near Cherbourg (France). This nuclear plant releases radio-elements in atmosphere and in the English
Channel. Radiocarbon is released to the environment as CO2 through a 100 metres high chimney and
as liquid waste few kilometres off sea shore, west of the reprocessing plant. Atmospheric 14C releases
are estimated to 19 TBq.year-1 [1].
The carbon dioxide is assimilated by plants through photosynthetic processes. Consequently,
the 14C activity of vegetation constitute an integrated record of COGEMA La Hague emissions, during
the vegetative period (spring to fall). During 3 years (1997, 1998 and 1999) 14C measurements in air
and in furzes were performed. Measurements of 14C activity in the chimney plume show a rapid
dilution from about 7200 Bq.kg-1 C near the chimney to values ranging between 400 and 900 Bq.kg-1 C
at a distance of 4 to 6 km [2]. Outside periods of release 14C residual value is around 270 Bqkg-1 C.
Vegetation around the nuclear plant record these period of release, concentration in bio-indicators like
furzes ranging between once and twice the present atmospheric background [2] [3]. Higher 14C
concentrations are observed at the coast suggesting a supplementary marine contribution though the
degassing of the 14C excess supplied by liquid release (8.5 TBq.year-1) through a pipe few kilometres
off sea shore, west of the reprocessing plant [1].
The aim of this study is to estimate the 14C fluxes between seawater and atmosphere in the
north-west Cotentin and in the Bay of Seine.
S596 RADIOPROTECTION
2. EQUIPMENT AND METHOD 2.1 Strategy
In order to estimate 14CO
2 fluxes across the sea surface water and the atmosphere interface the partial
pressure of carbon dioxide (pCO2) were calculated using measurement of total alkalinity and pH of
water. According to Henry’s law the difference between pCO2 in air and water indicates if seawater is
a source of CO2 to the atmosphere. Carbon dioxide fluxes were calculated following equation (1).
Φ(CO2) (mole.m-2.s-1)= K. S. ∆pCO2 (1)
K (m.s-1) is the CO
2 transfer coefficient between seawater and atmosphere, S is solubility of CO2
(mole.m-3.atm-1) and ∆pCO
2 (atm) is the difference between partial pressure in water and air. pCO2 in
air was considered as constant mean value of 367 µatm [4] [5] [6] [7]. K is a parameter depending on wind speed and has been calculated by using studies of Liss and Merlivat [8], Tans et al., [9] and Wanninkhof and McGillis [10]. As these K values are slightly different in these three studies we
present the three CO2 flux estimates.
The exchange of CO2 between the atmosphere and the surface ocean is an equilibrium process,
and the nett CO2 flux is the difference between gas going from water to air and gas going from air to
water. Both these fluxes carry 14C at concentrations appropriate to the medium from where they
originate, and the nett 14C flux is, once again, the difference. The expression for the nett 14C flux from
surface ocean to the atmosphere should be of the form (equation 2).
Φ(14C) = [14C]
O ΦOA (CO2)- [14C]A ΦAO (CO2) (2)
Regarding constant factor due to appropriate units use, 14C fluxes were calculated following equation (3).
Φ(14C) (Bq.km-2.d-1)= 109 ([14C]
O .ΦOA - [14C]A ΦAO) (3)
where [14C]
O and [14C]A are the 14C concentrations (Bq.Kg-1C) in the surface ocean and air, respectively,
and ΦOA and ΦAO are the CO2 fluxes (mole.m-2.s-1) from ocean to air, and air to ocean, respectively.
This method usable if the samples are collected out of the influence of the chimney plume which
is easily detectable by the krypton 85 (85Kr) content. During 14C sampling 85Kr was measured
continuously at a frequency of 1 measurement.s-1 [11]. Consequently the detection of 85Kr emitted
from the chimney of the reprocessing plant allows air to be sampled for 14C measurements free of
direct contamination coming from the plume of the chimney.
2.2 Techniques
Sea water and air samples were collected simultaneously during two cruises (TRANSAT 1 cruise,
February 24-28th, 2002 and TRANSAT 2 cruises, August 27-31st, 2002) around north Cotentin
peninsula and Bay of Seine (figure 1).
-2.0 -1.5 -1.0 -0.5 0.0 0.5 49.0 49.1 49.2 49.3 49.4 49.5 49.6 49.7 49.8 49.9 50.0 1 2 3 à 8 9 10 11 12 131415 16 17 18 19 20 0 10 20 Cherbourg Le Havre Caen km English Channel -2.5 -2.0 -1.5 -1.0 -0.5 0.0 0.5 1.0 49.0 49.1 49.2 49.3 49.4 49.5 49.6 49.7 49.8 49.9 50.0 50.1 1 2 3 4 5 6 7 8 9 10 11 12 13 14 15 16 17 18 19 20 à 33 34 35 36 37 38 0 10 20 Cherbourg Le Havre Caen km English Channel
TRANSAT-1 : February 2002 TRANSAT-2 : August 2002
Bay of Seine Seine river Seine river Bay of Seine Nord Cotentin Nord Cotentin -2.0 -1.5 -1.0 -0.5 0.0 0.5 49.0 49.1 49.2 49.3 49.4 49.5 49.6 49.7 49.8 49.9 50.0 1 2 3 à 8 9 10 11 12 131415 16 17 18 19 20 0 10 20 Cherbourg Le Havre Caen km English Channel -2.5 -2.0 -1.5 -1.0 -0.5 0.0 0.5 1.0 49.0 49.1 49.2 49.3 49.4 49.5 49.6 49.7 49.8 49.9 50.0 50.1 1 2 3 4 5 6 7 8 9 10 11 12 13 14 15 16 17 18 19 20 à 33 34 35 36 37 38 0 10 20 Cherbourg Le Havre Caen km English Channel
TRANSAT-1 : February 2002 TRANSAT-2 : August 2002
Bay of Seine Seine river Seine river Bay of Seine Nord Cotentin Nord Cotentin
Temperature and salinity of seawater were measured using a SBE 19-03 Seabird equipment and wind
direction and speed were recorded. Only for TRANSAT cruises, CO2 partial pressure in surface sea
water were calculated using pH and total alkalinity measurements following “Standard Operating Procedures SOP3 and SOP6” of the US Department of Energy [12].
14C activity in air samples were determined using the procedure defined by Maro et al., [13].
Water samples were collected in glass bottle and poisoned with mercury chloride. In the
laboratory, total CO2 (ΣCO2) was extracted from seawater following the procedure described by Bard
et al., [14] and Leboucher et al., [15].
The radiocarbon activity was measured at Laboratoire de Sciences du Climat et de l'Environnement
using the Gif Accelerator Mass Spectrometry (AMS) facilities. Results are expressed in Bq.kg-1 C
(100 pMC is equivalent to 226 Bq.kg-1 C). The relative precision varies between 0.5 and 2%.
3. RESULTS AND DISCUSSION
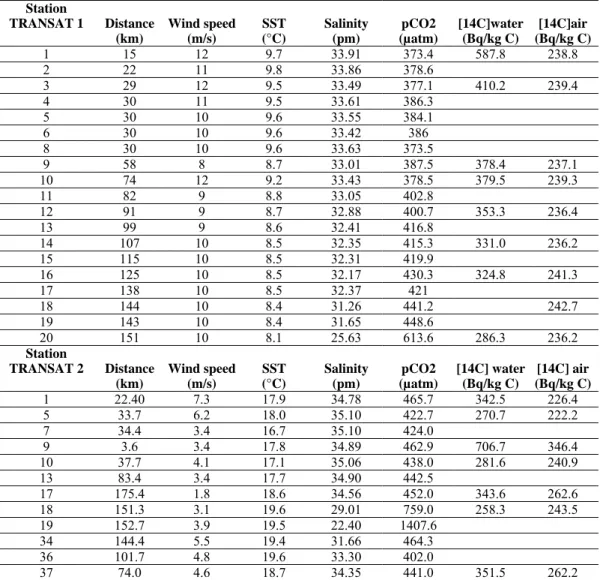
Results are presented in table 1.
Table 1. Distance from the pipe outlet, wind speed at 10m high, surface seawater temperature (SST), salinity and
CO2 partial pressure in sea surface seawater, 14C activity in seawater and air, during TRANSAT cruises.
Station
TRANSAT 1 Distance Wind speed SST Salinity pCO2 [14C]water [14C]air (km) (m/s) (°C) (pm) (µatm) (Bq/kg C) (Bq/kg C) 1 15 12 9.7 33.91 373.4 587.8 238.8 2 22 11 9.8 33.86 378.6 3 29 12 9.5 33.49 377.1 410.2 239.4 4 30 11 9.5 33.61 386.3 5 30 10 9.6 33.55 384.1 6 30 10 9.6 33.42 386 8 30 10 9.6 33.63 373.5 9 58 8 8.7 33.01 387.5 378.4 237.1 10 74 12 9.2 33.43 378.5 379.5 239.3 11 82 9 8.8 33.05 402.8 12 91 9 8.7 32.88 400.7 353.3 236.4 13 99 9 8.6 32.41 416.8 14 107 10 8.5 32.35 415.3 331.0 236.2 15 115 10 8.5 32.31 419.9 16 125 10 8.5 32.17 430.3 324.8 241.3 17 138 10 8.5 32.37 421 18 144 10 8.4 31.26 441.2 242.7 19 143 10 8.4 31.65 448.6 20 151 10 8.1 25.63 613.6 286.3 236.2 Station
TRANSAT 2 Distance Wind speed SST Salinity pCO2 [14C] water [14C] air (km) (m/s) (°C) (pm) (µatm) (Bq/kg C) (Bq/kg C) 1 22.40 7.3 17.9 34.78 465.7 342.5 226.4 5 33.7 6.2 18.0 35.10 422.7 270.7 222.2 7 34.4 3.4 16.7 35.10 424.0 9 3.6 3.4 17.8 34.89 462.9 706.7 346.4 10 37.7 4.1 17.1 35.06 438.0 281.6 240.9 13 83.4 3.4 17.7 34.90 442.5 17 175.4 1.8 18.6 34.56 452.0 343.6 262.6 18 151.3 3.1 19.6 29.01 759.0 258.3 243.5 19 152.7 3.9 19.5 22.40 1407.6 34 144.4 5.5 19.4 31.66 464.3 36 101.7 4.8 19.6 33.30 402.0 37 74.0 4.6 18.7 34.35 441.0 351.5 262.2
S598 RADIOPROTECTION
3.1 pCO2 and 14C activities
pCO2 values vary from 373 to 614 µatm for the TRANSAT 1 cruise data, and between 402 and 1408 µatm
for TRANSAT 2 cruise data. pCO2 measurements in water show similar high values compared to air
during the winter and summer cruises and increase toward Seine River estuary. This indicates CO2
flux to the atmosphere since mean atmospheric pCO2 value is 367 µatm. This results are easily
predictable because coastal and shelf and estuarine areas exhibit high biological activity due to the nutrient input near the river mouths and organic matter recycling in the water column [16]. This heterotrophic activity resulting in high degradation rates at the sediment surface and in the water
column produces high dissolved CO2 concentrations [17].
During TRANSAT cruises, 14C activities in surface water vary between 258.3 to 706.7 Bq.kg-1 C.
The highest value corresponds to a station within the plume of the liquid waste near the pipe outlet.
All these values are higher than the reference value, 239 Bq.kg-1 C (year 2002). During TRANSAT 1
winter cruise atmospheric values are near the reference value mainly due to the stormy meteorological conditions that induce a greater mixing of the atmosphere. During the TRANSAT 2 summer cruise,
14C activities in air present a positive correlation with 14C in surface water, confirming previous
results [3][13] and the transfer from the sea.
3.2 Carbon dioxide and 14C fluxes
3.2.1 TRANSAT 1
CO2 fluxes to the atmosphere are calculated from equation 1 using K transfer coefficient given in
literature [8] [9] [10]. Carbon fluxes range between few to 911 kg C. km-2.d-1 (figure 2a). For the high
pCO2 value in seawater, the difference between estimates is high nevertheless the relative differences
are constants for high and low water pCO2 values.
As 14C fluxes given by equation 3 are proportional to the carbon dioxide fluxes we observe
similar difference between estimates (figure 2b). During TRANSAT 1, the highest 14C flux is
encountered near Cherbourg City and the lowest between Cherbourg city and the Seine river estuary.
Maximum flux are 6.4 105 Bq.km-2.d-1 for TRANSAT 1.
TRANSAT-1 : 2002 0 100 200 300 400 500 600 700 800 900 1000 0 20 40 60 80 100 120 140 160
Distance from COGEMA outlet pipe (km)
CO 2 F lu x ( k g C .k m -2.d -1)
Wanninkhof & Mac Gillis Liss & Merlivat Tans et al.
TRANSAT-1 : 2002 0 100000 200000 300000 400000 500000 600000 700000 0 20 40 60 80 100 120 140 160
Distance from COGEMA outlet pipe (km)
14 CO 2 Fl u x (B q .km -2.d -1)
Wanninkhof & Mac Gillis Liss & Merlivat Tans et al.
a) b)
Figure 2. Variations CO2 fluxes (a) and 14C fluxes(b) in surface seawater versus distance from pipe
3.2.2 TRANSAT 2
Carbon fluxes range between few to 493 kg C. km-2.d-1 (figure 3a).
TRANSAT-2 : 2002 0 100 200 300 400 500 600 0 20 40 60 80 100 120 140 160
Distance f rom COGEMA outlet pipe (km)
CO 2 F lux ( k gC .k m -2.d -1)
Wanninkhof & Mc Gillis Liss & Merlivat Tans et al.
TRANSAT-2 : 2002 0 20000 40000 60000 80000 100000 120000 140000 160000 180000 200000 0 20 40 60 80 100 120 140 160
Distance f rom COGEMA outlet pipe (km)
14CO 2 Fl u x ( B q .k m -2.d -1)
Wanninkhof & Mc Gillis Liss & Merlivat Tans et al.
a) b)
Figure 3. Variations CO2 fluxes (a) and 14C fluxes(b) in surface seawater versus distance from pipe
outlet during TRANSAT 2.
Although water pCO2 are higher during this cruise the carbon dioxide fluxes are smaller due to the weak wind
speed. During this cruise maximum 14C fluxes values were encountered near Cherbourg city and minimum
values near Seine river estuary (figure 3b). Maximum flux are 1.7 105 Bq.km-2.d-1 for TRANSAT 2.
3.2.3 Annual flux estimate for the Bay of Seine
Following estimates derived from Tans et al. model, the mean flux in the Bay of Seine due to
COGEMA La Hague liquid wastes would reach 2.3 105 and 3.9 104 Bq.km-2.d-1 for TRANSAT 1 and 2
respectively. A rough annual estimation would give 216GBq for the 4400 km-2 of the Bay of Seine,
representing less than 3% of the liquid release from COGEMA La Hague nuclear reprocessing plant.
4. CONCLUSION
Simultaneous measurements of CO2 partial pressure and 14C activity in air and sea water indicate that
the English Channel and Bay of Seine are a source a carbon dioxide to the atmosphere in good
agreement with previous studies. 14C activities decrease from the west to the east according to the
dilution of the waste plume of the plant. Estimations of CO2 and 14C flux show that a minor part of the
14C liquid release by industrial activity is recycled to the atmosphere. These estimates are not very
accurate due to the variation of CO2 transfer coefficients propose by different models. However, the
14C releases in Bay of Seine could provide a good opportunity to perform new experiments in order to
get better estimates of CO2 transfer coefficients between water and atmosphere.
Acknowledgements
The authors thank Messrs Le Bar and Schgier, Mrs Fitamant and her team at COGEMA for helping us during these campaigns. We also thank Messrs Le Bourhis and Henri, captains of the CNRS oceanographic vessel "Côtes de La Manche" and their crews.
S600 RADIOPROTECTION
References
[1] COGEMA., Surveillance trimestrielle de l’environnement de la Hague. Rapport Hag. 055000120013 (2000), 84p.
[2] Fontugne M, Maro D, Baron Y, Hatté C, Hébert D, Douville E. Source and distribution of radiocarbon in the vicinity of La Hague nuclear reprocessing plant: Part I Terrestrial environment.
Radiocarbon 46 (2004), 826-830.
[3] Fontugne M., Maro D., Baron Y., Hatté C., Hébert D. and Douville E., Identification of sources and distribution of radiocarbon in the vicinity of La Hague nuclear reprocessing plant,
Radioprotection 37, C1 (2002) 1271-1276.
[4] Copin-Montégut G, 1996. Chimie de l’eau de mer. Institut Océanographique, Paris: 319p.
[5] Boehme SE, Sabine CL, Reimers CE. 1998. CO2 fluxes from a coastal transect : a time-series
approach. Marine chemistry 63: 49-67.
[6] Frankignoulle M, Borges AV. 2001. European continental shelf as a significant sink for atmospheric carbon dioxide. Global biogeochemical cycles 15 (3): 569-76.
[7] Keir RS, Rehder G, Frankignoulle M.,2001. Partial pressure and air-sea flux of CO2 in the
Northeast Atlantic during September 1995. Deep Sea Research Part II: Topical Studies in
Oceanography, 48, (14-15): 3179-89.
[8] Liss PS, Merlivat L. 1986. sea exchange rates: introduction and synthesis. In: The Role of
Air-Sea exchange in Geochemical Cycling, P. Buat-Ménard (ed.), D. Reidel: 113-27.
[9] Tans PP, Fung IY, Takahashi T.,1990. Observational Constraints on the Global Atmospheric CO2
Budget. Science 247: 1431-38.
[10] Wanninkhof R, McGillis WR. 1999. A cubic relationship between air-sea CO2 exchange and
wind speed. Geophys. Res. Letters 26(13): 1889-92.
[11] Maro D, Crabol B, Germain. P, Baron Y, Hébert D, Bouisset P. 2002. A study of the near field atmospheric dispersion of emission at height: Comparison of Gaussian plume models (Doury, Pasquill-Briggs, Caire) with krypton-85 measurements taken around La Hague nuclear reprocessing plant,. Radioprotection 37(C1): 1277-82.
[12] DOE, 1994. Handbook of methods for the analysis of the various parameters of the carbon
dioxide system in sea water. Version 2, A. G. Dickson & C. Goyet (eds). ORNL/CDIAC-74.
[13] Maro D, Fontugne M, Hatté C, Hebert D, Rozet M. Source and distribution of radiocarbon in the vicinity of La Hague nuclear reprocessing plant: Part II Marine environment. Radiocarbon 46 (2004), 831-839.
[14] Bard E, Arnold M, Ostlund HG, Maurice P, Monfray P, Duplessy JC. 1988. Penetration of bomb radiocarbon in the tropical Indian Ocean measured by means of accelerator mass spectrometry.
Earth Planet. Sci. Lett., 87: 379-89.
[15] Leboucher V, Orr J, Jean-Baptiste P, Arnold M, Monfray P, Tisnerat-Laborde N, Poisson A, Duplessy JC. 1999 Oceanic Radiocarbon between Antarctica and south africa along WOCE section I6 at 30°E. Radiocarbon 41: 51-73.
[16] Savoye N, Aminot A, Tréguer P, Fontugne M, Naulet N, Kérouel R. 2003. Dynamics of
particulate organic matter δ15N and δ13C during spring phytoplankton blooms in a microtidal
ecosystem (Bay of Seine, France). Marine Ecology Progress Series 255: 27-41.
[17] Abril G. 1999. Dynamique du carbone dans les estuaires européens : processus de minéralisation et transfert continent-océan-atmosphère. Thèse de doctorat, Université de Bordeaux I: 173-209.